2395-0056
Volume: 09 Issue: 10 | Oct 2022 www.irjet.net p-ISSN: 2395-0072

Fuzzy Analytical Hierarchy Process Method to Determine the Project Performance in the portfolio.
Mr. Rohit Bhausaheb Sonkamble1 , Dr. D. N. Raut21Student, Dept. of Production Engineering (Project Mgmt.), VJTI college of Engineering, Mumbai, India.
2Professor, Dept. of Production Engineering, VJTI college of Engineering, Mumbai, India. ***
Abstract –
When reaching a decision most preferable way is to go through the analytical way instead of taking decisions without considering all thefactors. Analyzing theproject performance in the portfolio requires a special ability, full knowledge and as well as years of experience working in the industry. However, many times measuring a verbal expressioncanbetaken into account for better decision making and it can offer precise interpretation in Infront of an observer. therefore, while making the decisions, need of a proper analyze of every factor’s impact is essential.
The diversity of the projects in the industry cannot be mapped as it has a too wide scope. Also, the human mind is vulnerable to errors while quantifying and analyzing various factors and variables and having sure decision-making and a trustworthy tool is essential. studies and Scholars suggest the Analytical Hierarchy Process (AHP) as the best method for deciding among the complex criteria structures at different levels. The fuzzy AHP is the nothing but an extensionoftheClassical AHP. The study used in this paper is Fuzzy Analytical Hierarchy process which isone of the most usedmethods by the decision makers in various sectors. Also, Fuzzy AHP is preferred while dealing with different decisionmaking issues. This paper utilizes the F-AHP to prioritizes the projects in the portfolio.
1.INTRODUCTION
There are always various confusions with decision making if there are various options available, and studiesshowsthatwhilemakingadecisionwithpredeterminedcriteriaisalwaysdifficult.Decision-making issues are can be faced while analyzing the project performanceintheportfolio.Thediversityofprojects andtheirscopewithconfiguration,Time,Demandand othersomanyfactorsserveasconstraintswhendatais incompleteandthereisalackofindividualknowledge about analyzing the performance of the project. To haveavalidperformanceanalysisoftheprojectsevery factormentionedinthepapershallbeconsideredto performanerror-free analysis. Previous papers and
numerous studies have used the F-AHP method and proventhatF-AHPcanbeusedasadecision-making tooltotakeharddecisionsinreallife
TworesearchersKer-WeiYuandChien-ChangChou [1]hadproposedahybridfuzzyAHPmethodthathelps to deal with the decisions based on uncertain and multiple criteria environments, in which F-AHP methodtechniquescombineswiththeAHPwithfuzzy set theory. [2] The method proposed by Ker-Wei Yu andChien-ChangChou[1]cantotallyconcentrateon evolution criteria along with thinking logic by the humanbeing. Inthe paper [3]resultsshow different categories such as safety, health, environmental, aspectsaswellasphysiochemicalpropertiesshowsthe bestbalanceofperformanceineveryaspect.
AfewassumptionswecanunderstandmadeinFAHP are all the criteria and factors involved are independentofeachother.However,intherealworld, the relationship between criteria is complex to understand,andtherearehugechancesthattheycan be interdependent. To analyze the projects with no error we need relevant elements & methods [4].
The MCDM methods have various options while using the Fuzzy model. [5] The f-AHP model can be helpful for most decision-makers [6]. the fuzzy AHP methodisusedtocontrolforanalysisandisusefulfor various multicriteria decision-making problems [7] peoplethinkthecostoftheprojectsdoesmatterbut other criteria like quality of the product as a comparisoncanmakethequalityproductsbetterthan low-costproducts.[8]F-AHPmethodcanhelpdecision makersmoreefficient,flexible,andrealisticdecisions based on various criteria and alternatives [9]. Therefore,wecanusetheF-AHPmethodtoanalyzethe projectperformanceintheportfolio.
1.1 Data of the Projects
Table 1:Data here referred for the studyhave taken from the portfolio of an industry which shall not be disclosedthatcancauseprivacyissues.Authorshave takenappropriatestepstopreservetheconfidentiality ofstudyparticipantsandthedatacollectedfromthem.
International Research Journal of Engineering and Technology (IRJET) e-ISSN: 2395-0056
Volume: 09 Issue: 10 | Oct 2022 www.irjet.net p-ISSN: 2395-0072
Portfolio Time-line
Cost Est. Revenue Resources Used
Project 1 15 Months 180 K Euros 24 K Euros 57 Persons
Project 2 12 months 150 K Euros 14 K Euros 48 Persons
Project 3 12 months 140 K Euros 21 K Euros 52 Persons
Project 4 14 months 160 K Euros 17 K Euros 40 persons
Table -1: ProjectDatausedforthecalculations(ValuesarePerPrototype)
Define the Problem
Create a comparison matrix
Checking for consistency
Set up Triangular Fuzzy number (TFN)
Calculate the weight value of the fuzzy vector
Ranking and selection of decisions
Figure 1: Block diagram has six steps of F-AHP phase
1.2 Privacy Policy
Datausedintheresearchistobekeptconfidential.In ordertofullyunderstandtheimplicationsofthestudy, itisnecessarytokeepthedataconfidential.Thiswill help protect the participants and the research team. Thisdataisgatheredthroughsurveysandinterviews, and any information that could identify the participantsiscarefullyguarded.Thesourcesusedin this paper were all anonymous, meaning the researcherwillnotbeabletoidentifythem.Theauthor feels that this keeps the data more objective and unbiased.
Table -1: Please refer to dataset mentioned in table format.
1.3 Materials and Methods
AnalyticalHierarchyprocess(AHP)isamethodwhich breakdown the problem along with the solutions. Mainly it was developed to support the decision making,itdoesbreakdowntheproblem,thesolutionof a problem and groups them to convert it into a hierarchical structure that gives us priority criteria. Thismethodusesalreadydeterminedmeasurements alignedwithcriteriatogiveoutput.Themaininputfor themethodisgivenbythestakeholdersorexpertsof thesubjecttherefore,there’salsoafactorof
reclamation of a decision inconsistency limits along withdatavalidityalsogetconsidered.[10]
Inthismethoddatavaliditywithinconsistency,and limitsarealsogetconsidered.[10]Whileperforming theanalysistheconsiderationofuncertaintyandthe marginoferroralsothedoubtingivingtheassessment definitelycancauseaffectresults.weneedtodefinethe problemaccordingtothecriteriausedtodeterminethe projectperformance.Time,Cost,features,anddemand are mainly used as determining criteria for determiningprojectperformance.
Step 1:Inordertoreviewtheprojectperformancein the portfolio according to the criteria used to determineiswithfollowingfactorsareTimeline,Cost, revenue&resources.Thus,duetoprivacyconcernthe datasourcecannotbedisclosed.
Step 2:ToCreatecomparisonmatrixweshallconsider thedatasourceavailableintablenumber1.Thematrix referred is simple and has strong position for consistency framework. The equation used for determiningpairwisecomparisonisasfollows.
International Research Journal of Engineering and Technology (IRJET) e-ISSN: 2395-0056
Volume: 09 Issue: 10 | Oct 2022 www.irjet.net p-ISSN: 2395-0072
EquationusedtodeterminePairwisecomparison: Eq-1
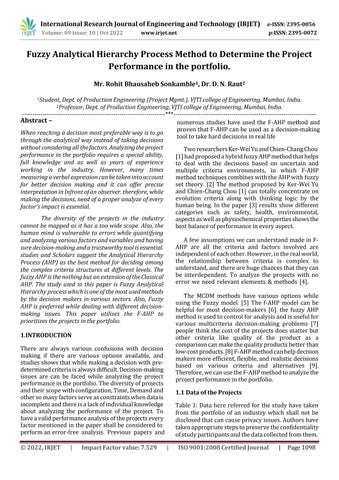
Where, n=Numberofcriteriacompared. wi=WeightofanIcriterion. Aij=isratiooficriterion&jcriterion.
AfterknowingthecomparisonofitscriteriainTable2, thenextthingdoneistonormalizeeachcolumninto theAdvancesinFuzzySystems.
calculatetheeigenvector,weusethefollowing equation:
…Eq-4
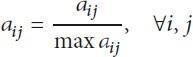
The largest eigenvalue is the number of times multiplying the number of columns with the main eigenvector(seeTable4).So,itcanbeobtainedbythe equation.
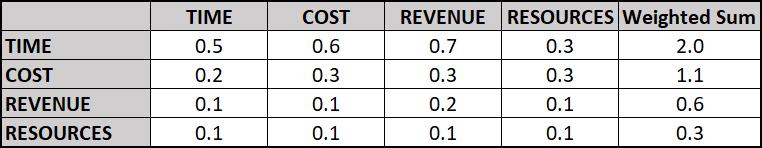
CRITERIA TIME COST REVENUE RESOURCES TIME 1 2 4 4 COST 1/2 1 2 4 REVENUE 1/4 1/2 1 2 RESOURCES 1/4 1/4 1/2 1
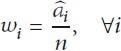
Matrixformbydividingeachvalueinthecolumni androwjwiththelargestvalueincolumni.
Eq-2
TheNormalizedmatrixisasfollowsfrom Table 2
Eq-3
Step 3: The consistency index and random index generatorcomparisonisasfollowsbySaaty[10]This valuedependsonthematrixordern. Here is the equation used to calculate the value of consistency.
First,wemustrecognizethevalueoftheeigenvector which is the weighted value of the criterion. To
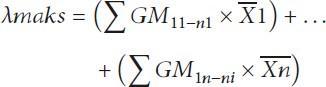
Table 2: Comparisonofcriteria,astheweightedvalueofeachcriterion. © 2022, IRJET | Impact Factor value: 7.529 | ISO 9001:2008 Certified Journal
The largest eigenvalue is the number of times multiplyingthecolumnswithmaineigenvector. So,Equationusedisasfollows:
….Eq-4
Table 4: Eigenvectoroncriteria.
International Research Journal of Engineering and Technology (IRJET) e-ISSN: 2395-0056
Volume: 09 Issue: 10 | Oct 2022 www.irjet.net p-ISSN: 2395-0072
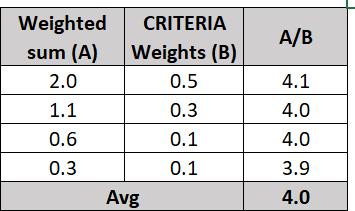
Table 5: Weightedsumvaluecalculatedisasfollows.
The equation through which we can calculate the consistencyindexalsowiththehelpof“n”-Numberof criterions.
Eq-5
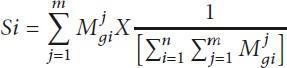
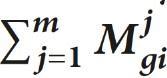
��=fuzzysynthesisvalue
= summing the cell value in that columnstartingfromcolumn1ineachrowmatrix i=row j=column.
Step 6: Defuzzificationordinatevalue.
Comparefuzzysynthesisvaluestogetdefuzzification ordinatevalue.
So,weget, λmax = 4.0 andcalculatingCI(Consistency Index)
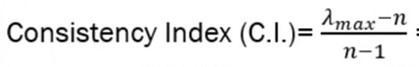
CI=(4-4)/(4-1)=0
Hence,thematrixisconsistentandtheweightvalues weareconsideringarecorrect.
W1=0.5
W2=0.3
W3=0.1
W4=0.1
Step 4:setupTriangularFuzzyNumber
There are three values in F-AHP scale and those are lowestvalue(lower,L),middlevalue(median,M),and highestvalue(upper,U).PleasereferthetableNumber
Refer(TableNumber
Step 5: In order to calculate Fuzzy synthesis value, need to transform AHP Comparison values to F-AHP scale value. This can be achieved by using following formula.
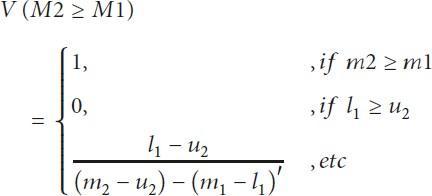
ToCalculate:V’wecanusefollowingformula. ….Eq–7
ToCalculatefuzzyvectorweight(W’).wecanuse followingformulatocalculatefuzzyweightvalue.
….Eq–8
Previouslyobtainedordinatevaluesasbelow.
….Eq–9
Using the following formula, we can normalize the weightvectorsobtained.
….Eq–9 …..Eq-6
© 2022, IRJET | Impact Factor value: 7.529 | ISO 9001:2008 Certified Journal | Page
International Research Journal of Engineering and Technology (IRJET) e-ISSN: 2395-0056
Volume: 09 Issue: 10 | Oct 2022 www.irjet.net p-ISSN: 2395-0072
Table 6:AdvancesinFuzzySystems(TriangularFuzzyScale)
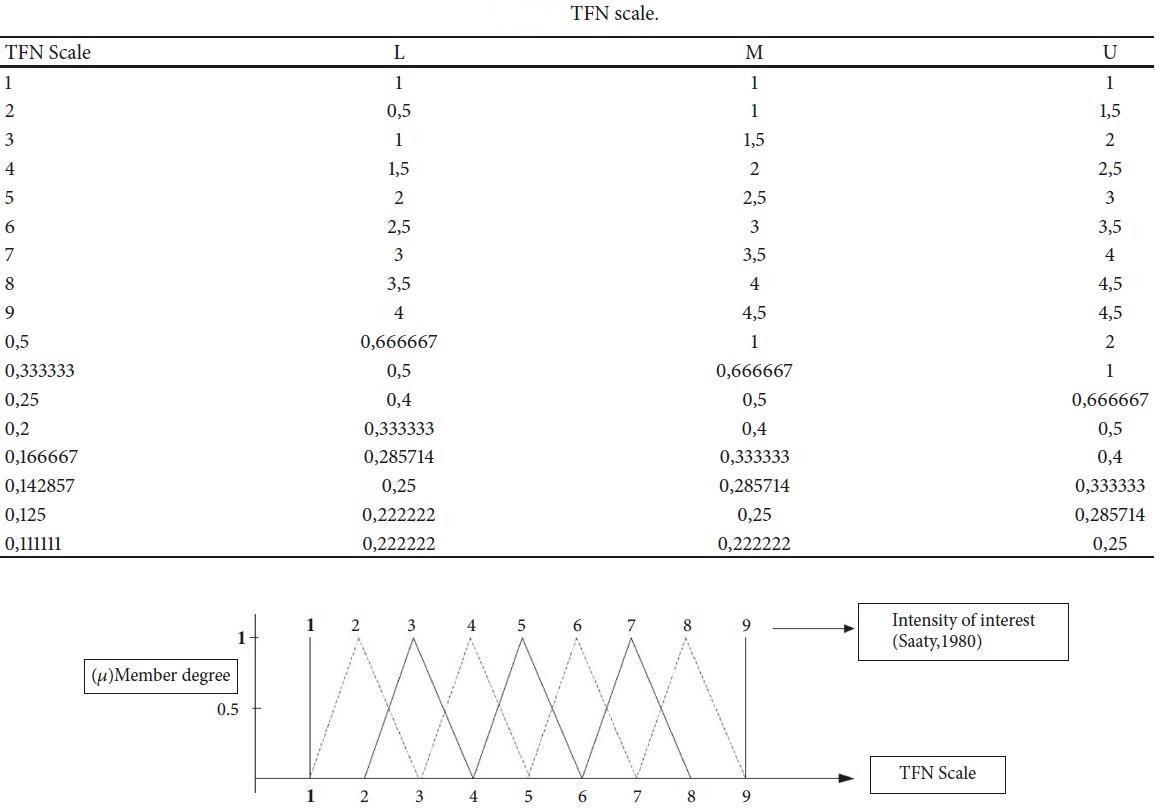
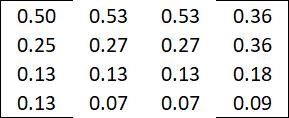
Figure3:GraphofFuzzyTriangleSetgiveabove.
Table 7:TFNsetofcriteria;eachvalueinthecriteriacomparison(seeTable6)ischangedtoTFNreferring totheTFNscale.
Thecalculationofeachcriteriaweightvalueis given below.
International Research Journal of Engineering and Technology (IRJET) e-ISSN: 2395-0056
Volume: 09 Issue: 10 | Oct 2022 www.irjet.net p-ISSN: 2395-0072
Step 7: Ranking the projects in portfolio
CollectingOrdinateValuesPreviouslyobtained ….Eq-10
VectorWeightValuesNormalization ….Eq-11
1.4 Discussion
While performing the calculation the help from exceltoolsaswellasusingonlineAHPPortalscan be taken for ease & accuracy of calculation. andsupportdecisionmaking.
Considering all the factors the results are as follows.
Portfolio
Time-line
Figure4:Rankinggraph
TheabovefigureshowsthattheProjectnumber1has highest weight, and it is performing well in the portfolio.
Cost Est. revenue resources used Weights
Project 1 15 Months 180 K Euros 24 K Euros 57 Persons 0.289934663
Project 4 14 months 160 K Euros 17 K Euros 40 persons 0.247118795
Project 3 12 months 140 K Euros 21 K Euros 52 Persons 0.237492501
1.5Result
Here with the results, we can see their project performanceintheportfolioisintheorderofProject1, Project4,Project3,and Project2withrespective weightsof0.2899,0.2471,0.2374&0.2249.
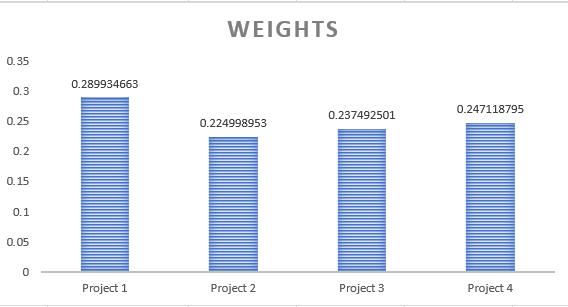
Withthedatawecanclearlystatethatintheportfolio theproject4whichisdevelopmentofaprototypehas performedwelltillnow.
1.6 Conclusion
Project 2 12 months 150 K Euros 14 K Euros 48 Persons 0.224998953 © 2022, IRJET | Impact Factor value: 7.529 | ISO 9001:2008 Certified Journal
Conclusionof this studyarticle is that F-AHPsystem canbeimplementedtoanalysesandfindoutaccurately intheprojectmanagementfield.
ItcanalsoassistprojectManagertotakedecisionswith appropriate analysis of project performance in the portfoliousingAHP&F-AHP.
International Research Journal of Engineering and Technology (IRJET) e-ISSN: 2395-0056
Volume: 09 Issue: 10 | Oct 2022 www.irjet.net p-ISSN: 2395-0072
REFERENCES
[1]Chien-ChangChouandKer-WeiYu,“Application of a New Hybrid Fuzzy AHP Model to the Location Choice,” Mathematical Problems in Engineering, vol. 2013,ArticleID592138,12pages,2013.
[2]H.-Y.Wu,G.-H.Tzeng,andY.-H.Chen,“Afuzzy MCDMapproachforevaluatingbankingperformance based on Balanced Scorecard,” Expert Systems with Applications,vol.36,no.6,pp.10135–10147,2009.
[3]J.Ooi,M.A.B.Promentilla,R.R.Tan,D.K.S.Ng,d N.G. Chemmangattuvalappil, “Integration of Fuzzy AnalyticHierarchy Process into multi-objective Computer Aided Molecular Design,” Computers & ChemicalEngineering,vol.109,pp.191–202,2018.
[4] J.-C. Tu and C.-L. Hu, “Applying the Fuzzy Analytic Hierarchy Process to Construct the Product Innovative Service System of Wedding Photography Apparel,”MathematicalProblemsinEngineering,vol. 2015,2015.
[5] M. Shaverdi, “Application of Fuzzy AHP Approach for Financial Performance Evaluation of Iranian Petrochemical Sector,” Procedia Computer Science,pp.995–1004.
[6]R.-H.Chiu,L.-H.Lin,andS.-C.Ting,“Evaluationof green port factors and performance: a fuzzy AHP analysis,”MathematicalProblemsinEngineering,vol. 2014,ArticleID802976,12pages,2014.
[7] L.Wang, J. Chu, and J.Wu, “Selection of optimummaintenane strategies based on a fuzzy analytic hierarchy process,” International Journal of Production Economics, vol. 107, no. 1, pp. 151–163, 2007.
[8] S.-H. Tsaura, T.-Y. Chang, and C.-H. Yen, “The evaluationofairlineservicequalitybyfuzzyMCDM,” Tourism Management, vol. 23, no. 2, pp. 107–115, 2002.
[9] Kaur, “Selection of Vendor Based on Intuitionistic Fuzzy AnalyticalHierarchy Process,” AdvancesinOperationsResearch,vol.2014,ArticleID 987690,10pages,2014.
[10]T.L.SaatyandK.P.Kearns,AnalyticalPlanning eOrganizationofSystems,PergamonPress,1985..
IRJET | Impact Factor value: 7.529 | ISO 9001:2008 Certified