International Research Journal of Engineering and Technology (IRJET) e-ISSN:2395-0056

Volume: 09 Issue: 10 | Oct 2022 www.irjet.net p-ISSN:2395-0072
International Research Journal of Engineering and Technology (IRJET) e-ISSN:2395-0056
Volume: 09 Issue: 10 | Oct 2022 www.irjet.net p-ISSN:2395-0072
1Student, Oakridge International School, Varthur Rd., Circle, Dommasandra, Bengaluru, Karnataka 562125, India ***
Abstract - Machine Learning has become increasingly pervasive in the fieldof medicine. Though the large majority of ML-based research focuses on detecting tumors, brain damage, and physical injuries, mental health has not received much attention. The current machine learning models typically fail to consider emotional variability and the extremes of data points when predicting the prevalence of depression. Furthermore, these models don’t align with universally-accepted models like Beck’s Depression Inventory. It is hypothesized that emotional variability, level of depressive symptoms, amount of labeled data and features correlate with improvements in the accuracy of an ML model. The preliminary results suggest that there is a positive correlation between the level of emotional variabilityandtheamountoflabeleddataandfeatureswith a model’s accuracy. In this study, we considered the ability to predict depression through self-reporting, where emotional variability was taken into account through a novel baseline model (which uses a participant’s most frequently responded answer). Discussing the findings, we considered(i)aneffective meansfordatacollectionthrough questionnaires was developed, (ii) a necessary quantitative improvement for each model was constructed, and (iii ) a random forest classifier was found to be the best ML model to predict the incidence of depression. In brief, this research paper assesses the accuracy, reliability, and effectiveness of these ML algorithms, as well as the benefits and drawbacks of the implementation of these algorithms. Though further work and a larger-scale study are required, this paper takes astepintherightdirectioninself-reportingdepression.
results, and other heavily quantitative figures, emotional well-being has not been explored enough. Mental health illnessesarepernicioustothosewhoareaffectedbythem, “gettinginthewayofthinking,relatingtoothers,anddayto-day function, according to Harvard Health [1]”. Collectively, these illnesses, such as depression, have become highly pervasive affecting more than 264 million peoplein2020aloneandtheyarenowthe“leadingcause of disability in the world” making the treatment of these illnesses a worldwide priority. [2] Improving mental health, however, is extremely challenging as they can manifest in various symptoms and there is yet to be a standardized model for detecting the incidence of depression(andothermentalhealthillnesses).
Therefore, this research aims to answer the question: “How efficient are the four machine learning models (Logistic Regression & Random Forest Classifiers & MultiLayer Perceptron) at quantitatively predicting the incidence of depression inyoung adolescentsas comparedto their BDI levels(Beck’sDepressionInventory)?”
Words: Mental Health; Depression; Machine Learning; Supervised Learning; Artificial Intelligence; Detection; Models
The applications of machine learning to solve or contribute to complicated tasks have grown increasingly popular in the last two decades. Machine learning has assisted health care practitioners with accurately predicting, diagnosing, classifying, and assessing outcomes. While the status quo has been fixated on constructing models based on CT scans, X-rays, test
This paper will explore the potential appropriateness of using machine learning models to detect, and ultimately predict,symptomsofdepressionbasedontheconsistency of data collected. The research proposed encompasses a quantificationoftheefficacyofdetectingdepressionusing machine-learningmodels(LogisticRegressionwithL1and L2 regularization, Random Forest Classifiers, Multi-Layer Perceptron, Extra Trees Classifier, and Decision Tree Classifier) on young adolescents aged 13-21. These machine learning models will be built upon the consistency of an individual’s response to AADA’s screening detection [3]. Until now, researchers, justified by eliciting self-response bias, have run machine learning modelsonalternativesourcesofdata(likeGPStrackingor the Screen Time of an individual [8]). As these measures are subject to the individual's personality and preference for electronics, these also carry significant biases. Hence, to eliminate this issue, I have turned to measure the data points several times to improve the precision of the research. I will also take into account these biases when constructingthemodels.
International Research Journal of Engineering and Technology (IRJET)
e-ISSN:2395-0056
Volume: 09 Issue: 10 | Oct 2022 www.irjet.net p-ISSN:2395-0072
A limited number of research papers focused on comparing these machine learning models with universally accepted models used to diagnose individuals with mental health illnesses like BDI (Beck’s Depression Inventory). Additionally, by surveying unconventional data points(i.e. young adolescents of ages 13-21) that are subject to emotional volatility rather than adults, this research will test the ends and means of depressiondetectingmodelsandperhapstunethemselvestofitthese individuals. My research is predominantly based on surveys and empirical data collection. I will use a simple google form to collect participants’ responses to the AADA’s (Anxiety & Depression Association of America) screeningdetectionsurvey.Thissurveyisusedgloballyto diagnose patients with depression or depressive symptoms.Every4thday,Irequestedtheparticipanttofill out the form over 2 weeks. After the 2nd week, I will go throughthedata andverify whether therearea sufficient number of data points to go with the study. Upon the preliminary selection of data, the 6 machine learning modelswillbeconstructedbasedontheconsistencyofthe participant'sresponses.Usingthesemodels,Iwilldevelop correlations between their results to determine how accurateonemodelisascomparedtoanother.
The dual-edge of my research is comparing these models to the participants' BDI levels, which will also be derived fromasurvey[4]andfilledoutonlyonceonthefirstdayof the study. I will again develop correlations between the results from the machine learning models and the respective participant’s BDI levels. Rather than developingnovelmachinelearningmodelsthatcandetect depression symptoms, this research focuses on quantifying the efficacy of the pre-existing models at detectingtheprevalenceofdepressionandconfirmingthe relationshipbetweenourmodels’predictionandtheirBDI levels, a universally-accepted way to detect depression and other mental health illnesses. While further work is needed in building new depression-detecting models, conducting this research is a step in the right direction in understanding whether or not machine learning models candetectdepressivesymptoms.
This study heavily weighs on two universally-accepted modelsforpredictingtheincidenceofdepression,namely theAnxiety&DepressionAssociationofAmerica’s(AADA) screening for depression [9] and Beck’s Depression Inventory [10]. The AADA’s screening is “based on (the) PatientHealthQuestionnaire-9(PHQ-9)developedbyDrs. Robert L. Spitzer, Janet B.W. Williams, Kurt Kroenke, and colleagues.” The screening consists of 10 multiple choice questions which target the emotional stability and
depressive symptoms in its participants. There are 4 options for every question in the screening: “not at all”, “several days”, “more than half the days”, and “nearly every day”. Based on the responses to the screening, it is possible to get the respondent's level of depression, after consulting a healthcare professional. Since this form highlights key depressive symptoms, it has been used to determine the impact of these factors on an individual’s mentalhealth. Inotherwords,the10factorsthataffectan individual’s mental health are as follows: levels of (1) interest/pleasure in the conduct of activities, (2) feeling down/depressed/hopeless, (3) ableness/disableness to sleep,(4)energy,(5)ableness/disablenesstoeat,(6)selfesteem, (7) concentration in the conduct of activities, (8) slowness/restfulness in the conduct of activities, (9) suicidal thoughts, and (10) difficultness in the ability to conductone’slife.
Beck's Depression Inventory is a “21-item, self-rating inventory that measures characteristic attitudes and symptoms of depression [11].” Both of these modelshave been widely accredited for accurately predicting depression amongst their participants. The BDI model categorizes respondents’ level of depressive symptoms under 6 categories, based on adding up the points assigned for every option chosen in the questionnaire (also known as the BDI index/value). Respondents with BDIvaluesbetween1-10,11-16,17-20,21-30,31-40,and over 40 are diagnosed as having “ups and downs that are considerednormal”,“mildmooddisturbance”,“borderline clinical depression”, “moderate depression”, “severe depression”, and “extreme depression.” In this paper, the BDImodelwasusedtodeterminewhetherornotaperson was “diagnosed” with depression, where a BDI count greater than 17 or “Borderline Clinical Depression” was countedasdepressed.Similarly,theAADA’sscreeningwas used to get consistent data on the participant’s emotional stateandbuildourmodels.
The necessity of this research paper is highlighted by the shortage of papers that look at detecting depression in youngadolescents, oneof thelargest populationsthat are adverselyaffectedbymentalhealthillnesses[13],through thelensofmachinelearning.Thelargemajorityofpapers lookatpredictingtheincidenceofdepressionamongstan older population or the working population, as seen in papers[6]andpapers[7].
Pastresearchhaspredominantlyfocusedonusingsurveys to identify factors that can affect one’s mental health, but the application of machine learning tools has not been touched upon to such an extent. For instance, Melissa
International Research Journal of Engineering and Technology (IRJET) e-ISSN:2395-0056
Volume: 09 Issue: 10 | Oct 2022 www.irjet.net p-ISSN:2395-0072
Deziel et. al from the University of Waterloo, Canada [5] employed survey results that rate five essential factors (i.e. ability to enjoy life, resilience, balance, emotional flexibility, and self-actualization) of a student’s mental health as defined by the Canadian Mental Health Association. Though machine learning models like classification and regression have been used, the researchers do notcompare andcontrast the efficiency of these two models or shed light on whether or not these models can even detect depressive symptoms. Previous researchpapersalsooverlookprovidingimprovementsto models that can be measured quantitatively. Similarly, M. Srividyaet.alfromtheJournalofMedicalSystems[6]does use various machine learning models such as cross Validation,decisiontrees,naïveBayesclassifier,K-nearest neighbour classifier, and logistic regression to identify how depressed their participants were. Though the study primarilyintendstofocusonvariousMLmodelstodetect depression, the paper does not provide insight into the efficiency of these models and how we can improve our current models. The paper’s omission of our progression asafieldwasnotsubstantiatedorrationalized.Cognizant of these limitations, paper [8] not only quantitatively compares each machine learning model to each other but alsoBeck’sDepressionInventory.
However, unlike paper [8], this research paper will target data collection through self-report rather than GPS tracking, as this facet weighs extensively on the upbringingofanindividual,whetherornottheyusetheir mobile devices frequently or in limited usage, etc. Contrarytopopularbelief[12],thispaperprovesthatitis possible to use self-report to predict the incidence of depressioninanindividualusingafewguidelinesthatare mentioned below. Additionally, this paper takes into considerationanadolescent’semotionalvariability[14],a largefactorintheimprovementintheaccuracyoftheML models; this facet is not taken into account in the papers above,amissedopportunity.
As a field, we still lack adequate knowledge of improving our current models, anticipating environmental variability, and a focused setof data points. This research paperwill builduponthecurrentapplicationsofmachine learning in the depression domain, with a special emphasis on quantitatively critiquing the efficiencies of each model amongst each other and the BDI index based ontheconsistenciesofthedataresponses.
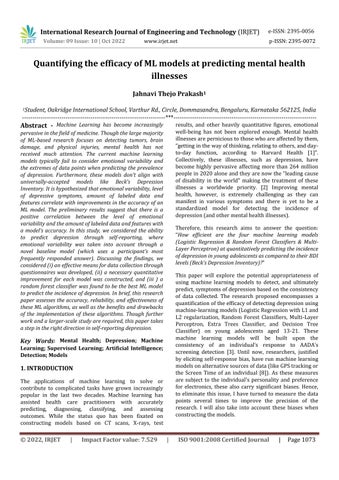
This research paper entails 5key steps as represented by Figure 1.1 to the left. All data were collected through a surveywiththequestionsetfromtheAADA’sscreeningof depression [9] and Beck’s Depression Inventory [10]. The lack of copious data points attrited the scale of the study. Thestudy initiallyreached outto45 individuals, ofwhich 3 did not feel comfortable with the given questions and declined to answer. Out of the 42 responses provided, 11 participants wished to be anonymous and did not share their demographic information. After collecting the necessarydata,apre-analysiswasconductedwhereinthe BDI value was calculated to check the severity of depression for each participant. Every 4 days for the next two weeks, participants would be sent a link to a form with the AADA’s screening and a reminder if the participants did not fill out the form within 2 days. If the participant’sresponsewasnotreceivedwithin4days,the participant’sdata forthe entire duration of thestudy was not taken into consideration. Without an incentive (ex. compensation sent to participants who took part in the
International Research Journal of Engineering and Technology (IRJET)
e-ISSN:2395-0056
Volume: 09 Issue: 10 | Oct 2022 www.irjet.net p-ISSN:2395-0072
study throughout its duration), there was a drastic fall in the number of data points available to construct the ML models.Asmentionedbefore,everyquestionontheAADA screening consists of 4 options: not at all, several days, morethanhalfthedays,andnearlyeverydayToquantize thedatacollectedfromthescreening,anintegervaluewas assigned to each of these options with the smallest being the least severe and highest most severe. “Not at all” was assigned a value of 1; “Several days”, “More than half the days”, and “Nearly every day” were assigned a value of 2, 3, and 4, respectively. Out of the 42 participants, only 27 consistently provided their responses throughout the study.
Inthisstudy,highemotionalvarianceis definedashaving a large standard deviation in the data collected from the AADA questionnaire. In brief, the mean of the standard deviationofaparticipant’s10responsesthroughoutthe3 datasets was considered. If this mean has larger than or equal to 3, the participant was defined as having high emotionalvariance;whereas,ifthemeanissmallerthan3, the participant was defined as having low emotional variance.
accuracy) was created. In other words, a high user lift indicates that the ML model is much better than guessing (i.e.thebaselinemodel);whilealowuserliftindicatesthat theMLmodelisworsethanguessing.
Upon exploring several applications to develop the ML models,itwasdecidedthat theMLmodelswould be built from scratch using Python. Most notably, Orange, “an open-source machine learning visualization software tool for both novices and experts [15]”, was considered to construct the ML models. However, Orange was not considered as the source code for the models was not available to the user, and many research papers have not acknowledged Orange as an official tool for constructing thesemodels.
Due to the lack of copious data points, feature selection was used to automatically select those features which contribute the most to the level of depression in the participantsandusethedatapointsefficientlyThemodels created were (1) Logistic Regression with L1 regularization, (2) Logistic Regression with L2 regularization,(3)RandomForestClassifier,and(4)MultiLayer Perceptron. Using a combined dataset, 4 of the models above were created. And all 4 models are comparedwithbaselinemodelstodetermineifML model prediction is better than baseline. All the steps described herehavealso beendiagrammaticallyillustratedin figure 1.1.
Cognizant of the drastic effect emotional variability plays in predicting depressive symptoms [14], this model made use of a novel method called the “baseline model.” The baselinemodelwasconstructedbytakingtheparticipant’s most frequently responded answer; in other words, this model predicts that the participants remain at their most common emotional state. In orTotize a model’s improvement in predicting the level of depression amongstitsparticipantsascomparedtothebasemodel,a new item called user lift (the absolute value of the difference between the model accuracy and baseline
According to Yale University, Logistic Regression “attemptstomodeltherelationshipbetweentwovariables byfittinga linear equationtoobserveddata. Onevariable is considered an explanatory variable, and the other is considered a dependent variable.” A common method for fitting a linear equation to a dataset is by minimizing the least squares, the sum of the squares of the residuals (i.e. the distance from the actual datapoint and predicted data point). Though simple in practice and easy for interpretation,themodelperformspoorlywhenthereare lurking variables, non-linear relationships, and extrapolation of data. A model which uses L1 regularization is called Lasso Regression, which penalizes the sum of the absolute value of the weights (i.e. coefficientsofthevariables);While,whereasamodelthat uses L2 regularization is called Ridge Regression, which penalizes the sum of the squares of the weights of the variables. The model is penalized through the addition of anindependentconstanttotheregressionline.
International Research Journal of Engineering and Technology (IRJET)
e-ISSN:2395-0056
Volume: 09 Issue: 10 | Oct 2022 www.irjet.net p-ISSN:2395-0072
Random forest classifiers attempt to train multiple decisiontrees.Eachdecisiontreeisbuiltusingarandomly selected subset of data. Decision trees are built in such a way that the leaves represent labels and nodes represent decision points based on a particular feature or subset of features.Thefinalresultisobtainedbytakingtheaverage of the outputs of all decision trees. Among all the ML models, Random Forest Classifier is known to have the highestaccuracyasitefficientlyutilizeslargedatasetsand automatically balances data sets. However, the most notable limitation of the tree is its large runtime and ineffectivenessforreal-lifepredictions.
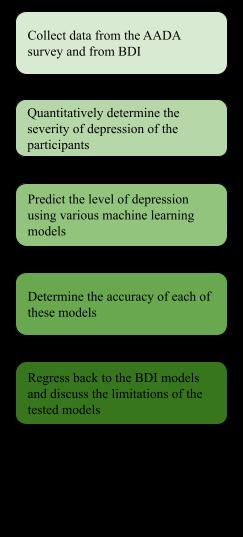
16.59, with a standard deviation of 10.55. Of the 27 participants,33.33%werecategorizedashaving“upsand downs that are considered normal”; 25.93% were categorized as having “mild mood disturbances”; 11.11% were categorized as having “borderline clinical depression”;18.52%werecategorizedashavingmoderate depression; 11.11% were categorized as having “severe depression”. None of the participants studied had a BDI index greater than 40, which would have categorized the participant as having “extreme depression.” Similarly, the average AADA value and standard deviation computed were approximately 2.02 and 0.33, respectively. The summary statistics for the AADA screening have been depictedinFigure2.0.
Multi-layer perceptron models are based on feedforward neural networks. They comprise at least three layers of neurons: the input layer, thehidden layer,and the output layer.Eachoftheneuronshasactivationfunctionsthatcan be trained using supervised learning. The learning is carried out using the backpropagation of errors. The connection weights are tuned over multiple iterations of activation function evaluation and error backpropagation. Multi-Layer Perceptrons are renowned for their ability to solve “complex nonlinear problems”, unlike their counterparts (e.g. logistic regression). Unfortunately, multi-layered perceptronsarealsoinefficientfunctionsas they do not take into account spatial information and are redundant.
Of the individuals who participated in the study, 27 individuals provided sufficient data to analyze and construct the Machine Learning models. The limited number of data points was due to a lack of consistent responses from participants throughout the study. The levelofdepressionforeachparticipantwasdeterminedby their BDI value. The average BDI value reported was
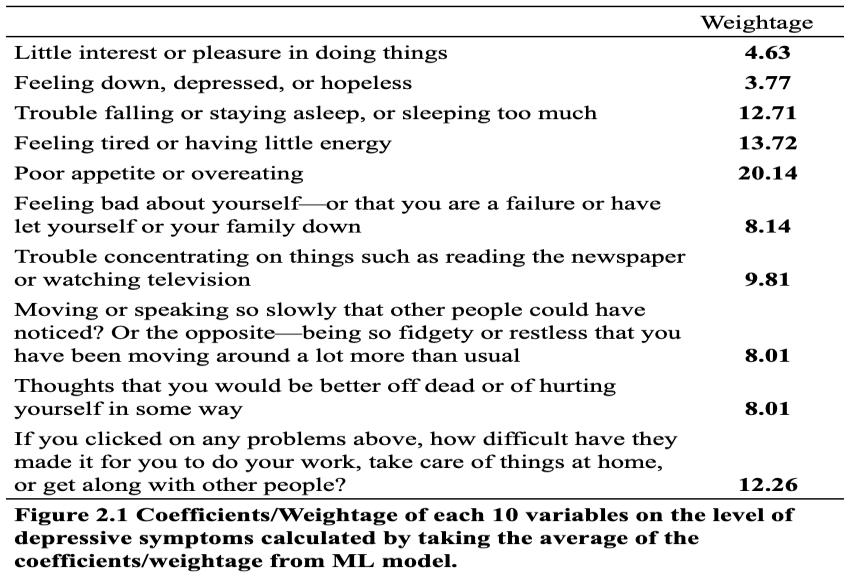
FromeachMLmodel built,thecoefficientsofeachfeature (e.g.“Littleinterestorpleasureindoingthings”)wasused tocalculatetheaverageweightageafactor,overall,hadon thepredictionofdepressionina respondent. Theweights calculated for each feature are presented in Figure 2.1. Of the questions asked, “Poor appetite or overeating” came outasthemostdifferentiatingfeature,havingaweightage of 20.14%. While, “Feeling down, depressed, or hopeless” had the least weightage of 3.77%. This relatively low percentage may be due to self-reporting bias in the respondent’sanswerstothisquestion.Thisimpliesthatto prevent the underreporting of depression amongst the respondents, questionnaires must be designed with “indirect” questions to assess depression. [12]. Other important features are “Feeling tired or having little energy”and“Troublefallingorstayingasleep,orsleeping toomuch”.
International Research Journal of Engineering and Technology (IRJET)
e-ISSN:2395-0056
Volume: 09 Issue: 10 | Oct 2022 www.irjet.net p-ISSN:2395-0072
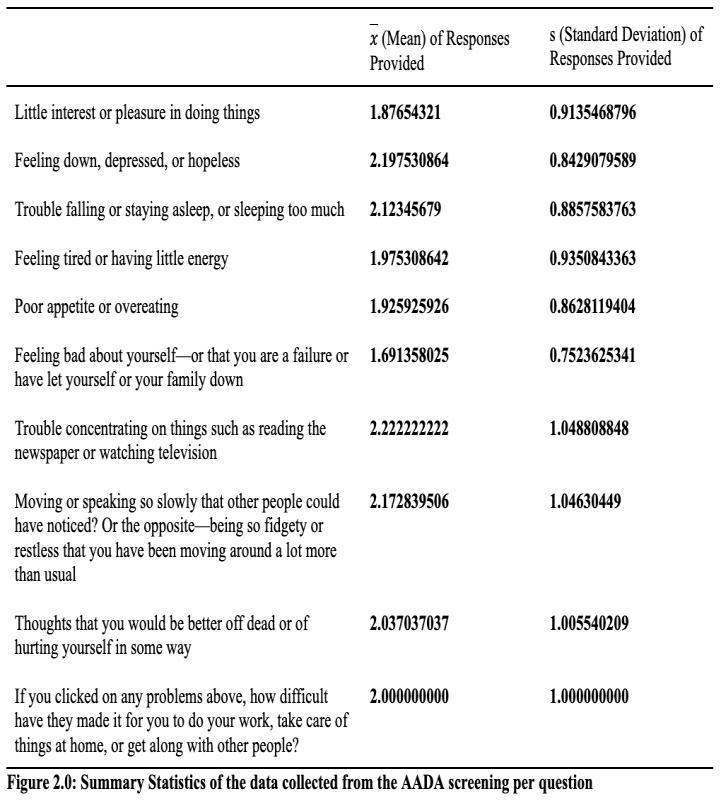
Asmentionedabove,threesamplesofdatawerecollected every 4 days. The correlation between the data points collected as shown in figure 2.2 is weak. This highlights the presence of high variance (i.e. emotional/mental instability)inthedatasetandimpliesthattheMLmodels might struggle to predict the level of depression in the participants.
can learn effectively even on the baseline (or most commonstate).Comparingpredictionpowerwithin 4ML algorithms, Random Forest Classifier performed better than all other models. This strongly indicates the relationship betweenthequestionnaireandDND is nonlinear and modeled better with the Random Forest classifier.
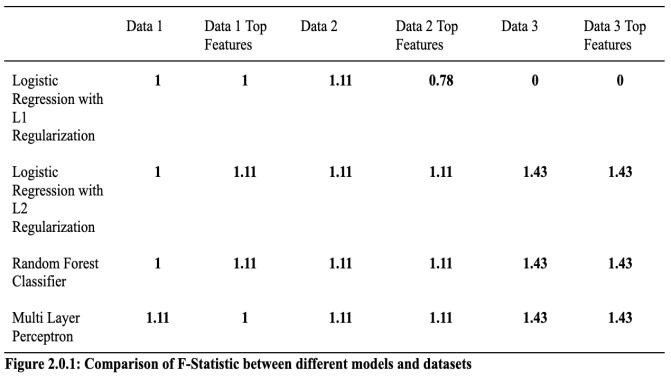
Thethreefiguresbelow(2.0.1,2.0.2,and2.0.3)containthe F-Statistic, Coefficient of Determination, and Accuracy of each of the ML models. As mentioned before, 3 datasets were taken from the participant; hence, the names “data 1”,“data2”,and“data3.”The“Data1/2/3TopFeatures” represents the data that has been pre-analysed based on thefeatureselectionalgorithm.
Asstatedabove,toimprovetheefficacyoftheMLmodel,a baselinemodel(constructedbasedonaparticipant’smost frequent response to the AADA questionnaire). In the presence of high variance (i.e. the average of the range of the responses to the AADA questionnaire across the 3 datasets) in the responses collected, ML models might struggle to predict Depression or No Depression (DND). To decide on the efficacy of the ML model, we need a baselinemodeltocompare.Wedesignedabaselinemodel that will do predictions based on the mode of the data from three samples. The Baseline model represents the userintheirmostcommonstate.
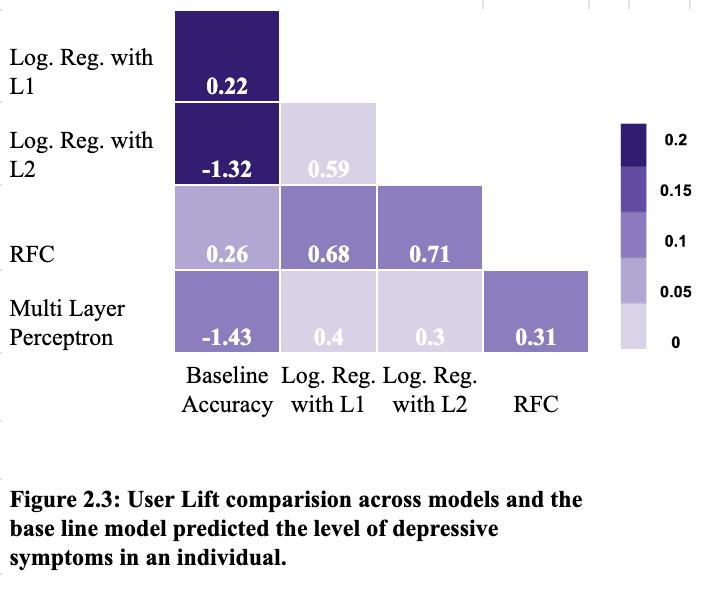
Four ML algorithms to train/test with the data set. These fourmodelsarethencomparedwiththebaselinemodelas shown in figure 2.3. When ML model prediction accuracy vs. base model accuracy is positive indicates how well is MLmodelinpredictinguserstatethanguessing.
As represented in the figure, all models had a positive lift in predicting the level of depressive symptoms in the participants. The highest user life of 0.26 occurs when comparing simpler models built with random forest classifiers and the baseline model. For more complex ML algorithmssuchastheRandomForestclassifier, thegains are smaller which indicates that complex ML algorithms
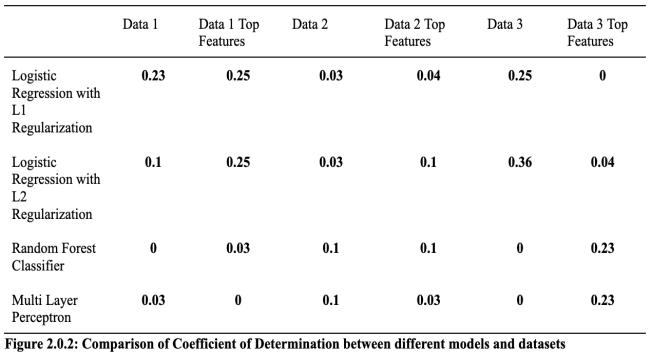
According to Figure 2.0.1, Logistic Regression with L2 Regularization, Random Forest Classifier, and Multi-Layer Perceptron with data 3 and data 3 top features are the “best” models as they have a higher F-Statistic value. On theotherhand,LogisticRegressionwithL1Regularization with data 3 and data 3 top features produces the “worst model”,havinganF-Statistic valueof0.Concerning figure 2.0.2,LogisticRegressionwithL2RegularizationwithData 3 creates the “best” model with the highest coefficient of determination; while, the “worst” model is “Random Forest with Data 1, Random Forest Classifier with Data 3, Multi-Layer Perceptron with Data 1 Top Features, and
International Research Journal of Engineering and Technology (IRJET)
e-ISSN:2395-0056
Volume: 09 Issue: 10 | Oct 2022 www.irjet.net p-ISSN:2395-0072
Multi-Layer Perceptron with Data 3. Similarly, Logistic Regression with L1 Regularization and Data 3, Logistic Regression with L1 Regularization and Data 3 Top Features, and Logistic Regression with L2 Regularization andData3arethemostaccurate,withanaccuracylevelof 0.78or78%.
efficient are the four machine learning models (Logistic Regression & Random Forest Classifiers & Multi-Layer Perceptron) at quantitatively predicting the incidence of depression in young adolescents as compared to their BDI levels (Beck’s Depression Inventory)?”, it was seen that Random Forest Classifier was the most accurate model to predict the incidence of depression as it has the largest userlift,asseeninfigure2.3.Inthefigure,weseethatthe Random Forest classifier consistently outperforms the othermodels,indicatingthattherelationshipbetweenthe questionnaire’s response and the level of depressive symptoms is non-linear and best modeled with RFC. This may also be due to the, comparatively, small number of features used and the limited number of participants in thestudy.
In this research paper, we presented a case study of how effective machine learning models are at predicting the incidenceofdepressionamongstyoungadolescents,anew datapoint.WeappliedLogisticRegressionwithL1andL2 regularization and two classifier algorithms, a random forest classifier and a multi-layer perceptron classifier. Theresultsofthestudysuggestseveralrecommendations for future self-report studies: (i) As seen in the feature importance section of the paper, indirect questions (i.e. questions that focus on secondary effects of depressive symptoms) prevent the underreporting of depression amongst the respondents. For instance, rather than framinga question like “Are youfeeling down, depressed, or hopeless?”, a question focused on sleep deprivation or poorappetitecarriesmoreweightageinsayingwhethera respondent is depressed or not. (ii) The naïve baseline model (i.e. equivalent to guessing the level of depression of an individual) helps to validity whether or not the responses were biased or carry significant data to create ML models. For instance, if a participant answers randomly for every question(an inadequate data point to build a model from), the user lift of the model would be negative, indicative of a bad model and a potential inaccurate self-report. Regarding the results and the high model accuracy, we can deduce that it is possible to predict the incidence of depression using self-reporting methods. Retracting back to the research question, “How
When model improvement and self-reporting were related,anegativerelationshipbetweentheconsistencyof a participant’s responses and the ability to predict was deduced. This indicates that people with less consistent responseshaveahigherabilitytopredicttheincidenceof depression. There are limitations in this paper, most notably using a smaller sample size. A larger sample size wouldallowustoseewhetherornottherelationshipsand accuracies of these models remain consistent. A larger cohort would also enable us to take into account more variabilities and thus, improve the models used in the study.
This study acts as a case study for understanding the disparity between our machine learning models and world-reputed models, like BDI. Though successful, it is highlyemphasizedthatlargerorganizationsconductthese experimentsonalargerscaleacrossallages,races,creeds, gender,occupation,etc.Thiswouldaccountforalargerset of variability and a more in-depth understanding of the accuracyofthesemodels.Inthefuture,itisrecommended to diversify the participants to generalize this study to a largerpopulation.Thiscouldincludethediversificationof other sources (e.g. GPS tracker, sleep deprivation, accelerometer activity, etc.) With more descriptive data, the relationships between each facet (described above) andtheincidenceofdepressioncanbededuced.
Based on the findings of the research paper, Random Forest Classifier was concluded as the most effective ML model to predict the incidence of depression amongst young adolescents. This paper stands as a case study for larger-scale research projects to refer to whether or not self-reporting can be used to predict the incidence of depression. Upon completing this research paper, a potential solutionis to conductthe same experiment on a
International Research Journal of Engineering and Technology (IRJET)
e-ISSN:2395-0056
Volume: 09 Issue: 10 | Oct 2022 www.irjet.net p-ISSN:2395-0072
larger scale and increase diversity amongst the participants.
Thank you for the guidance of my mentor, Adinawa Adjagbodjou, PhD candidate from Carnegie Mellon Universityinthedevelopmentofthisresearchpaper.
[1]HarvardHealth.(n.d.). RetrievedAugust5, 2022,from https://www.health.harvard.edu/topics/mentalhealth#:~:text=A%20mental%20illness%20is%20a,day% 2Dto%2Dday%20function
[2] SingleCare Team | Updated on Feb. 15, Team, S. C., & Team,S.C.(2022,February15). Statisticsaboutdepression in the U.S. The Checkup. Retrieved August 5, 2022, from https://www.singlecare.com/blog/news/depressionstatistics/
[3] Screening for depression. Screening for Depression | Anxiety and Depression Association of America, ADAA. (n.d.). Retrieved August 5, 2022, from https://adaa.org/living-with-anxiety/ask-andlearn/screenings/screening-depression
[4] Beck's depression inventory - ismanet.org. (n.d.). Retrieved August 5, 2022, from https://www.ismanet.org/doctoryourspirit/pdfs/BeckDepression-Inventory-BDI.pdf
[5] Analyzing the mental health of engineering students using ... (n.d.). Retrieved August 5, 2022, from https://www.educationaldatamining.org/EDM2013/pape rs/rn_paper_34.pdf
[6] Srividya, M., Mohanavalli, S., & Bhalaji, N. (2018, April 3). Behavioural modelling for Mental Health Using Machine Learning Algorithms - Journal of Medical Systems. SpringerLink. Retrieved August 5, 2022, from https://link.springer.com/article/10.1007/s10916-0180934-5
[7] School, H. Y. I., Yang, H., School, I., School, P. A. B. I., Bath,P.A.,&Metrics,O.M.V.A.(2019,May1). Automatic prediction of depression in older age: Proceedings of the third international conference on medical and health informatics 2019. ACM Other conferences. Retrieved August 5, 2022, from https://dl.acm.org/doi/10.1145/3340037.3340042
[8] Algorithm Demasi - GitHub Pages. (n.d.). Retrieved August 5, 2022, from https://ubicomp-mentalhealth.github.io/papers/2017/algorithm-demasi.pdf
[9] “Screening for Depression.” Screening for Depression | Anxiety and Depression Association of America, ADAA, https://adaa.org/living-with-anxiety/ask-andlearn/screenings/screening-depression
[10] Beck's Depression Inventory - Ismanet.org https://www.ismanet.org/doctoryourspirit/pdfs/BeckDepression-Inventory-BDI.pdf
[11] “Beck Depression Inventory (BDI).” American Psychological Association, American Psychological Association, https://www.apa.org/pi/about/publications/caregivers/ practice-settings/assessment/tools/beck-depression
[12] AC;, Hunt M;Auriemma J;Cashaw. “Self-Report Bias and Underreporting of Depression on the BDI-II.” Journal of Personality Assessment, U.S. National Library of Medicine,https://pubmed.ncbi.nlm.nih.gov/12584064/
[13] “Products - Data Briefs - Number 379 - September 2020.” Centres Disease Control and Prevention, Centers for Disease Control and Prevention, 23 Sept. 2020, https://www.cdc.gov/nchs/products/databriefs/db379.h tm
[14] Neumann, Anna, et al. “Emotional Dynamics in the DevelopmentofEarlyAdolescentPsychopathology:AOneYear Longitudinal Study.” Journal of Abnormal Child Psychology, Springer US, July 2011, https://www.ncbi.nlm.nih.gov/pmc/articles/PMC310135 9/
[15] “Orange - Machine Learning Training for Health Sciences.” Orange - Machine Learning Training for Health Sciences | The Center for Biomedical Informatics and Biostatistics, https://cb2.uahs.arizona.edu/orangemachine-learning-training-health-sciences.
[16] Linear Regression, http://www.stat.yale.edu/Courses/199798/101/linreg.htm
[17] “CS 188: Introduction to Artificial Intelligence.” CS 188: Introduction to Artificial Intelligence, Spring 2021, https://inst.eecs.berkeley.edu/~cs188/sp21/.
International Research Journal of Engineering and Technology (IRJET) e-ISSN:2395-0056
Volume: 09 Issue: 10 | Oct 2022 www.irjet.net p-ISSN:2395-0072
Jahnavi Thejo Prakash is a senior at Oakridge International School Bangalore interested in computer science, computer engineering, robotics, and bringing about a positive change in society. I am deeply interested in Artificial Intelligence and Human-Computer Interaction By promoting digital literacy,empoweringwomeninrural villages, and helping my peers through an educational platform, I ameagertomakeadifference.