International Research Journal of Engineering and Technology (IRJET) e-ISSN:2395-0056

Volume: 09 Issue: 10 | Oct 2022 www.irjet.net p-ISSN:2395-0072
International Research Journal of Engineering and Technology (IRJET) e-ISSN:2395-0056
Volume: 09 Issue: 10 | Oct 2022 www.irjet.net p-ISSN:2395-0072
1M Tech Student, Department of Electronics and Communication Engineering UCEK (A),JNTU Kakinada, Andhra Pradesh,India,533003.
2Assistant Professor,Department of Electronics and Communication Engineering UCEK(A),JNTU Kakinada, Andhra Pradesh,India,533003.***
Abstract - Heartbeats are crucial to the medical sciences' study of heart ailments because they reveal significant details about heart problems and irregular heart rhythms. Electrocardiogram (ECG) represents the electrical activity of the heart showing the regular contraction and relaxation of heart muscle. The heart condition is used to diagnose by an important tool called Electrocardiography. The ECG spectrogram is used for diagnosing the heart diseases. The different types of noises present in ECG signal are Base-Line Wander, Power-Line Interface, Muscle Artefacts, Electrode contact noise. One of these is arrhythmia, in which the heart's regular rhythm is altered by damage to its muscles and an electrolyte imbalance. A hybrid technique is utilised to identify and categorise arrhythmia by combining Multivariate Empirical Mode Decomposition (MEMD) and Artificial Neural Network (ANN). Multilayer feed forward neural networks are utilised for classification, and these networks are trained utilising back propagation algorithms. Two key properties, the RR interval and Heart Rate, are retrieved from the ECG signal for the identification of Arrhythmia when MEMD is employed to denoise multichannel signals. Tachycardia and bradycardia are two subtypes of arrhythmia based on these characteristics. The Extraction of features and classification is to be done using Convolution neural network (CNN) classifier and the results obtained using CNN.
Key Words: Baseline Wander, Powerline Interface, Muscle Artifacts, Arrhythmia, Tachycardia, Electrocardiogram, Multivariate Empirical Mode Decomposition (MEMD), Artificial Neural Network (ANN),ConvolutionNeuralNetwork(CNN).
An electrocardiogram (ECG or EKG), a recording of the electrical activity of the heart, is made using the electrocardiographytechnique.Whenthecardiacmuscle depolarizes and repolarizes throughout each cardiac cycle, these electrodes detect the minute electrical changes that result from these processes (heartbeat).
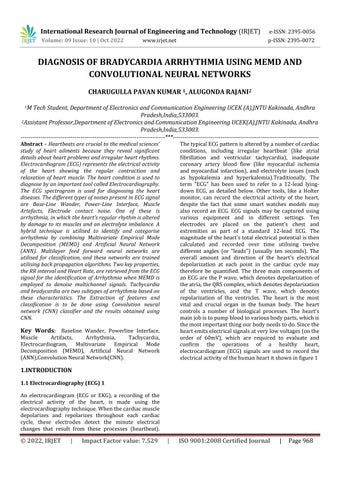
ThetypicalECGpatternisalteredbyanumberofcardiac conditions, including irregular heartbeat (like atrial fibrillation and ventricular tachycardia), inadequate coronary artery blood flow (like myocardial ischemia and myocardial infarction), and electrolyte issues (such as hypokalemia and hyperkalemia).Traditionally, The term "ECG" has been used to refer to a 12-lead lyingdown ECG, as detailed below. Other tools, like a Holter monitor, can record the electrical activity of the heart, despite the fact that some smart watches models may also record an ECG. ECG signals may be captured using various equipment and in different settings. Ten electrodes are placed on the patient's chest and extremities as part of a standard 12-lead ECG. The magnitudeoftheheart'stotalelectricalpotentialisthen calculated and recorded over time utilising twelve different angles (or "leads") (usually ten seconds). The overall amount and direction of the heart's electrical depolarization at each point in the cardiac cycle may therefore be quantified. The three main components of an ECG are the P wave, which denotes depolarization of theatria,theQRScomplex,whichdenotesdepolarization of the ventricles, and the T wave, which denotes repolarization of the ventricles. The heart is the most vital and crucial organ in the human body. The heart controls a number of biological processes. The heart's mainjobistopumpbloodtovariousbodyparts,whichis themostimportantthingourbodyneedstodo.Sincethe heartemitselectricalsignalsatverylowvoltages(onthe order of 60mV), which are required to evaluate and confirm the operations of a healthy heart, electrocardiogram (ECG) signals are used to record the electricalactivityofthehumanheartitshowninfigure1
International Research Journal of Engineering and Technology (IRJET) e-ISSN:2395-0056
Volume: 09 Issue: 10 | Oct 2022 www.irjet.net p-ISSN:2395-0072
Theconvertingofasignalintoitsspectrogramwillresult greatly in the vibration analysis. The way the spectrograms work is, they makes easier for the implementationofanyprocesses.
Figure - 1: AnECGsignalshowingthemostimportant peaks
Thetable1itrepresentstheNormalECGsignalwave amplitudeanddurations.
Table - 1 NormalECGsignalwaveamplitudeand durations
Features Amplitude(mV) Duration(sec)
P wave 0.25 0.06-0.08
Q wave 25%ofRwave 0.09-0.1
R wave 1.60 0.08-0.12
T wave 0.1-0.5 0.12-0.16
U wave 0.05 0.1
A spectrogram is a graphic representation of a signal's frequency spectrum as it evolves over time. Spectrograms are sometimes referred to as sonographs, voiceprints, or voicegrams when they are applied to an audioinput. Waterfalldisplaysarewhatyoumightrefer to when the data is displayed in a 3D plot. Sonar, radar, voice processing, seismology, linguistics, music, and otherdisciplinesfrequentlyusespectrograms.
AnECGsignalcanalsobetransferredintoaspectrogram. TheECGspectrogramcanbethenappliedwithallofthe required processes. An ECG spectrogram can be convertedintoanyother domainfora betteroperations over the process. The ECG spectrogram contains information of the signal that the original signal does. The information in a spectrogram can never deviates fromtheoriginalECGsignalcapturedfromthepatient.
Aheartratethatishigherthanthetypicalrestingrateis referred to as tachycardia. Adults are generally consideredtohavetachycardiaiftheirrestingheartrate exceeds 100 beats per minute. Heart rates that are higherthantherestingratemightbehealthy(likeduring activity) or unhealthy (such as with electrical problems within the heart). Age determines the highest limit of a typical human resting heart rate. Different age groups have reasonably well-standardized cutoff levels for tachycardia; normally, deadlines are 1-2 days: tachycardia >166 bpm after 3–6 days of tachycardia >159bpm.
AslowrateofheartisknownasBradycardia.Foradults isfrom60to100timesperminutewhiletheyareatrest. Your heart beats less frequently than 60 times each minute if you have bradycardia. If the heart doesn't pump enough oxygen-rich blood to the body and the pulse rate is exceedingly sluggish, bradycardia can be a major issue. You might experience this and feel weak, exhausted, and out of breath. Bradycardia can occasionally occur without any symptoms or problems. It's not necessarily dangerous to have a slow heartbeat. For instance, a resting heart rate of 40 to 60 beats per minute is typical for some people, especially healthy young adults and trained athletes. If bradycardia is severe, a pacemaker implant may be required to assist theheartitshowntable–2
Table - 2 Parameters
parameters
Heartrate(inbpm)
Normalheartrate 60-90bpm
Abnormalheartrate Lessthan60bpmor greaterthan90bpm
Tachycardia Greaterthan90bpm Bradycardia Lessthan60bpm
For the adaptive processing of multichannel data, the multivariateempiricalmodedecomposition(MEMD)has lately made significant advances. Despite MEMD's
International Research Journal of Engineering and Technology (IRJET) e-ISSN:2395-0056
Volume: 09 Issue: 10 | Oct 2022 www.irjet.net p-ISSN:2395-0072
excellent efficiency in time-frequency analysis of nonlinear and non-stationary signals, its wider applicability has been constrained by high computing loadandover-decomposition.
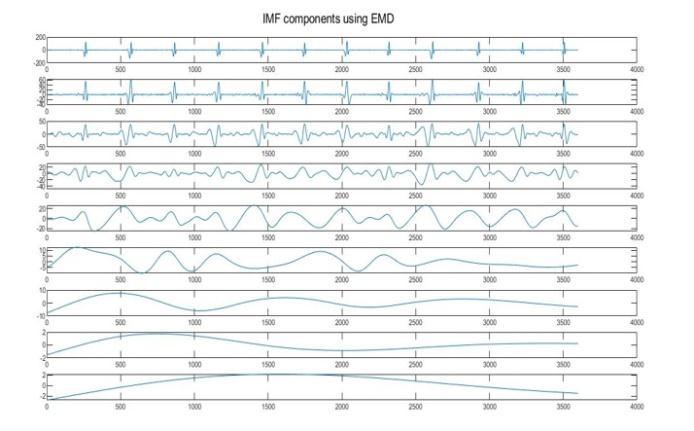
Forbreakingdownnon-linearandnon-stationarysignals intoasequenceofIntrinsicModeFunctions,Huangetal. devised the multivariate empirical mode decomposition (MEMD) in 1998. (IMFs). IMF records the signal's repetitiveactivityataspecifictimeframe.Theempirical mode decomposition breaks down a time signal into a collection of basis signals similarly to the Fourier or wavelet transforms, however unlike those transformations, the basis functions are obtained directly from the data. As a result, the results maintain the signal under consideration's complete nonstationarity.Theinstantaneousfrequencyandamplitude of the signal can be calculated when the Hilbert transformisusedontheIMFs.Thismethodisknownas theHilbert-Huangtransform(HHT).
Multiscale non-linear, non-stationary signals are broken down into a number of adaptive, entirely data-driven AMFM zero mean signals, known as Intrinsic Mode Functions (IMF). This process is known as mutlivariate empirical mode decomposition (MEMD). The fundamental premise of EMD is that any signal is made up of several IMFs, each of which represents an embeddeddistinctiveoscillationonadistincttimescale.
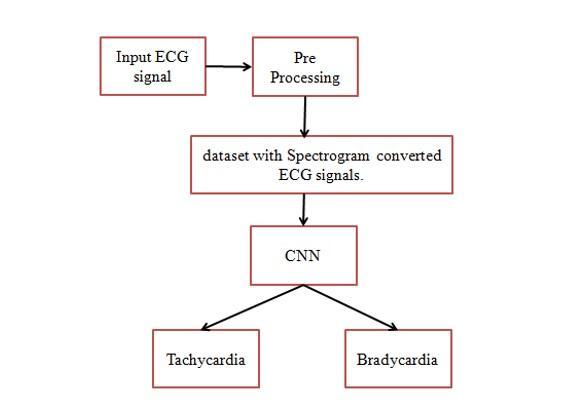
Indeeplearning,aConvolutionalNeuralNetwork(CNN) is a class of artificial neural network, most commonly applied to analyze 1D signals like all of the Bio-medical signals such as, ECG, EMG, EEG and voice and speech signals and 2D as well as 3D signals such as, visual imagery. Convolutional neural networks are distinguished from other neural networks by their superior performance with bio-medical signals, image, speech, or audio signal inputs. The three basic types of layers in a CNN are convolutional, pooling, and fully connected (FC). The convolutional layer, along with convolutionallayersorpoolinglayers,isthefirstlayerof aconvolutionalnetwork,whilethefully-connectedlayer is the last layer and it shown in figure 2. The CNN becomes more complicated with each layer, detecting more chunks of the signals as well as the picture. The CNN begins to detect greater features or forms of the item as it advances through the layers, eventually identifyingthedesiredobject.
Theconvolutionallayer,whichmakesupthemajorityof the computation in a CNN, is its core component. Input data, a filter, and a feature map are among the things it
requires.Assumethatasignalwitha1Dmatrixofvalues willbeusedastheinput.Inordertodetectif thefeature is present, we also have a kernel or filter that traverses the signal's receptive fields. This procedure is known as convolution. The quantity of filters affects the output's depth.
As an illustration, three separate filters might produce three differentfeature maps,providinga depth ofthree. Thekernel'straversaloftheinputmatrixismeasuredby its stride. A longer stride yields a lower output notwithstanding the rarity of stride values of two or higher. Usually, zero-padding is used when the filters don't fit the input signal. By setting any elements that aren'tapartoftheinputmatrixtozero,thisproducesan outputthatisbiggerormoreevenlyproportioned.Three typesofpaddingareavailable:Thesetermsincludevalid padding and no padding. The last convolution is discarded in this case if the dimensions do not match. The input layer and the outputlayer are made to be the same size using the same padding. Full padding increases the output size by adding zeros to the boundary input. Each convolution operation in a CNN is followed by a Rectified Linear Unit (ReLU) modification on the feature map, which gives the model more nonlinearity
Downsampling,sometimesreferredtoaspoolinglayers, reduces the dimensionality of the input by lowering the number of parameters. The pooling operation sweeps a filteracrossthewholeinput,muchliketheconvolutional layer, with the exception that this filter has no weights. As a substitute, the kernel fills the output array by applying an aggregation function to the values in the receptive field. Pooling may be broken down into two categories: When the filter passes over the input, max poolingchoosestheinputpixelwiththegreatestvalueto transmittotheoutput array.Asasidenote,thismethod is applied more frequently than traditional pooling. Average pooling is used to get the average value within the receptive field. This value is provided to the output arraywhenthefiltertraversestheinput.Manypiecesof information are lost due to the pooling layer, but the CNN gains a number of advantages as a result. They improve effectiveness, decrease complexity, and lower theriskofover-fitting.
The full-connected layer is what its name suggests it to be. As was previously stated, partly linked layers do not directlylink theinputimage'spixel values to the output layer. In contrast, every node in the output layer of the fully-connected layer is directly linked to every node in thelayeraboveit.Thecharacteristicsthatwerecollected
International Research Journal of Engineering and Technology (IRJET) e-ISSN:2395-0056
Volume: 09 Issue: 10 | Oct 2022 www.irjet.net p-ISSN:2395-0072
fromthelevelsaboveandtheircorrespondingfiltersare used in this layer to carry out the classification process. FC layers frequently produce a probability between 0 and 1 using a softmax activation function to classify inputsproperly.ReLufunctionsarecommonlyemployed inconvolutionalandpoolinglayers.
samples which contains majority of the samples of the dataset.
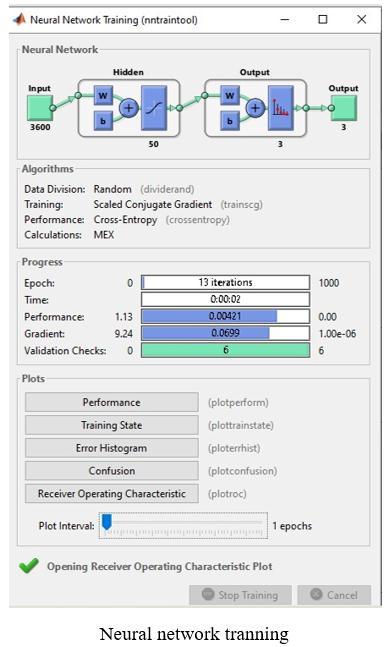
TheCNNwillbetrainedusingthetrainingsamplesover many iterations for a better performance. The training samples contains all kinds of health conditions. The different kinds of health conditions are fed to the CNN withlabels.ThedataprovidedtotheCNNtrainingphase willbelabelledsuchthat,itwilllearnthepatternsofthe differentkindsofthehealthconditions.
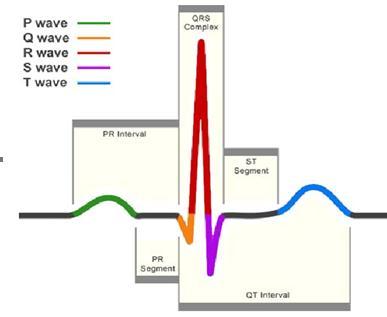
The raw ECG signal is taken from the dataset that contains multiple samples of ECGs of different people having different types of health conditions that maybe, arrhythmia that maybe, tachycardia or bradycardia and maybeperfectrhythmsofheartbeats.ThetakenrawECG signal maybe affected from noise that maybe any of the commonly occurring noises, such as, baseline wander, powerlineinterfaceandmuscleartifacts.
The ECG sample must be noise free or it should be minimizedtoadesiredlevelforabetterresults,forthat, we have applied multivariate empirical mode decomposition (MEMD). Multi-Variate Empirical Mode Decomposition (MEMD) will represents the signal in Intrinsic Mode Functions (IMFs). We can remove the noise from the signal by decomposing the signal in its IMFs.
The noise free ECG signal will then be converted into spectrograms of containing same data with easy representation. The spectrogram is a de-noised sample means,thesamplewillbereadyforextractingthePorQ or R or S or T waves. The denoising of the signal makes the peaks to be visible directly for detecting. The spectrogram will then be transferred to the next stage where, the classification of the different kinds of arrhythmias are done using the convolutional neural networksarchitecture.
The noise removed ECG spectrogram will then, be, transferred to, the Convolutional Neural Networks (CNN) for classification of different kinds of health conditions. The dataset will be divided into training and testingforprocess.TheCNNwillbefedwiththetraining
Figure - 3: proposedmethodblockdiagram.
The trained CNN network will then, be, tested using the test data that was separated during the previous phase of the process. The CNN is classifying the data at better rate than any other existing methods such as, ANN. Comparison of various parameters of CNN with the existing ANN. It is evident that, our proposed CNN has performed better than existing ANN in various parameters.
The physionet database contains datasets of different types of heart conditions. That maybe, arrhythmias of any kind like, tachycardia or bradycardia etc. The arrhythmia condition dataset has been taken from the physionet database. The different conditions are normal orarrhythmiaandarrhythmiaarealsooftwokindslike, tachycardia as well as, bradycardia etc. Physionet often provides the samples of patients of different conditions that might be, healthy or unhealthy. Not only heart related condition signals but all types of signals that include Electro-Myography (EMG), ElectroEncephalography (EEG) and many more such as, X-Ray samples,CTscansamplesandevenMRIscansamplesto everyoneforfree.
International Research Journal of Engineering and Technology (IRJET) e-ISSN:2395-0056
Volume: 09 Issue: 10 | Oct 2022 www.irjet.net p-ISSN:2395-0072
Let's now describe this block with a recurring name. A ResNetismadeupofmultipleblocks,oneforeachlayer. ThisisduetothefactthatResNetstypicallyincreasethe numberofoperationswithina blocktogodeeper,while the total number of layers four remains constant. With the exception of the final operation in a block, it shown in figure 4 which lackstheReLU,an operation in thiscontextreferstoaconvolution,batchnormalisation, andReLUactivationtoaninput.
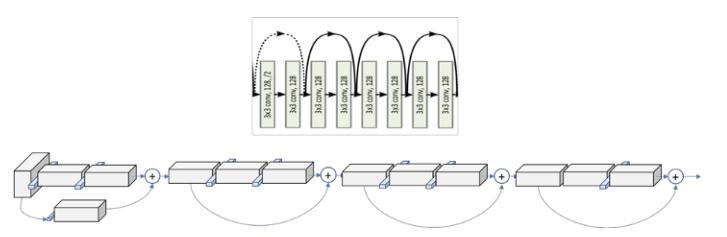
As a result, the PyTorch implementation makes a distinction between blocks with 2 operations, known as Basic Blocks, and blocks with 3 operations, known as Bottleneck Blocks. Although we are already using the termlayerforagroupofblocks,eachof theseprocesses istypicallyreferredtoasalayer.
We can confirm that the kernel size is [3x3, 64] and the output size is [56x56] by looking at the table from the paper again. We can observe that, as we previously indicated, the volume's size remains constant within a block.Thisisduetotheuseofapaddingof1andastride of 1. Let's see how this applies to the 2 [3x3, 64] that is showninthetableasawholeblock.
The raw ECG signal which are corrupted by different kindsofnoisesaretakenfromthedatasetofECGsignals from the Physionet Database and represented in the below waveform. The raw ECG signal will always be corrupted becauseofthemanyreasons,so,ithasbedenoised for that reasons. To make sure it doesn’t affect ourprocess.
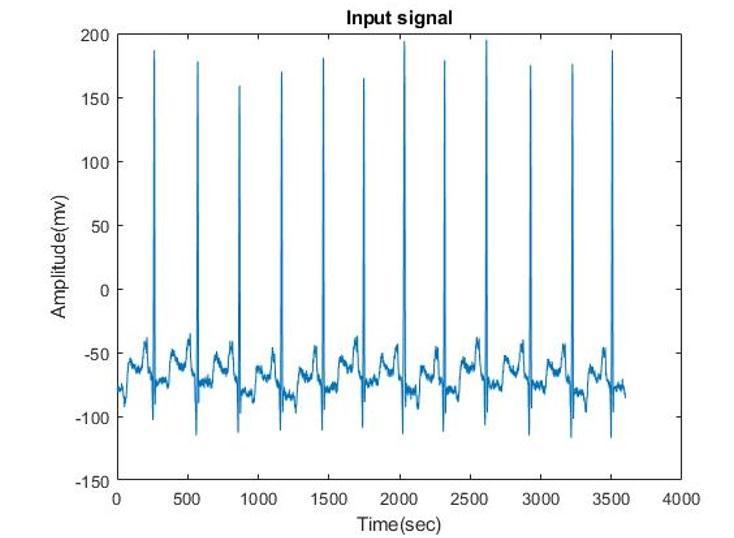
The application of EMD to a raw ECG signal will decomposethesignalintoitsIMFs.TheIMFsareusedto doanyoperationtotheECGsignal.
The application of MEMD to a raw ECG signal will decompose the signal into its IMFs. Unlike EMD, an MEMD will be applied to many parameters of the raw ECGsignal.TheIMFsareusedtoremove noisefromthe rawECGsignal
International Research Journal of Engineering and Technology (IRJET) e-ISSN:2395-0056
Volume: 09 Issue: 10 | Oct 2022 www.irjet.net p-ISSN:2395-0072
The R peaksare detected after the application of MEMD to the raw ECG signal which was decomposed into its IMFs.
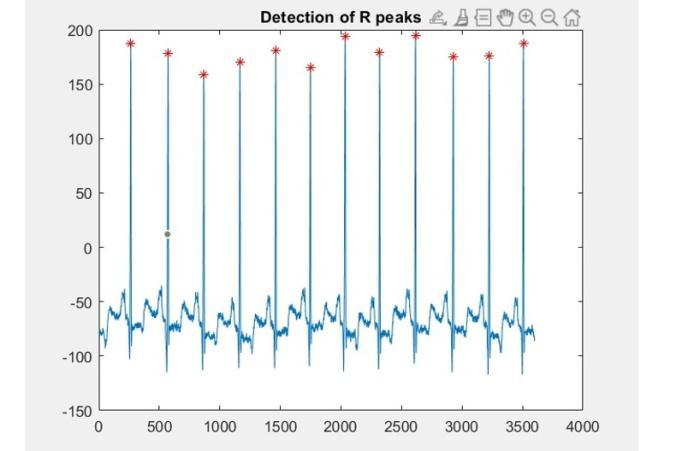
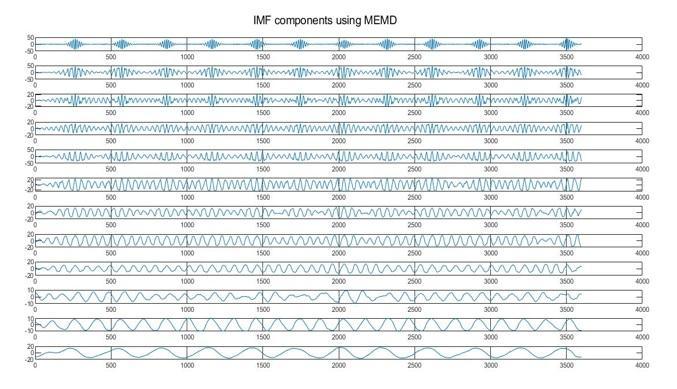
Figure- 8: DetectedRpeaks
The filtered ECG signal was plotted in the below waveform.AftertheapplicationofMEMDtotherawECG signalthenoisewillbefilteredoutandthesignalwillbe filteredinmanyparameters.
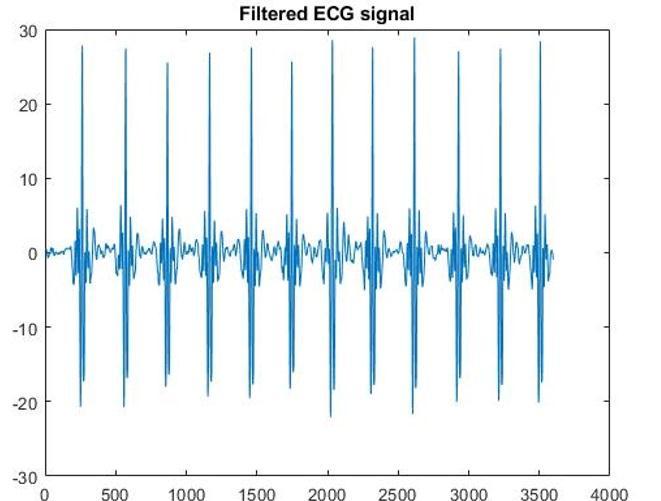
Figure-
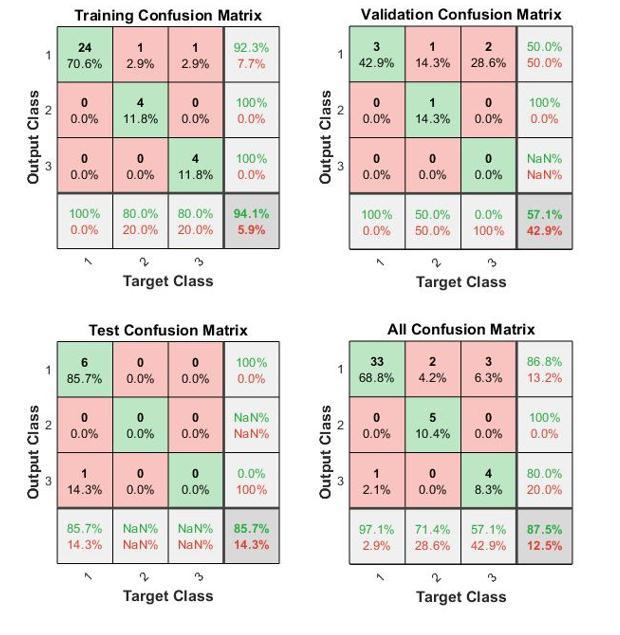
Confusion Matrix:ConfusionMatrixisusedtocalculate the Performance of the Classifier, In the Confusion Matrix it is represented in the matrix form. It Compares the True Label i.e.;Correctly Predicted to the Actually Predicted Values it shown if figure 10. Confusion Matrix
International Research Journal of Engineering and Technology (IRJET) e-ISSN:2395-0056
Volume: 09 Issue: 10 | Oct 2022 www.irjet.net p-ISSN:2395-0072
is of a NXN Matrix here N represents the number of ClassesconsideredforClassification.
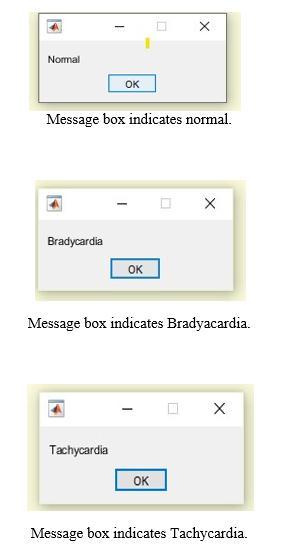
Figure- 11: DetectedtheDiseases.
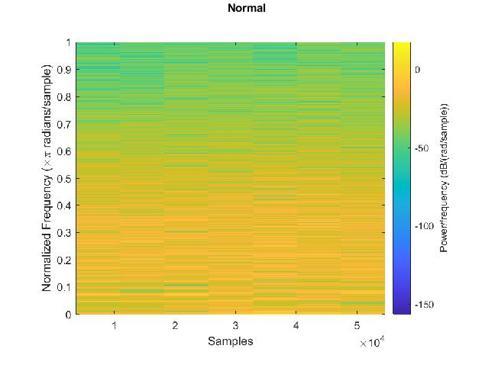
The normal rhythm spectrogram representing the normality of the particular person who has been classifiedasnormalitshowninfigure12.
Figure- 12: Normalrhythmspectrogram
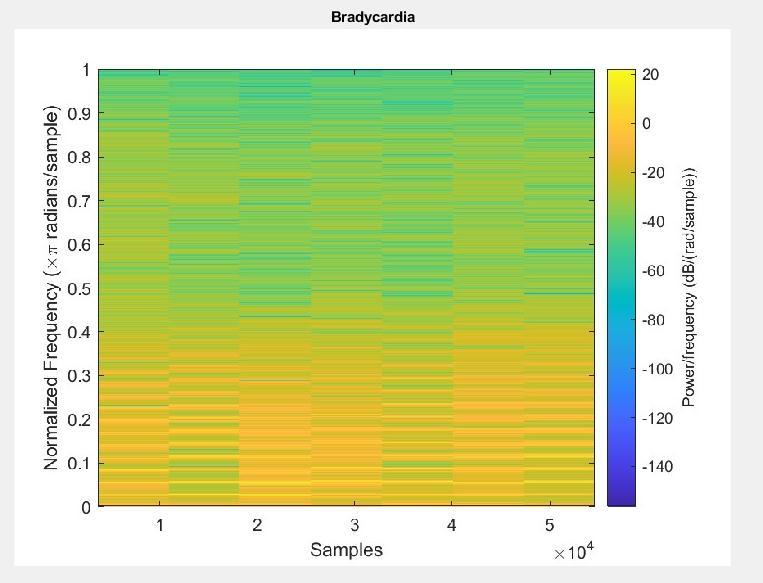
rangeoftheparticularpersonwhohasbeenclassifiedas bradycardiaitshowninfigure13.
Figure- 13: Bradycardiarhythmspectrogram
The bradycardia rhythm spectrogram representing the 7. Parametric Evaluation:
a. Accuracy : It is the number of correctly classified cases divided by total number of instances
Accuracy= b. Sensitivity :It is the probability of True PositivesintheClass.
Sensitivity= c. Specificity:It is the probability of True NegativesintheClass.
Specificity= d. Precision:It is defined as how accurately correctly predicted to the total positive predictions.
Precision=
International Research Journal of Engineering and Technology (IRJET) e-ISSN:2395-0056
Volume: 09 Issue: 10 | Oct 2022 www.irjet.net p-ISSN:2395-0072
Table -3 ComparisonofCNNwithexistingANN
ConferenceonRecentTrendsinElectronics,Information &Communication Technology(RTEICT),pp.2021-2025, Bangalore,India,19-20May,2017.
[5] Reddy, K.G., Vijaya, D.P. and Suhasini, S., ‘‘ECG Signal Characterization and Correlation to Heart Abnormalities,” International Research Journal of Engineering and Technology (IRJET), vol.4, no.5, May 2017.
It is evident that, our proposed CNN has performed betterthanexistingANNinvariousparameters
Finally, we can conclude that, the application of MEMD removed the noise from many parameters which made the PQRST waves to be easily detected by the Convolutional Neural Network (CNN). The CNN needs truepeaksasclearaspossible,forabettertrainingover the different kinds of health conditions associated with the Human Heart. The CNN has a better accuracy and sensitivity than the existing methods such as, Artificial NeuralNetworks(ANN).
TheConvolutionalNeuralNetwork(CNN)workedbetter thananyotherexistingmethodsortechniques.TheCNN achieved a greater accuracy than the artificial neural networks. The conversion of an ECG signal into spectrograms made our signal easy for processing. The Multi-VariateEmpiricalModeDecomposition(MEMD)is very great at reducing the noise in the spectrograms of ECG signals. MEMD worked better than any other existingmethodsortechniques.
[1] Srinivasan, Neil T, and Richard J Schilling. ‘‘Sudden Cardiac Death and Arrhythmias.” Arrhythmia & electrophysiologyreview,vol.7,no.2,2018.
[2] Sanamdikar, S.T., Hamde, S.T. and Asutkar, V.G., (2015, Jun). ‘‘A literature review on arrhythmia analysis of ECG signal,” International Research Journal of Engineering and Technology (IRJET), vol.2, no.3, June 2015.
[3] “A Human ECG Identification System Based on Ensemble Empirical Mode Decomposition”, National Natural Science Foundation of China, Journal List Sensors(Basel)v.13(5);2013May,PMC3690084.
[4] A. Agrawal and D. H. Gawali, ‘‘Comparative study of ECGfeatureextractionmethods,”2ndIEEEInternational
[6]T.T.Khan,N.Sultana,R.B.RezaandR.Mostafa,‘‘ECG feature extraction in temporal domain and detection of various heart conditions,” International Conference on Electrical Engineering and Information Communication Technology(ICEEICT),pp.1-6,Savar,Bangladesh,21-23 May,2015.