International Research Journal of Engineering and Technology (IRJET) e-ISSN:2395-0056

Volume: 09 Issue: 10 | Oct 2022 www.irjet.net p-ISSN:2395-0072
International Research Journal of Engineering and Technology (IRJET) e-ISSN:2395-0056
Volume: 09 Issue: 10 | Oct 2022 www.irjet.net p-ISSN:2395-0072
V.Anbarasan1, and K. Arivalagan2
1Department of Chemistry, DMI college of Engineering,Chennai-600123..
2Department of Chemistry, Govt Arts College for Men(A) Nandanam,Chennai.600035. ***
Nanoparticles are the spearheads of the rapidly expanding field of nanotechnology. Development of the green synthesis has gained extensive attention as a reliable, sustainable and eco-friendly protocol for synthesizing a wide range of metal and metal oxide nanoparticles. The present study is to undertake Equilibrium, Kinetics and Thermodynamic studies for Removal of Methyl Red dye by Green Synthesized Copper Oxide Nanoparticles (Adenanthera Pavonina leaves). The synthesized copper oxide nanoparticles were characterized by Ultraviolet Vis spectroscopy (UV-Vis), X-ray Diffraction (XRD), Fourier Transform Infrared Spectroscopy (FT-IR), Scanning Electron Microscope (SEM), Transmission Electron Microscope (TEM), Energy Dispersive X-ray (EDX), and Dynamic Light Scattering (DLS). Adsorption parameters such as Initial dye concentration, Adsorbent dosage, pH, contact time, and Temperature were studied. Adsorption isotherm has been used to test the adsorption data (Langmuir, Freundlich, Temkin), Kinetics and thermodynamic parameters were also calculated. In addition, results indicate that the adsorption equilibrium data well fitted with Langmuir isotherm compared to Freundlich and Temkin isotherm. The adsorption kinetics shows good agreement of pseudo second order kinetic model. Moreover, the negative value of ∆Go reveals the spontaneous nature of the adsorption process and the negative value of ∆Ho indicates the adsorption process exothermic and the positive values of ∆So suggest increasing randomness of the adsorbent solution interface during the adsorption process of APL CuONPs. The green chemistry approach used in the present work for the synthesize of copper oxide nanoparticles is simple, cost effective, and good alternative method. The green synthesized copper oxide nanoparticles with high dye adsorption capacity might be a suitable option for dye removal from coloured aqueous solution. CuO nanoparticle prepared from above mentioned routes is expected to have more extensive applications such as Chemical sensor, Catalytic, Gas sensor, Semiconductor etc. This process is an economical method with respective to energy, time and its simplicity. Through this method a large scale of Green synthesized Copper Oxide Nanoparticles was produced
Keywords: Adenanthera Pavonina leaves, Extract, Copper oxide nanoparticles, Characterization, Dye, Adsorption, Kinetics, Thermodynamics
Correspondences: V.Anbarasan,Tel:+91-9003955707,Email:vkanbu51@gmail.com
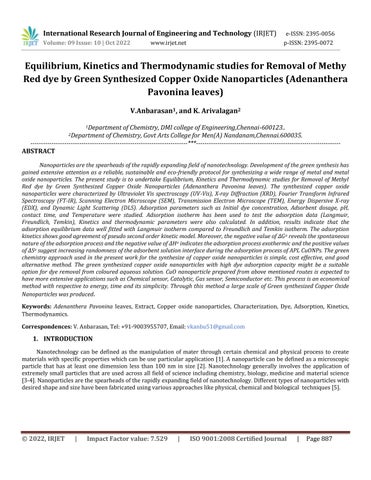
Nanotechnology can be defined as the manipulation of mater through certain chemical and physical process to create materialswithspecificproperties whichcanbeuseparticularapplication[1].Ananoparticlecanbedefinedasamicroscopic particle that has at least one dimension less than 100 nm in size [2]. Nanotechnology generally involves the application of extremelysmall particlesthatareused across all fieldofscience includingchemistry,biology,medicineandmaterial science [3-4].Nanoparticlesarethespearheadsoftherapidlyexpandingfieldofnanotechnology.Differenttypesofnanoparticleswith desiredshapeandsizehavebeenfabricatedusingvariousapproacheslikephysical,chemicalandbiological techniques[5].
International Research Journal of Engineering and Technology (IRJET) e-ISSN:2395-0056
Volume: 09 Issue: 10 | Oct 2022 www.irjet.net p-ISSN:2395-0072
The biological method which is represented as an alternative to chemical and physical methods, provides an environmentally friendly way of synthesizing nanoparticles. Moreover, this method does not require expensive, harmful and toxicchemicals.Metallicnanoparticleswithvariousshapes,sizescontentsandphysiochemicalpropertiescanbesynthesized thebiological methodactivelyusedinrecentyears.Traditional methodsareusedfrompastmanyyearsbut researcheshave provedthatthegreenmethodsaremoreeffectiveforthegenerationofNPswithadvantageoflesschancesoffailure,lowcost and ease of characterization.[6]. In the green synthesis method in which nanoparticles with biocompatibility are produced these agents are naturally present in the employed biological organism. Synthesis can be done in one step using biological organismsuchasBacteria,Actinobacteria,yeast,molds,algae,andplants(or)theirproducts.
Theplantsareconsideredtobemoresuitablecomparedtomicrobesforgreensynthesisofnanoparticlesastheyare non-pathogenic and various pathways are thoroughly researched. The plants (or) plants extract, which act as reducing and capping agents for nanoparticle synthesis, are more advantageous over other biological process [7]. Because they eliminate theelaboratedprocessofculturingandmaintainingofthecellandcanalsobescaledupforlargescalenanoparticlesynthesis is preferred because it is cost-effective, environment-friendly, a single step method for bio synthesis process and safe for humantherapeuticuses.differentpartsofplantmaterialssuchasextracts.Fruit,fruitpeels,bark,root,leaves,andtubers[8]. Plantswhichhavegreatpotentialfordetoxification,reductionandaccumulationofmetalsarepromisingfastandeconomical in removing metal-borne pollutants. Metallic nanoparticles having various morphological characteristics can be produced intra cellularlyandextra cellularly.Withthematerialspresentintheplant extractsuchassugar,flavonoid,protein, enzyme, polymer,andgenieacidactingasareducingagenttakechargeinbioinductionofmetalionsintonanoparticles[9-13].
Metal and metal oxide nanomaterials prepared from earth-abundant and inexpensive metals have attracted considerable attention because of their prospect as viable alternatives to the expensive metal-based catalysts used in many conventional chemical processes[14]Nanomaterial’s exhibitactivitieswhichare differentfrom thoseofthecorresponding bulk materials because of their size and shape-dependent physicochemical and optoelectronic properties [15]. The catalytic activity of nanomaterials represents a rich resource for chemical processes, employed both in industry and in academia. The great interest in catalysis using nanomaterials has prompted the synthesis and investigation of a diverse range of highly functionalized nanoparticles (NPs), including metal oxide nanostructures [16-20]. Some of the distinguish reported types of
International Research Journal of Engineering and Technology (IRJET) e-ISSN:2395-0056
Volume: 09 Issue: 10 | Oct 2022 www.irjet.net p-ISSN:2395-0072
nanoparticles includes photochromatic nanoparticles, polymer coated nanoparticles, metal oxide nanoparticles, FeO, CuO, MgO,ZnO,FeNPs,AuNPs,AgNPs,PdNPs[21-23].
Among the various metals like Cu based nanomaterials which are cheap and environmentally friendly are especially attractiveinthiscontextduetothehighabundanceofCuinnatureandtheavailablesimpleandstraightforwardtechniques to synthesize these nanomaterials. The present green method for the synthesis of CuO nanoparticles is simple, mild, and environmentally friendly. Green synthesis of CuO nonoparticles could also be extended to fabricate other, industrially importantmetaloxides.
Waterconservationisoneoftheimportantenvironmentalissuesaffectingbothhumanbeingandtheearth [24].Dyesare among the major contributors in water pollution [25]. Wastewater from textile, cosmetic, printing, dyeing, food industry, papermakingindustriesispollutedbydyes.Dischargeofthecolouredeffluentspresentsamajorenvironmentalproblemfor developingcountriesbecauseoftheirtoxicandcarcinogeniceffectsonlivingbeings[26].Theannualproductionofsynthetic organicdyesismorethan700,000tonsthroughouttheworld.Besidesdifferentindustriesutilizemorethan10,000different dyes, dyestuff, and pigments [27]. Therefore, many methods such as physical, chemical coagulation and biological treatment havebeendevelopedfortheremovalofdyepollutionsfromwastewaterbeforebeingdischargeintotheenvironment[28-29]. Among the available technologies for the dye removal adsorption is a selective one with a high efficiency [30-34]. Compare withothertechnologiesitiscosteffectivebetterassignedandhasahighdegreeofaccessibilityandcapabilityindyeremoval [35-36].
Inthepresentstudycopperoxidenanoparticles(CuONPs)weresynthesizedusing Adenanthera Pavonina leavesandused forremovalMethylreddye.
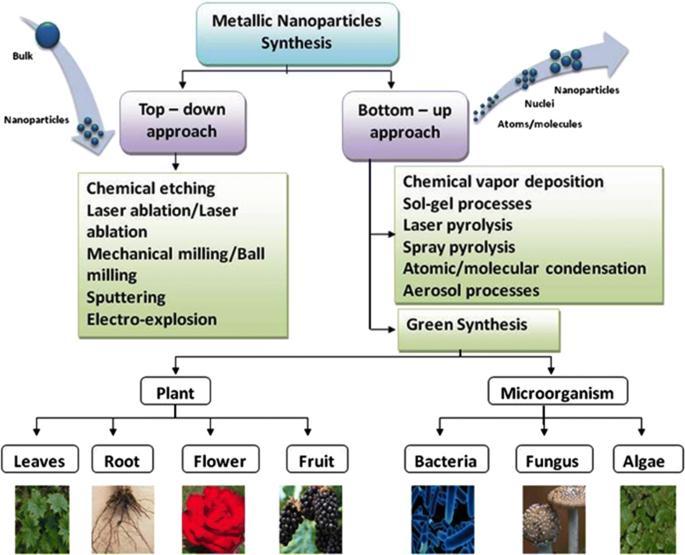
All chemicals used were of analytical reagent without any further purification in addition to deionised water, copper chloridedihydrate(CuCl2.2H2O),Sodiumhydroxide(NaOH),hydrochloricacid(HCl),andethanol(C2H5OH.MethylRed(MR)is anazodye(Knownas(2-{E)-[-4-(dimethylamenophenyl]diazinyl}benzoicacid)aswell,itisapHindicator,itisyellowinpH morethan6.2redinpHvaluesunder4.4andorangeinbetween.Itwasselectedasmodelsystemduetoitsintense colourin aqueoussystemandbiodegradabilitybecauseofbenzenerings.
The molecular structure of Methyl red is depicted in Fig.2 [37]. The chemical formula of methyl red is C15H15N3O2 with molecularweight(269.31g/molλmax =417nm)[38].
The Adenanthera Pavonina leaves were collected from Ashok Nagar, Chennai. The fresh tuber was washed several times with tap water followed by distilled water to remove the dust particles. The clean and fresh sources are dried in a shaded
International Research Journal of Engineering and Technology (IRJET) e-ISSN:2395-0056
Volume: 09 Issue: 10 | Oct 2022 www.irjet.net p-ISSN:2395-0072
place at room temperature for 10 to 15 days and then the leaves were pulverized using commercial blender. The fine powderedwasstoredatroomtemperatureforfurtheruse. Ina250mlofconicalflask10gmof tuberpowderweretakenand tothis100mlofdoubledistilledwaterisaddedanditisheatedat80oCfor30minutes. Thenthesolutionwasfilteredusing Whatmanfilterpaperandkeptasideforfurtherprocess. TheobtainedextractinpalebrowncolourandadjustthepHat11by adding0.1Mofsodiumhydroxidesolution.
Ina250mlconicalflask,50mlof Adenanthera Pavonina leavesextractwastakenandtothis100mlof0.1MCuCl2.2H2O solutionisaddedslowlyatroomtemperatureunderstaticconditions. Thecolourchangeofthereactionwasobservedandthe timetakenforthechangeswasnoted. Thesolutioncolourchangesimmediatelyfrompalebrownishtoyellowishgreycolour indicating the formation of copper oxide nanoparticles (CuONP). Further the solution is centrifuged and precipitated is extractedanddriedinelectricalovenfor24hoursat100oC.thedriedsamplekeptinmufflefurnacefor4hoursat500oC.the greensynthesisedCuONPsisformedatuniformparticlesizeandstoredforfurthercharacterisationanduses.
The synthetic dye such as Methyl Red (MR) were purchased from kevin laboratories in Chennai. A stock solution of (1000mg/L)waspreparedbydissolving1.0gofdyedistilledwater.Distilledwaterwasusedforpreparingallthesolutionand reagents.
Synthesized CuO nanoparticles were subjected to UV-Vis spectroscopy analysis, which confirms the formation of nanoparticlesintheinitialstage. TheCuOnanoparticlessynthesizedweresubjectedtoscanUV-Visspectrophotometerinthe range190nm-800nmusingElicoSL210UVVISSpectrophotometer.
The plant extract and green synthesized CuO nanoparticles were characterized by FT-IR spectrometer. The spectroscopic technique is based on the analysis of peaks at certain wave numbers. FT-IR data indicates the presence of functionalgroupsintheplantextractandsynthesizednanoparticles. TheFT-IRanalysiscarriedoutinthefrequencyrangeof 4000-400cm-1 usingPerkinElmerinstrument.
X-ray diffractometer (lakjdf) was used to study the average particle size and crystalline nature of the synthesized adsorbents. ThediffractionpatternwasobtainedbyusingCuKα radiationwith wavelengthofλ=1.541Ao. Thescanning was donein2θvaluerangeof4o to80o at0.02min-1 andonesecondtimeconstant.
The SEM analysis provide the details about surface morphology, porosity and particle size distribution of the adsorbents. ThesurfacemorphologyofthesynthesizedCuOnanoparticleswasrecordedusingHitachiinstrument
EDX is an analytical technique used for the elemental analysis of a adsorbent and it depends on the interaction between known source of X-ray excitation and the Adsorbent. The elemental composition of the adsorbent was determined withthehelpofelementalanalyser(CE-440elementalanalyser).
2.4.6
International Research Journal of Engineering and Technology (IRJET) e-ISSN:2395-0056
Volume: 09 Issue: 10 | Oct 2022 www.irjet.net p-ISSN:2395-0072
TEM is regarded as the best among other electron microscopy techniques for the determination of particle size and morphologicalidentitiesofCuONPsandothermetalnanoparticle
2.4.7.
DLSisanextensivelyusedtechniquefordeterminingthehydrodynamicdiameterofnanoparticlesestablishedonthe Brownianmovementofparticlesinthesuspension
The experiment was carried out by the batch adsorption method. the removal of dyes was studied various temperature(298K,308K,318K,328k)usingthebatchtechniquetoinvestigatetheeffectofoperationalparameterssuchaspH, initialdyeconcentration,adsorbentdosage,contacttime,andsolutiontemperature.Theisothermstudywascarriedoutwith different initial dye concentration of dyes from 10 to 70mg/L constant and carefully arranged in the orbital shaker and agitation at 150rpm speed for 30 minutes. The adsorbent dosage was checked from 0.2 to 1.0g for better adsorption. The kineticstudywasdonebyvaryingtimefrom30to150minutes,forthethermodynamicstudytemperaturefrom298to328K. the CuONPs solution was separated by centrifugation at 2000rpm for 10 minutes. Residual concentration of dye was determined UV-visible spectrophotometer at respective wavelength. The percentage of dye removal from solution was calculatedfollowing
ThepercentageofMRadsorbedwasdeterminebasedonthefollowingformula
ThemaximumMRuptakeqe (inmgg-1)wascalculatedasshownbelow
whereCo andCe areinitialandfinalMRconcentrationofinmg1-1,respectivelyWistheamountofCuONP(ing)andVisthe volumeofMRsolution.
3.1. Characterization study of Copper Oxide Nanoparticles.
3.1.1. UV- vis Absorption Spectroscopy for copper oxide Nanoparticles.
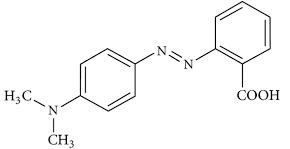
TheGreenapproachfortheformationofcopperoxidenanoparticlesusing Adenanthera Pavonina leavesextractwasreported. Formation of copper oxide nanoparticle were confirmed by UV-vis spectrophotometry. Fig 3. shows the UV-Vis absorption spectrumofcopperoxidenanoparticle.Theadsorption spectrumwasrecordedforthesampleintherangeof200 – 800nm. Thespectrumshowedtheabsorbancepeakat286nmcorrespondingtothecharacteristic bandofcopperoxidenanoparticle [39].
3.1.2.
International Research Journal of Engineering and Technology (IRJET) e-ISSN:2395-0056
Volume: 09 Issue: 10 | Oct 2022 www.irjet.net p-ISSN:2395-0072
Fig 3. UV-visible adsorption spectrum of a) APL extract and b) APL CuONPs
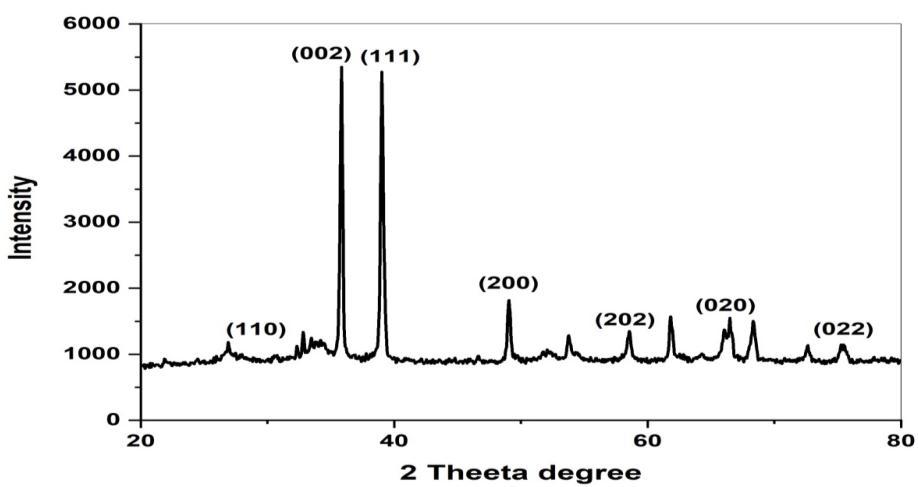
The x-ray diffraction (XRD) study was undertaken to Determine and confirm the crystalline structure of synthesized CuONPs.Fig(4)Showstheappearanceofdiffractionpatternat2θ=33.3,35.4,38.8,48.7,58.3,61.8,66.28and68.0whichare assigned to the planes (110), (022), (111), (200), (202), (020), (202), (022) respectively of monoclinic phase CuONPs. No characteristic peak due to any impurity was observed in the diffraction grams Suggesting the formation of pure crystalline CuO.
TheaveragesizeoftheCuOwascalculatedbyusingtheDebye-SchererEquation(3)[40].Asharppeakat20=35.4and 38.8withthediffractionofthe(022)and(111)planeindicatesthatconfirmationofCuONPs.Theaveragecrystallitesizeinthe samplesofCuONPsisbelow21nm.
D=0.9λ/βcosθ Eq.(3) Whereλisthewavelengthofthex-rayradiation(0.154nm),θistheDiffractionangleandβisthefullwidthathalfmaximum
Fig 4: X-ray diffraction pattern of Adenanthera Pavonina leaves extract- mediated synthesized CuONPs
International Research Journal of Engineering and Technology (IRJET) e-ISSN:2395-0056 Volume: 09 Issue: 10 | Oct 2022 www.irjet.net p-ISSN:2395-0072
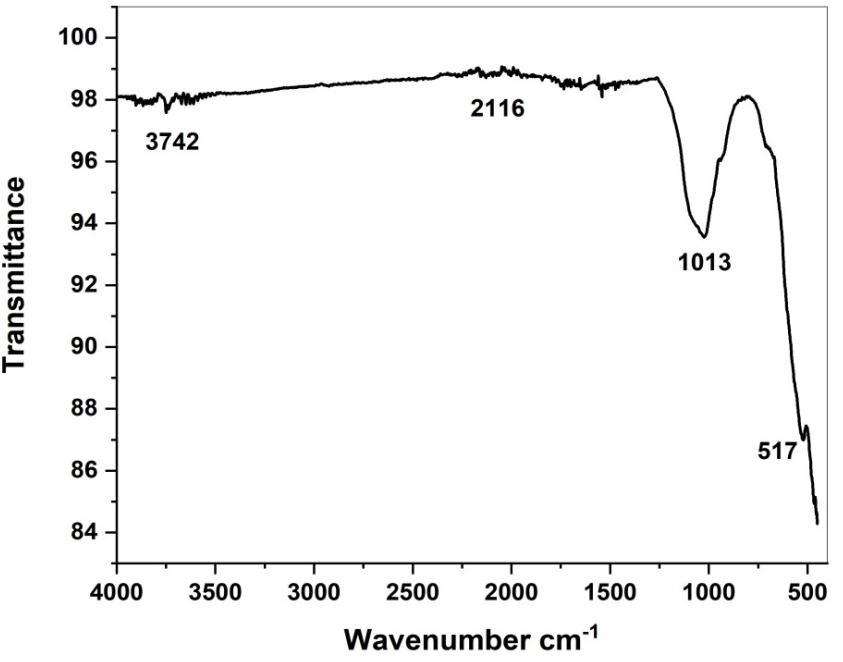
FTIR spectroscopy analysis also revealed the possible biomolecules and functional group responsible for capping or stabilizing of the synthesized CuONPs were expressed in fig (5a, 5b). Taking the spectrum of tuber Extract as control the involvement of different functional groups of Adenanthera Pavonina leaves extract in reducing and stabilizing process of nanoparticlessynthesiswasevaluated.Absorbancebandsat3451,2080,1625,and729cm-1 wereobservedinthespectrumof Adenanthera Pavonina leaves extract. A broad band at 3451 cm-1 was due to the O-H stretching of alcohol compounds. The peaks at 2080 and 1625 cm-1 are Containing -NH2 group and C=O groups of flavonoids [41-42]. 775 cm-1 is containing C-H bonds.FTIRspectrumofCuONPforthepeakappeared at3742,2116,1013,709,and517cm-1.Thepeaksat3742,2116and 1013 cm-1 corresponding to hydroxyl group (-OH) Stretching, hydroxyl (-OH) bending and C-O stretching respectively. The Narrowbandsat517confirmtheformationofCuONPs.
Fig 5a. FTIR spectrum of APL extract
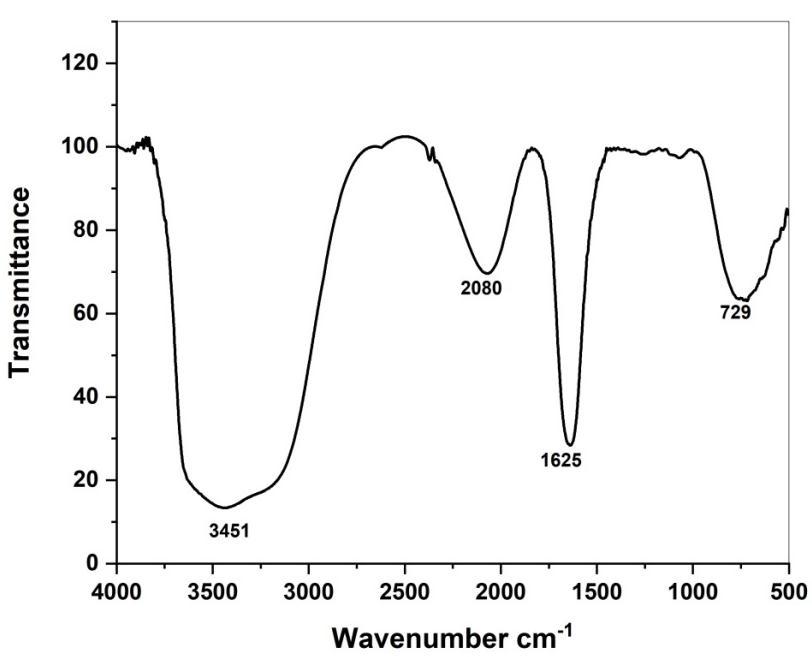
Fig 5b. FTIR spectrum of APL green synthesized CuO NPs
International Research Journal of Engineering and Technology (IRJET) e-ISSN:2395-0056
Volume: 09 Issue: 10 | Oct 2022 www.irjet.net p-ISSN:2395-0072
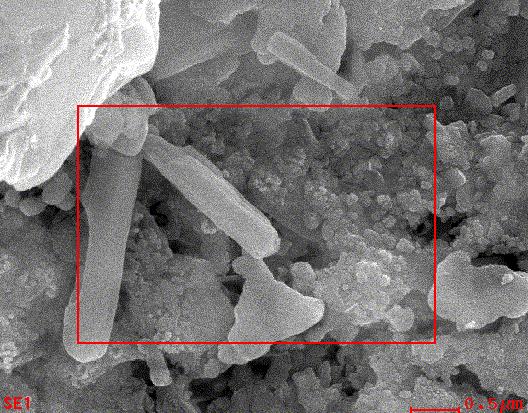
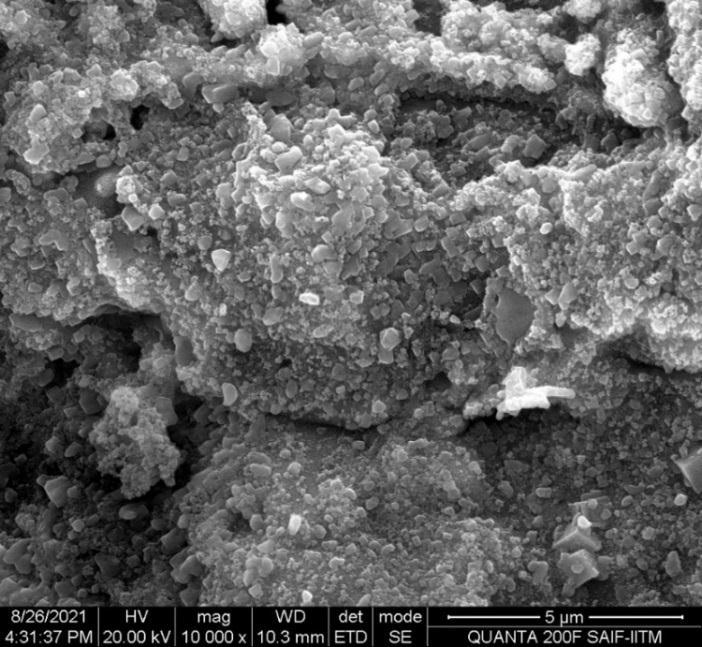
ThemorphologyofCuOnanoparticlesstudiedbySEManalysis.Fig(6)showathesurfacemorphologyofthecopperoxide nanoparticles was observed in the SEM image. It seems that the diameter of CuO nanoparticles range between 60-80 nm as calculatedbyimageJprogramme[43].
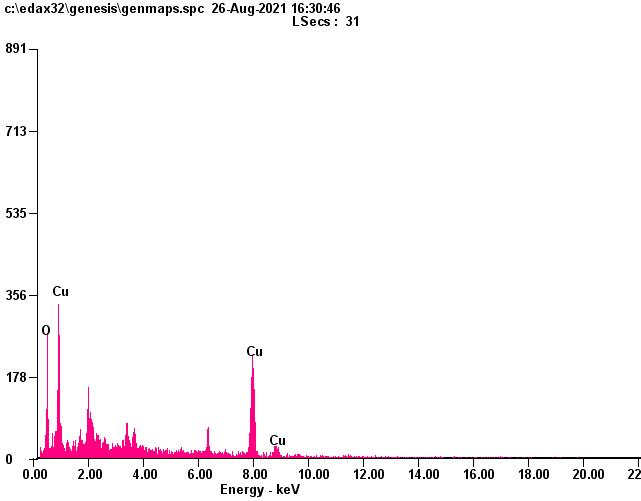
TheEnergyDispersive X-ray(EDX)studywascarriedoutforthegreensynthesizedCuO nanoparticlestoknowaboutthe elementalcomposition.EDXconfirmthepresenceofCuandOsignalsofCuO nanoparticlesasshownin fig7andtable1.The elementalanalysisofnanoparticlesyieldsCu78.07%and21.93%ofoxygenwhichprocessthattheproducenanoparticlesisin itshighestpurifiedform[44].
Fig 6.
Fig 7 Shows EDX spectrum of APL CuO nanoparticle
International Research Journal of Engineering and Technology (IRJET) e-ISSN:2395-0056
Volume: 09 Issue: 10 | Oct 2022 www.irjet.net p-ISSN:2395-0072
Table 1: EDX analysis for synthesized copper oxide nanoparticles.
S.NO Element Weight(%) 1. Cu 78.07 2. O 21.93
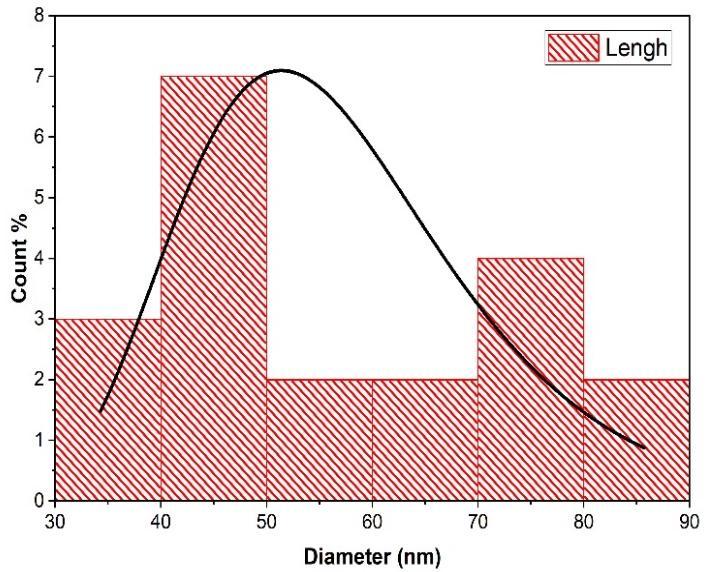
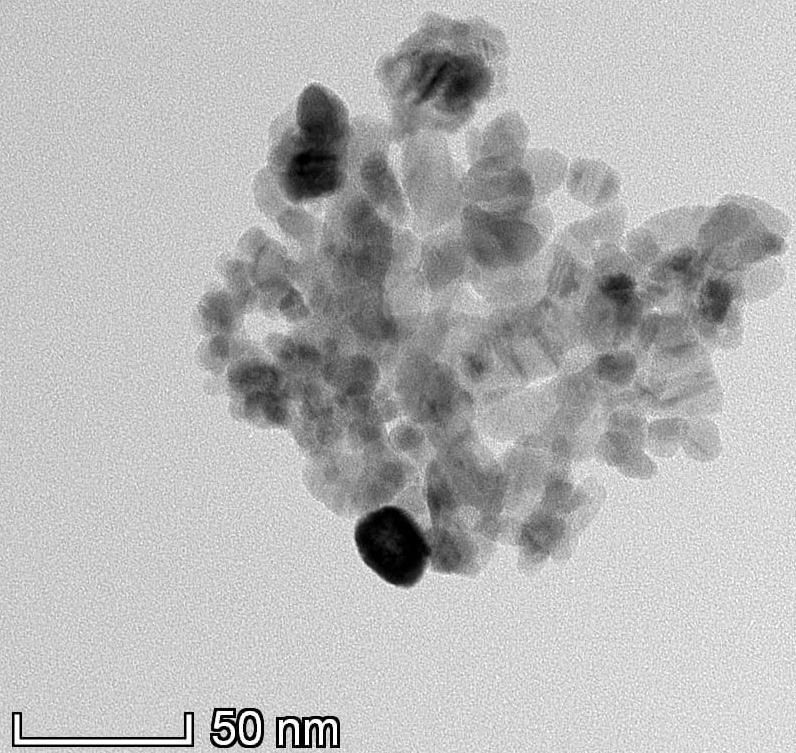
The detailed morphological and size analyses of green synthesized copper oxide nanoparticles were studied using electronmicroscopeandresultsshowninfig8 TheTEMimagerevealsthatthebiosynthesisCuONPsweeagglomeratedwhich are interconnected to each other and spherical in shape which is also in agreement with result obtained from SEM. The estimatetheparticleisfoundtobebetween10-60nm.Theparticlesizecalculatedbyhistogram.Theparticlesizedetermined TEMclosetoXRD[45].
(a)
(b)
Fig 8. a) HR-TEM image b) Histogram of APL copper oxide nanoparticles
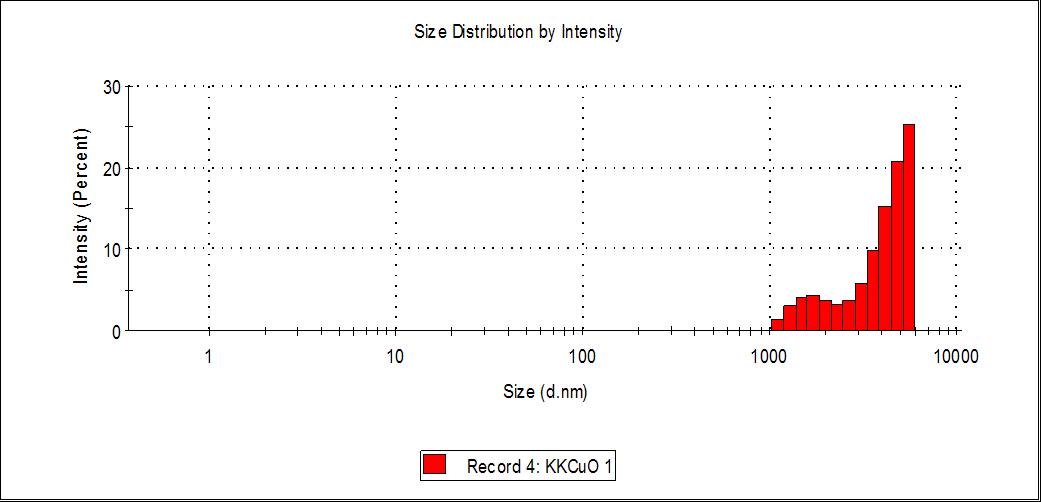
To analyse the particles size distribution, green synthesized CuONPs were subjected to dynamic light scattering (DLS) analysis.DLSisanextensivelyusedtechniquefordeterminingthehydrodynamicdiameterofnanoparticlesestablishedonthe Brownianmovementofparticlesinthesuspension. Theaveragehydrodynamicsizeofthenanoparticles Fig.(9)calculatedby DLSisquitelargerthanthe theoreticalsizeofthenanoparticlescalculatedusingXRD[46]. Thevariationinthenanoparticle size could be associated with the polydispersity index (PDI) values in turn related to the existence of nanoparticles as aggregatesoragglomerates. PDImeasurementswerefoundtobe0.216of APLCuONPsrespectively. ThePDIvaluerevealed thattheproducedcopperoxidenanoparticlesmonodispersed.
International Research Journal of Engineering and Technology (IRJET) e-ISSN:2395-0056
Volume: 09 Issue: 10 | Oct 2022 www.irjet.net p-ISSN:2395-0072
Fig. 9. DLS analysis of CuONPs from APL extract
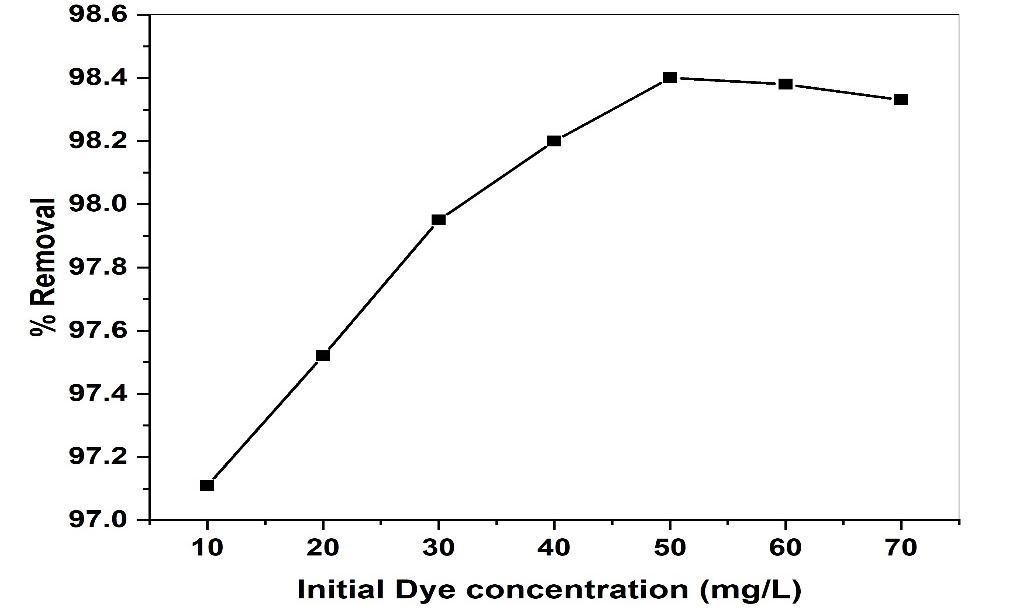
TheinferenceoftheinitialconcentrationofMRintheSolutionsontherateofadsorptiononCuONPswasinvestigated. TheExperimentsparameterwascarriedoutwithfixedadsorbentdosageoptimalpHandstablymaintainedtemperature.The percentage removal of MR is plotted against the initial dye concentration shown in Fig (10). The percentage removal of dye increased from 97.11to 98.43% with an increase in initial dye concentration from 10 to 50 mg/L, after that the adsorption efficiencydecreased withincreasedyeconcentrationfrom50to70mg/L.Maximumadsorptionof98.43% wasrecorded for (50mg/L).Thiscouldbeattributedtotheincreaseinthedrivingforcefromhigherconcentrationwhichenhancesthesorption process.
Fig.10.Effect of Initial MR dye concentration on the adsorption of GS-APLCuONPs.
International Research Journal of Engineering and Technology (IRJET) e-ISSN:2395-0056
Volume: 09 Issue: 10 | Oct 2022 www.irjet.net p-ISSN:2395-0072
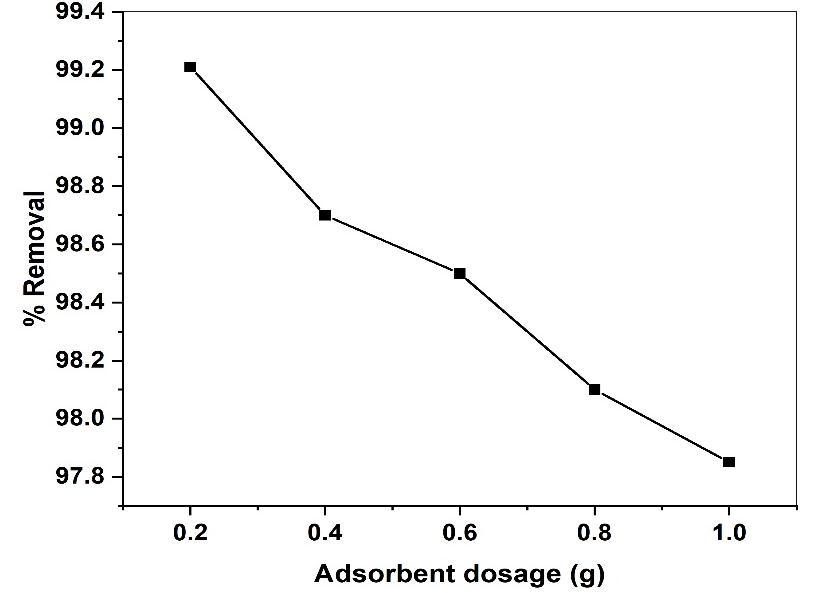
The effect of adsorbent dosage on the removal of the MR from aqueous solution was determined using variablequantitiesofGS-APLCuNOPsadsorbentrangingfrom0.2gto1.0gatfixedvolumes50(ml)withinitialdyesolution 50 mg/L under constant parameters. The results are shown fig (11). The highest percentage of MR removal was achieved using0.2gCuONPs.AtelevatedlevelsofCuONPstheamountofMRremovalgetsdecreased.TheobserveddecreaseinMRdyes removalwithincreaseadsorbentdosagefrom99.21%to97.85%.Thisphenomenonattributestooverlappingoraggregation ofadsorptionsitesresultinginanincreasetotaladsorbentsurfaceareawithrespectiveinitialdyeconcentration.
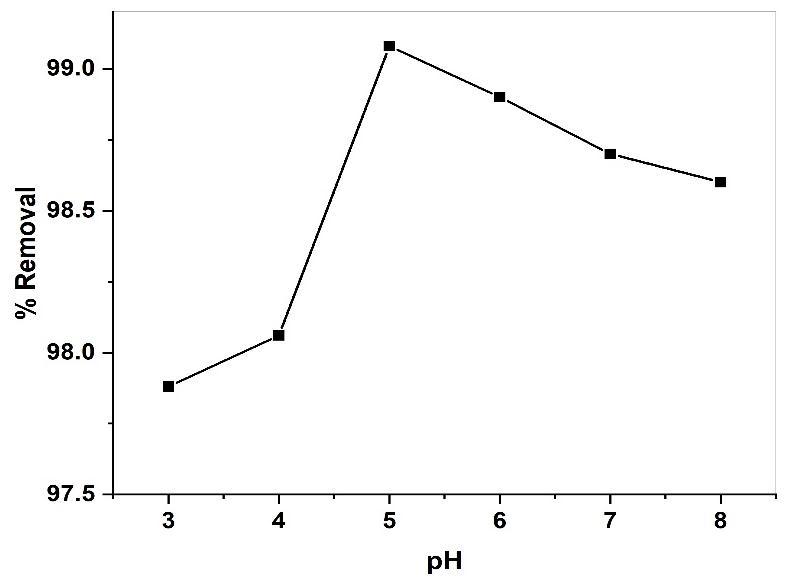
TostudytheeffectofinitialpHontoadsorption.ThepHofMRsolutionwasvariedfrom3to8.Theresultsofthevariation in MR percentage removal with increase in pH is shown fig (12). As the solution pH was increased 3 to 5 the percentage removal ofMR increased97.88to99.08%forCuONPs, afterthattheadsorptionefficiencydecreased.uptakeof dyesmainly dependsuponpHofadsorbentandPKaofthedyes.ThepHofCuONPsfoundtobeslightlyacidicsinceitssurfacefilledwith positivechargedparticles.ThePKaofMRis5.1[47].TheMRmoleculesarepositivelychargedatPH>PKa.Theincreaseinthe percent dye removal with increase in pH from 3 to 5 for CuONPs might be ascribe to the electrostatic attraction between positivelychargedadsorbentsurfaceandnegativelychargeddyemolecules[48].AnincreasepHbeyond5forCuONPspercent removaldecreasedprobablyduetoelectrostaticrepulsionbetweennegativelychargeadsorbentsurfaceandpositivelycharge dyemolecules.
3.2.4
International Research Journal of Engineering and Technology (IRJET) e-ISSN:2395-0056
Volume: 09 Issue: 10 | Oct 2022 www.irjet.net p-ISSN:2395-0072
Fig 12. Effect pH on the adsorption of MR onto GS-APLCuONP
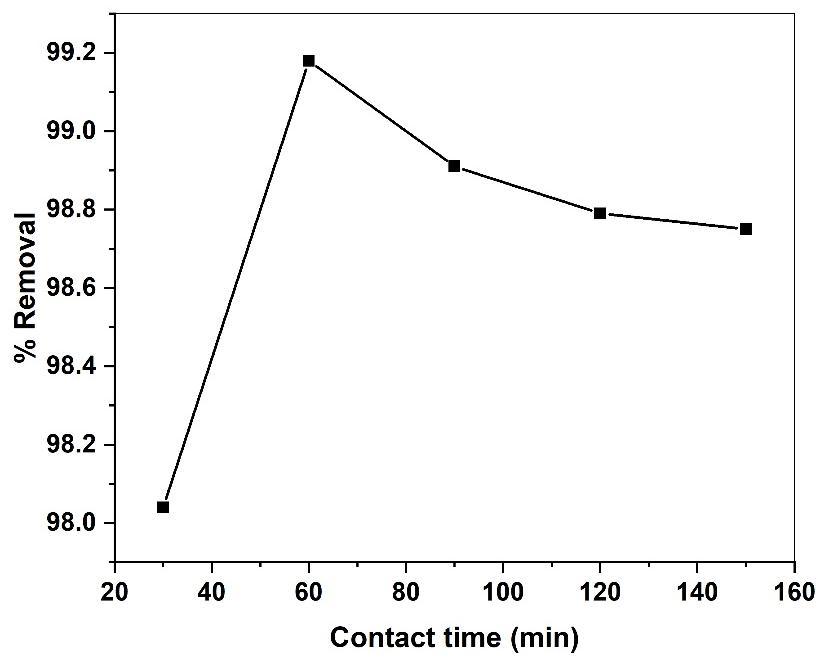
Toidentitytheeffectofcontacttime anexperimentwasconductedbymixing50ml ofmethyl redsolution 50 mg/l concentration with 0.2g of GS-APLCuONPs adsorbent at constant pH 5 with varying time intervals of (30,60,90,120 and 150) minutes respectively. The contact time effect on the methyl red adsorption onto GS-APLCuONPs is depicted in fig (13). Which correlate relation between the percentage adsorption and adsorption time. The figure shows that the removal efficiencyisequilibriumtimedependent.Itisevidentthattheamountofadsorptionisrapidintheinitialstagesanddecrease with increase in contact time. The fact which is inferred from the above process state large number of vacant sites were available for adsorption moment equilibrium attained at particular contact time due to desorption removal get decreased furtherly
Fig 13. Effect of contact time on the adsorption of MR onto GS-CuONP.
International Research Journal of Engineering and Technology (IRJET) e-ISSN:2395-0056
Volume: 09 Issue: 10 | Oct 2022 www.irjet.net p-ISSN:2395-0072
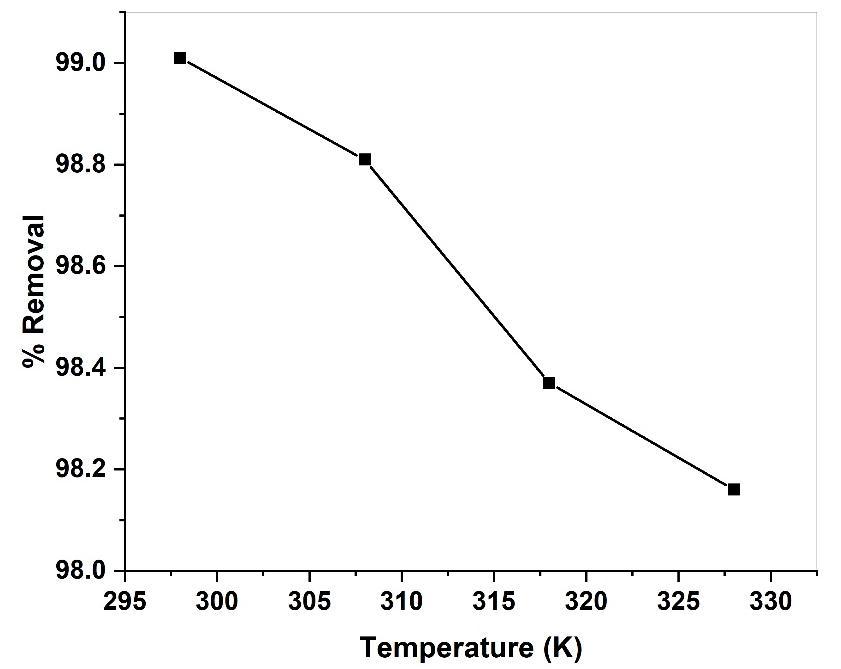
Temperature is an important parameter that influence dye adsorption the effect of temperature on the percentage removalofmethylredontoGS-APLCuONPsisshowninfig(14).Thepercentageremovaladsorptiondecreasedfrom99.01% to 98.16% with the temperature increased from 298K to 328K. This decrease in adsorption efficiency with increase in temperaturemaybeattributedmainlytothefactthatthephysicalbondingbetweenthedye(adsorbate)andtheactivesitesof theadsorbentis weaknessasthetemperature rises. Furthermostthedyesolubilityincreasesalsocausingtheinteraction between the solute and solvent to become stronger than between the solute and adsorbent. This therefore makes it more difficultforthesolute(i.edye)toadsorb[49].
An adsorption isotherm indicates how adsorbed molecules distribute between the liquid phase and the solid phase when the adsorption process reaches an equilibrium state. The analysis of the isotherm data by fitting then to different isotherm models is an important step to find the suitable model that can be used for design purposes [50]. In the present experimental work, theisothermal resultswere analysedusing well known expressionforLangmuir Freundlichand Temkin isotherms. The applicability of the isotherm models to the adsorption study done was compared by judging the correlationcoefficientR2 values.
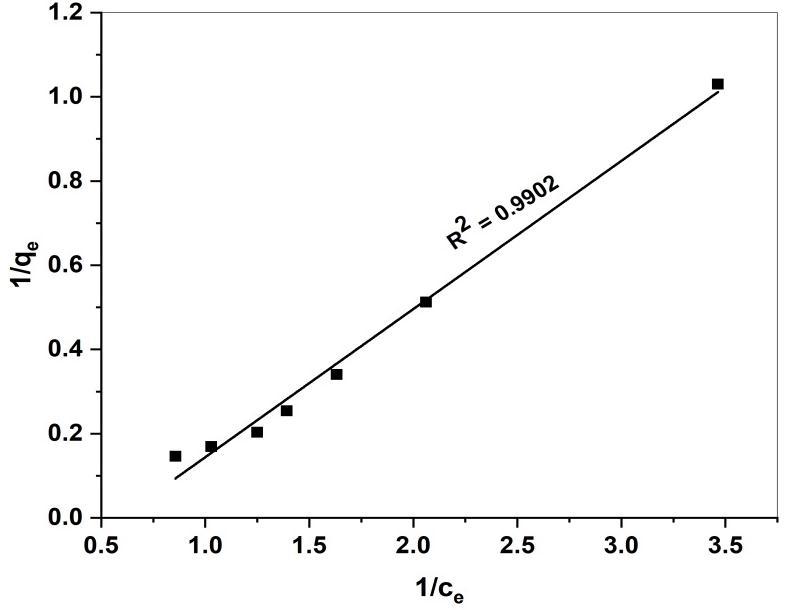
Langmuiradsorptionmodelmaximumadsorptioncorrespondstoasaturatedmonolayerofthesolutemolecules on the adsorbent surface. Langmuir isotherm model assumes the uniform energies of adsorption onto the surface and no transmigration of adsorbate in the plane of the surface. Langmuir adsorption model based on the physical hypothesis that thereisnointeractionbetweenadsorbedmoleculesandtheadsorptionenergyovertheentirecoveragesurface. Also,thereis no transmigration of the adsorbate in the plane of the surface of the adsorbent [51]. Expression of the model is given by equation(4) Eq.(4)
International Research Journal of Engineering and Technology (IRJET) e-ISSN:2395-0056
Volume: 09 Issue: 10 | Oct 2022 www.irjet.net p-ISSN:2395-0072
Whereqe istheamountofadsorbeddyeattheequilibrium(mgg-1),KL (Lmg-1)andqm (mgg-1)areLangmuirconstantrelated to energy adsorption and maximum adsorption capacity respectively. A graph was plotted 1/qe against 1/ce results in a straightlionwithaslopeof(1/qm)andintercept(1/qm).
The essential characteristic of the Langmuir isotherm can be expressed in term of dimensionless constant separation factorRL thatisgivenequation(5).
RL =1/1+KLCO Eq.(5)
ThevaluesofRL indicatesthetypeofisothermtobeeitherfavourable(0<RL >1),unfavourable(RL >1),linear(RL =1)or irreversible (RL = 0). The values of RL were found to be 0.03 suggesting the isotherm to be favourable at the concentration studied.
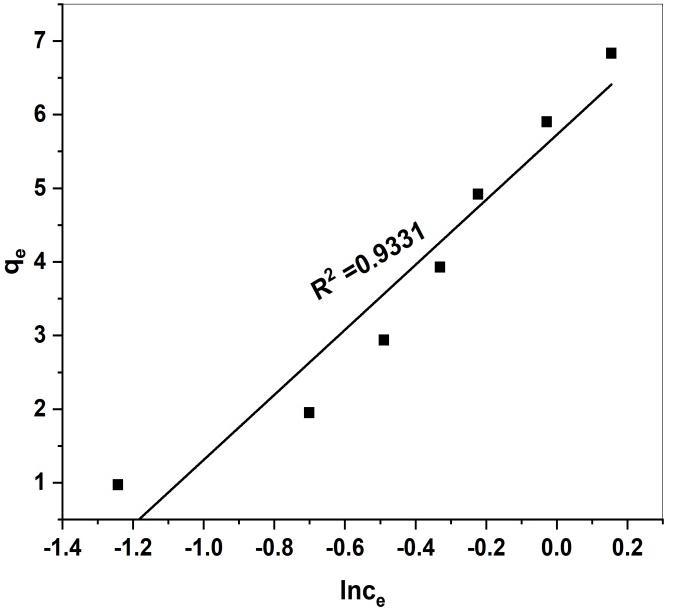
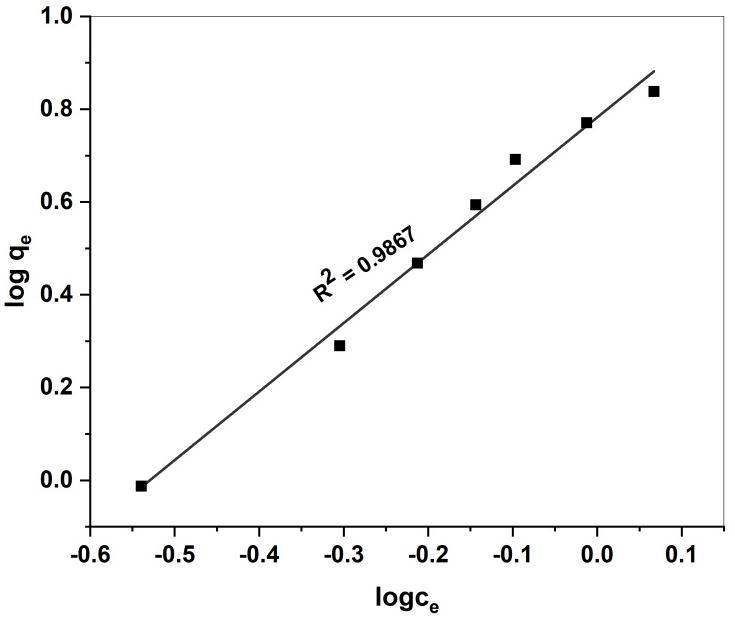
The Freundlich model is described by a formula Assuming heterogeneous multilayer adsorption on heterogeneous Surfaces.TheFreundlichmodelalsoassumesinteractionbetweentheAdsorbatesandthatadsorptioncapacityincreaseswith theanalyteConcentration.TheformuladescribingtheFreundlichmodelisshown[52]
logqe =logKF +1/nlogCe Eq.(6)
WhereKF isthereactionconstantreflectingadsorptionCapacity(in1mg-1),and1/nindicatesdimensionlessexponentof theFreundlichmodeltoshowadsorptionintensity(itiscalculatedfromtheslopeandinterceptoflogqeversuslogCeplot).
International Research Journal of Engineering and Technology (IRJET) e-ISSN:2395-0056
Volume: 09 Issue: 10 | Oct 2022 www.irjet.net p-ISSN:2395-0072
Fig 16. Freundlich isotherm plot for adsorption of MR onto GS-APL CuONP Temkin isotherm
TheTemkinisothermmodelassumesthattheAdsorptionenergydecreaselinearlywiththesurfacecoveragedueto adsorbent-adsorbateinteraction.ThelinearformofTemkinIsothermmodelisdescribedasfollows[53]
qe= Eq.(7)
Where BT is the Temkin constant related to the heat of sorption (KJ/mol), KT is the equilibrium binding constant Correspondingtothemaximumbindingenergy(L/g),TistheAbsolutetemperature(K)andRisthegasconstant(8.314X10-3 KJ/molK).
Fig 17. Temkin isotherm plot for the adsorption of MR onto GS-APL CuONPs
International Research Journal of Engineering and Technology (IRJET) e-ISSN:2395-0056
Volume: 09 Issue: 10 | Oct 2022 www.irjet.net p-ISSN:2395-0072
Fig 15,16,and17.,displaystheLangmuir,Freundlich,andTemkinisothermsforouradsorptionexperiments.Thecalculated parametersfortheallisothermsalongwithR2 valuesareshowntable(2)
Table (2). Isotherm parameters for removal of MR adsorption onto GS-APLCuONPs
Adsorption Isotherm
Parameters
FreundlichIsotherm
Methyl Red
KF (mg/g) 6.0589 1/n 1.4781 n 0.6765 R2 0.9868
LangmuirIsotherm KL (mg-1) 0.5908 qm (mg/g) 4.8100 RL 0.0327 R2 0.9902
TemkinIsotherm
KT (mol/g) 3.0024 BT (mol/kJ) 4.4789 R2 0.9331
The Langmuir isotherm model well fitted and good agreement with experimental data better than Freundlich and Temkin isothermmodels.TheresultsalsoconfirmedbythehighR2 valuefortheLangmuirmodel(0.9902)comparedwithFreundlich (0.9867)andTemkin(0.9331)isothermmodels.TheLangmuirisothermfitwellbecausehomogeneous distributionofactive sitesontoGS-CuONPsurface.ThisfindingwassimilartootherstudiesonthesorptionofMRdyeondifferentsorbent
Adsorptionkinetiesstudiestherelationshipbetweenadsorptioncapacityandreactiontime.Thus,itsmainconcern isadsorptionspeeddynamicequilibrium masstransferanddiffusionrates.Analysisoftheseparametershelps tounderstand adsorption process rates as well as adsorption mechanism. The pseudo-first-order model and pseudo-second-order model wereusedtoinvestigatetheadsorptionkinetiesoftheMRdyeonGS-CuONPs.
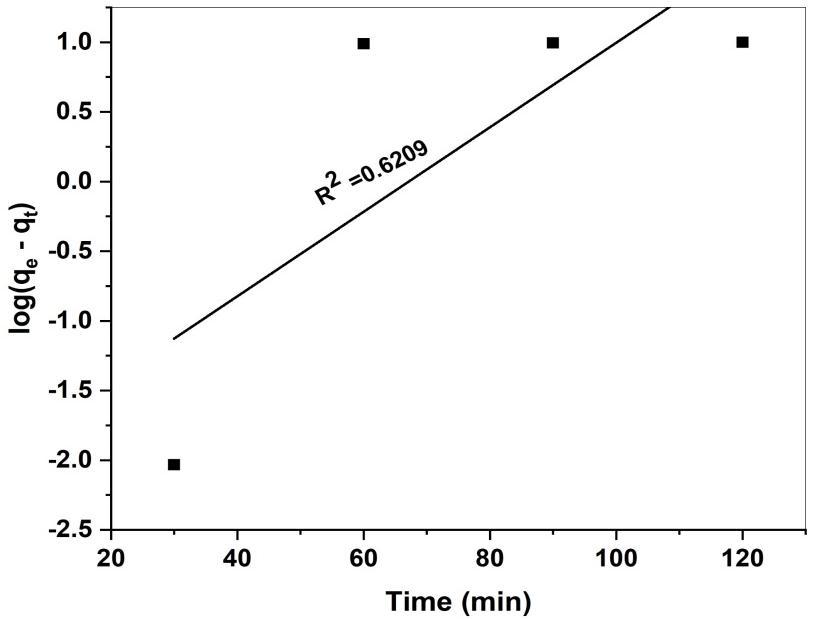
Thelinerformofthepseudo-first-orderkinetinmodelisrepresentedbythefollowingequation.
Log(qe-qt)=logqe –K1/2.303.t Eq(8)
Whereqeandqtarethevaluesofamountofthedyeadsorbedperunitmassontheadsorbentatequilibriumatvarioustime respectively. K1 is the pseudo first order adsorption rate constant (min-1). The values of K1 and the calculated of are determinedfromslopeandinterceptrespectivelyofthelinersplotoflog(qe-qt)versust.Fig18.wherethevaluesaregivenin table(3).
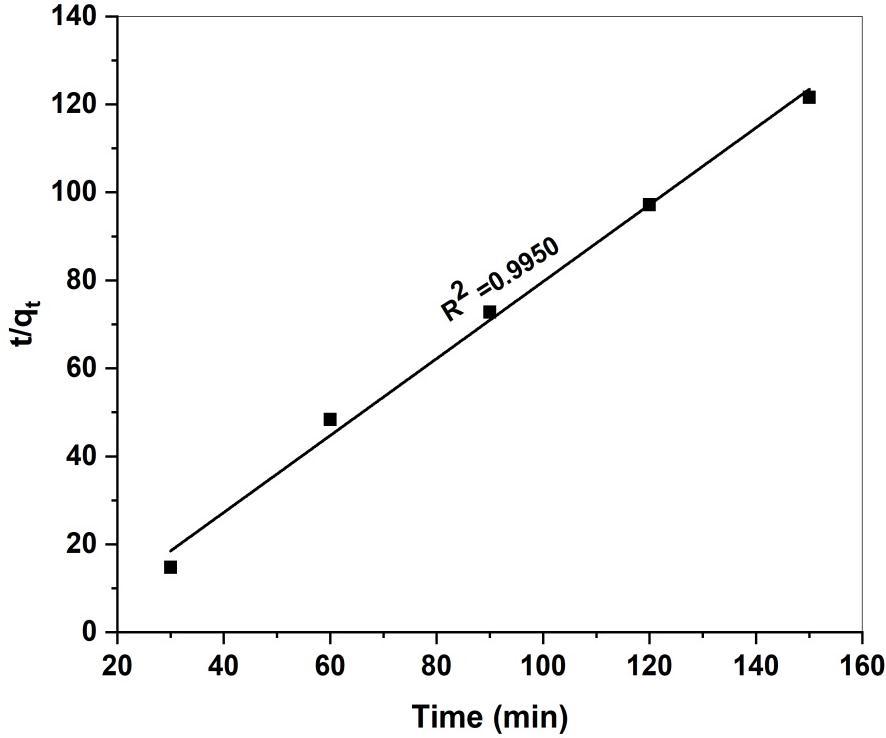
Thelinerformofthepseudo-second-ordermodelisgivenbyequation(9)[54] t/qt=1/K2 qe 2 +t/qe Eq(9)
WhereK2isthepseudo-scond-orderadsorptionrateconstant(g/mg1min)andqeistheamountofdyeadsorbed(mg/g)on theadsorbentequilibrium.Theinitialadsorptionrate(h=mgg-1)isexpressedas h=K2qe2
International Research Journal of Engineering and Technology (IRJET) e-ISSN:2395-0056
Volume: 09 Issue: 10 | Oct 2022 www.irjet.net p-ISSN:2395-0072
Theplotoft/qtversustgivesalinerrelationshipwhichallowscomputationofK2handcalculatedqeshownfig19.
ThekineticadsorptionresultsofMRbyGS-CuONPsundervariousconditionfromtherelatedplotsandtheresults arelistedintable(2).Theapplicabilityofthesemodelisbasedonthejudgmentontherespectivecorrelationcoefficient(R2) and agreement between the experimental and calculated value of qe. The correlation coefficient R2 (0.6029) values obtained forpseudo-first-orderkineticmodelwererelativelylowhencethismodelhasverypoorcorrelationcoefficientforthefitdata.
The pseudo-second-order rate constant K2 and qe determined from the model as well as correlation coefficient presented in table (3). The observed R2 (0.9950) values are very high for the pseudo-second-order kinetic model, where the values of qe cal are good agreement with qe exp. It is therefore evident that pseudo-second-order model is the best fit kinetic modelindescribingtheadsorptionprocessMRontoGS-CuONPs.
Fig 18 Pseudo-first-order kinetic model plot for adsorption of MR onto GS-CuONP
Fig 19. Pseudo-second order kinetic model for adsorption of the MR onto GS-CuO
International Research Journal of Engineering and Technology (IRJET) e-ISSN:2395-0056
Volume: 09 Issue: 10 | Oct 2022 www.irjet.net p-ISSN:2395-0072
Table 3. Adsorption kinetics of MR
PseudoFirstOrder
Parameters
Methyl Red
K1 (min-1) 0.0697 qe (mgg-1) 5.8036 R2 0.6029
PseudoSecondOrder h(g-1 mg-1 min-1) 0.1286 qe (mgg-1) 1.1435 R2 0.9950
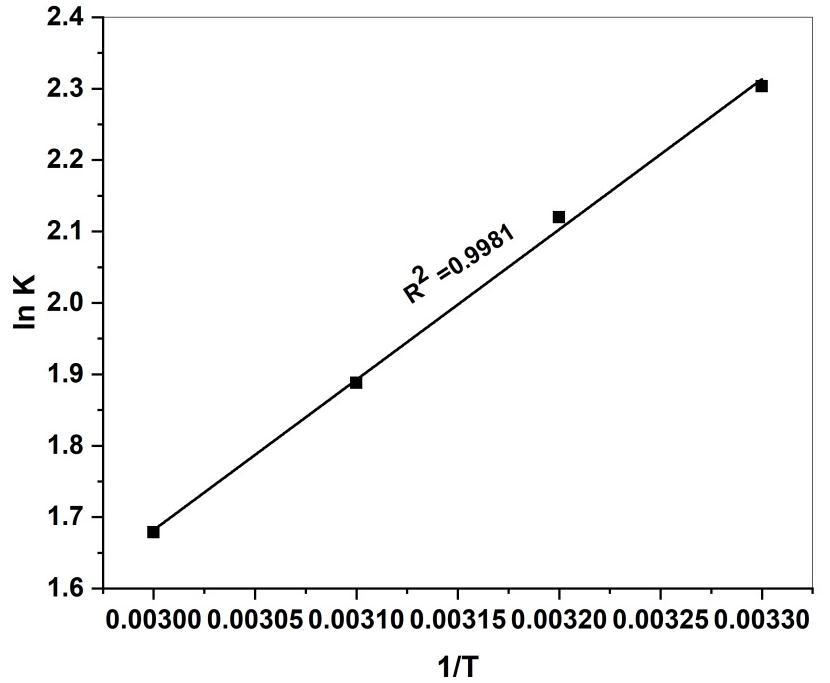
Thermodynamic parameters are important in adsorption studies they provide a better understanding of the effect of temperatureontheadsorptionprocess.Thestandardchangesin Gibb’senergy(∆GO)enthalpy(∆HO)andentropy(∆SO)were calculatedusingthefollowing
∆GO =-RTlnK Eq.(10)
logK=∆So/2.303R-∆Ho/2.303RT Eq.(11)
Where R is the universal gas constant (8.314 J) T is the absolute temperature (k) and K is the equilibrium constant. PlotsoflnKvs1/Tshouldbeastraightlineasshowninfig(20).
Allthermodynamicparametersweretabulatedintable(4).∆Go valueswerenegativeatalltemperaturestudies.Duringthe adsorption process the negative values of ∆Go for the experimental temperature indicate spontaneous and favourable MR adsorptionontothesurfaceofGS-CuONPs.
The negative enthalpy (∆Ho) values obtained indicate the adsorption process was exothermic in nature. The positive entropy change (∆So) values of corresponds to an increase in randomness occurred at solid-solution interface during the adsorptionprocess.Thisisindirectlyshowingtheaffinityofadsorbenttowardsdyemolecules[55].
Fig 20. Thermodynamic parameter plot for the adsorption of MR onto GS-CuONPs
International Research Journal of Engineering and Technology (IRJET) e-ISSN:2395-0056 Volume: 09 Issue: 10 | Oct 2022 www.irjet.net p-ISSN:2395-0072
Table(4).Thermodynamic parameters values for adsorption of MR onto GS-APLCuONPs
Temperature(K) ∆Go (J.mol-1) ∆Ho (KJ.mol-1) ∆So (J.mol-K-1) R2 298 -5.7063 -40.2875 88.6589 0.9981 308 -5.4281 318 -4.9915 328 -4.5788
In this study, an eco-friendly and convenient green method from copper chloride dihydrate solution using Adenanthera Pavoninaleavesextractwasdeveloped.ThegreensynthesizedcopperoxidenanoparticleswereconfirmedbyUV-vis,XRD,FTIR,SEM-EDX,TEMandDLS.Thesynthesizedcopperoxidenanoparticlescanbeusedasapromisingcatalystfortheremovalof methyl red dye. The adsorption parameters such as initial dye concentration, Adsorbent dosage, pH, contact time, and Temperature also studied. The adsorption showed that the adsorption was best fitted to the Langmuir isotherm model as compared to the Freundlich and Temkin isotherm model. The rates of sorption were best fitted the pseudo second order kinetics. Thermodynamic study showed the spontaneous and exothermic in nature of biosorption process due to negative values of free energy change and negative values of enthalpy change. It was concluding this research found that the copper oxidenanoparticleswithhighdye adsorption capacity andgood alternativeforthe removal of methyl reddye from aqueous solutionveryeffectively.
1. EnvironmentalProtectionAgency,“Nanotechnology white paper,”USEPA100/B-07/001,2007.
2. K.N.Thakkar,S.S.Mhatre,andR.Y.Parikh,“Biologicalsynthesis ofmetallicnanoparticles,” Nanomedicine, vol,no. 2, 257-2622010
3. Chen,H.;Roco,M.C.;Li,X,Lin,Y.-L.Trendsinnanotechnologypatents. Nat. Nanotechnol. 2008, 3,123-125.
4. Altikatoglu, M.; Attar, A.; Eric, F.; Cristache, C.M.; Isildak, I. Green synthesis of copper oxide nanoparticles using Ocimumbasilicumectractandtheirantibacterialactivity. Fresenius Environ. Bull. 2017, 25,7832-7837.
5. R.G.Chaudhuri,S.PariaCore/shellnanoparticles.Classesproperties,nanoparticlemechanism,characterizationand applications. Chem. Rev. 112 (4)(2012)2373-2433.
6. LeeJackson,dirtyOldLondon:TheVictorianFightAgainstFilth(2014)
7. JohnTarantino.“EnvironmentalIssues”. TheEnvironmentalBlog.Archivedfromtheoriginalon2011,12,10
8. UdibaU.U.Gauje,B.,Ashade,N.O.,Ade-Ajayi,F.A.okezieV.C.,AjiB.M.,andAgboun,T.DT.,2014.Anassessmentofthe heavy metal status of River Galma around Dakace industrial layout, Zaria, Nigeria,. Merit Research Journal Of Environmental Science and Toxicology 2(8):176-184
9. M.N.Ahmed,R.N.Ram,Removalofbasicdyefromwastewaterusingsilicaasadsorbent, Environ. Pollut., 77(1992)7985
10. W.A.Al-Amrani,P.E.LimC.E.Seng,W.S.WanNgah,Bioregenerationofazodyes-loadedmonoaminemodifiedsilicain batchsystem:Effectofparticlesizeandbiomassacclimationcondition, Chem Eng.j. 251 (20140175-182.
International Research Journal of Engineering and Technology (IRJET) e-ISSN:2395-0056 Volume: 09 Issue: 10 | Oct 2022 www.irjet.net p-ISSN:2395-0072
11. S.Mondal,Methodsofdyeremovalfromhouseeffluent-Anoverview,Environ. Eng. Sci 25 (2008)383-396
12. V, Larrechi MS, Callao MP (2007) kinetic and adsorption study of acid dye removal using activated carbon. Chemosphere 69:1151-1158.
13. GuptaVK,KumarR,NayakA,SalehTA,BarakatMA(2013)Adsorptiveremovalofdyesaqueoussolutionontocarbon nanotubes:areview. Adv Colloid Interface Sci 193-194:24-34.
14. Hassan,A.AandAbdulhussein,H.2015.MethylRedDyeRemovalfromAqueousSolutionbyAdsorptiononRiceHulls. Journal of Babylon University, 3:23
15. Mas Rosemal H. Mas Haris and Kathiresan Sathasivam (2009). The Removal of Methyl Red from Aqueous Solutions UsingBananaPseudostemFibers.
16. Laxmi,V.2014.Removalofmalachitegreendyefromwaterusingorangepeelasanadsorbent.MasterofTechnology Dissertation, National Institute of Technology,India.
17. Ferdous, J. Zainal-Abedin, Hafizur-Rahmanand M-Ali-Hossain.2014. Decolorization ofMethyl Red by Hog Plum Peel andSunfixRedbyBacterialStrains. International Journal of Chemical and Environmental Engineering. 5(1):66-68.
18. NEILSEN LF., MOE D., KIRKEBY S., GARBARSCH C. Sirius red and acid fuchsin staining mechanisms. Biotechnic Histochem., 73,71,1998.
19. ZOBIR BIN HUSSEIN M., YAHAYA AH., SHAMSUL M., SALLEH HM., YAP T., KIU J. Acid fuchsin-interleaved Mg-Allayered double hydroxide for the formation of an organic-inorganic hybrid nanocomposite. Mater. Letter, 58, 329, 2004.
20. Dash Bibek, “Competitive Adsorption of dyes (congo red, methylene blue, malachite green) on Activated Carbon”, 2011.
21. M. Q. Zhu, L. Zhu, J. J. Han, W. Wu, J.K Hurst, A.D. Li, Spiropyranbased Photochromic polymer nanoparticles with opticallyswitchableluminescence J. Am. Chem.Soc 128 (13)(2006)4303-4309.
22. K. Ulbrich, K. Hola, V. Subr, A. Bakandritsos, J. Tucek, R. Zboril, Targeted drug delivery with polymers and magnetic nanoparticles: covalent and noncovalent approaches, release control, and clinical studies, Chem Rev 116 (9) (2016) 5338-5431.
23. S. M. Dhoble, N.S. Kulkarni Investigation of in vitro and involve antifungal property of biological synthesized copper oxidenanoparticlesagainst rhizoctoniasolania phytopathogenofsoyabean(GlycinemaxL.Merrill) Int. J. Eng. Sci. 4 (5)(2018)17-30
24. V.K.GuptaApplicationoflow-costadsorbentfordyeremoval-Areview, J. Environ.Manage. 90 (2009)2313-2342.
25. A. Mittal, use of the hen feathers as potential adsorbent for the removal of a hazardous dye Brilliant Blue FCF from wastewater, J. Hazard. Mater. 128 (2006)233-239.
26. B. Acemioglu, “Adsorption of Congo red from aqueous solution onto calcium-rich fly ash.” Journal of colloid and Interface Science, vol. 274 (2),(2004)371-379.
27. A. Maleki, B. Shahmorads solar degradation of Direct Blue 71 using surface modified iron doped ZnO hybrid nanoparticles, water Sci. Water Treat 65 (2012)1923-1928.
International Research Journal of Engineering and Technology (IRJET) e-ISSN:2395-0056 Volume: 09 Issue: 10 | Oct 2022 www.irjet.net p-ISSN:2395-0072
28. V. K. Gupta, A. Mittal, L. Kirshnan, and V. Gajbe, “Adsorption kinetics and column operation for the removal and recovery of malachite green from waste water using bottom ash.” Separation and purification technology, 40 (1) (2004)87-96.
29. D. S. Kim and B. Y. Park, “Effect on the removal Pb2+ from the aqueous solution by crab shell,” Journal of Chemical technology and Biotechnology, 76 (11)(2001)1179-1184.
30. S. R. H. Ghoreishi, Chemical catalytic reaction and biological oxidation for treatment non-biodegradable textile effluents Chem. Eng. J. 95 (2003)163-169
31. Y.S.Ho,G.Mckay,SorptionofdyesandcopperionontobiosorbentprocessBiochem. 38 (2003)1047-1061.
32. K.Bhattacharyya,A.Sarma, Adsorptioncharacteristic of the dye BrilliantGreenon Neem leaf powderdyespigm. 57 (2003)211-222.
33. H.Daraei,A.Mittal,M.Noorosepehr,J.Mittal,separationofchromiumfromwatersampleusingeggshellpowderasa low-costsorbent.Kineticandthermodynamicstudies, Desalin. Water Treat. 53 (2015)214-220.
34. G. Sharma, M. Naushad, D. Pathania, A. Mittal, G. E. El-desoky, modification of Hibiscus Cannabinus fibre by graft copolymerisation:Applicationofdyeremoval, Desalin. Water Treat 54 (2015)3114-3121.
35. A. Mittal, Adsorption kinetics of removal of a toxic dye, Malachite green from wastewater by using hen feather, J. Hazard. Matter. 133 (2006)196-202.
36. J.Mittal.V.Thakur,A.Mittal,BatchremovalofhazardousazodyeBismarckBrownRusingwastematerialhenfeather. J. Ecol. Eng. 602 (2013)249-253.
37. Adowei, P., Horsfall jnr M. and Spiff A. I., 20212, “Adsorption of Methyl Red from Aqueous Solution by Activated CarbonproducedfromCassava(ManihotesculentaCranz)PeelWaste” Innovation in Science and Engineering 2,24-33.
38. Azhar,S. S,Liew A.G., Suhardy, D., Hafiz, K. F, Hatim,M. D. I., 2005, “Dye Removal from Aqueous Solution by using AdsorptiononTreatedSugarcaneBagasse”, American Journal of Applied Sciences 2 (11):1499-1503.
39. Long – Bao Shi, Pei-Fu Tang, Wei Zhang, Yan-Peng Zhao, Li-chang Zhang and Hao Zhang. Green synthesis of copper oxidenanoparticleusingcassiaauriculataleafextraxtandvitroevaluationoftheirbiocompatibilitywithrheumatoid arthritesmacrophages. Tropical Journal of Pharmaceutical Research.January2017; 16 (1):185-192
40. R Chowdhury, N. Barah and M. H. Rashid, Facile biopolymer assisted synthesis of hallow SnO2 babostructures and theirapplicationindyeremoval, ChemistrySelect, 2016, 1,4682-4689.
41. Kavitha R. Francisca P. Anxilia A. Biosynthesis characterization and antibacterial effect of plants mediated silver nanoparticlesfromAdenantheraPavoninaLeaves.JETIRFebruary2019,vol 6.(2)
42. D. Berra, S. Laouinia, B. Benhaouab, M. Ouahrania, D. Berrania and A. Rahald, “Green Synthesis of Copper Oxide nanoparticlesbyphoenixdactyliferaleavesextract”Digest Journal Nanoparticles and Biostructure.vol.13 1231-1238.
43. Maruthupandy, M., Zuo, Y., Chen, J. S., Song, J. M. Niu, H. L. Mao, C. J. Zhang, S. Y. Shen, Y. H. 2017. Synthesis of metal oxide nanoparticles ( CuO and ZnO Nps) via Biological template and their optical sensor application. Applied Surface Science, 397:167-174.
44. S.M.YedukarC.B.Maurya,P.A.Mahanwar.Abiologicalapproachforthesynthesisofcopperoxidenanoparticlesby IxoraCoccineaLeafextract. Journal of Material and Environmental Science. 8 (4)(2007)1173-1178
International Research Journal of Engineering and Technology (IRJET) e-ISSN:2395-0056 Volume: 09 Issue: 10 | Oct 2022 www.irjet.net p-ISSN:2395-0072
45. Naika,H.R.Lingaraju,K.,Manjunath,K.,kumar,D.,Nagaraju,G.,Suresh,D.,Nagabhushana,H.2015.Greensynthesisof copper oxide nanoparticles using Gloriosa superba L. extract and their antibacterial activity. Journal of Taibah university for Science, 9:7-12
46. M.D.Jayappa,C.K.Ramaiah,M.A.PavanKumar,D.Suresh,A.Prabhu,R.P.DevasyaandS.Sheik, Applied Nanoscience, 10,(2020)3057-3074.
47. M.Azami,M.Bahram,S.Nouri,Centralcompositedesignforoptimizationofremovaloftheazodye,Methylred,from wastewaterusingFentonreaction,Curr, Chem. Lett. 2 (2013)57-68.
48. 4.K.Singh,T.J.M.Sinha,S.Srivastava,Functionalizednanocrystallinecellulose:smartbiosorbentfordecontamination ofarsenic,int. J. Miner. Process. 139 (2015)51-63.
49. A. Ozcan et al., Modification of bentonite with a cationic surfactant: An adsorption study of textile dye Reactive Blue 19,J. Hazard. Mater 140(1)(2007)173-179.
50. Tam, I.A.W., A.L. Ahmad and B.H. Hameed, 2008. Adsorption of basic dye using activated carbon prepared from oil palmshell:Batchandfixedbedstudies, 225: 13-28. DOI:10.1016/J.DESAL.2007.07.005
51. 7.Langmuir,I.,1918.Theadsorptionofgasesonplanesurfacesofglass,micaandplatinum. J. Am. Chem. Soc 40: 1361-1403. DOI: 10.1021/ja02242a004
52. Ghaedi M, Nasab, AG, Khodadoust S, Rajabi M, Azizian S. 2014 application of activated carbon as adsorbents for efficient removal of methylene blue: kinetics and equilibrium study. J.Ind.Eng.Chem. 20, 2317-2324. (doi: 10.1016/j.liec.2013.10.007).
53. B.Kiran,A.Kaushik,Chromiumbindingcapacityof Lyngbya Putealis exopolysaccharides. Biochem.Eng.J 38.(2008)4754
54. Y.S.Ho,G.McKay,Sorptionofdyefromaqueoussolutionbypeat, Chem. Eng. J 70 (1998)115-124.
55. BellooS,Tan,Ts,Ahm,adMA>Adsorption of removal brilliantviolet-5R recativedyefromaqueous solution by Coca podhusk-basedactivatedcarbon.KineticEquilibriumandthermodynamicstudies. Asia Pal Journal Chem Eng.(2012) 7:378-388.