International Research Journal of Engineering and Technology (IRJET) e-ISSN: 2395-0056

Volume: 09 Issue: 10 | Oct 2022 www.irjet.net p-ISSN: 2395-0072

International Research Journal of Engineering and Technology (IRJET) e-ISSN: 2395-0056
Volume: 09 Issue: 10 | Oct 2022 www.irjet.net p-ISSN: 2395-0072
2
, G. Amba Prasad Rao31Graduate Student, Dept. of Mechanical Engineering, NIT Warangal
2Research Scholar, Dept. of Mechanical Engineering, NIT Warangal
3Professor, Dept. of Mechanical Engineering, NIT Warangal, Hanumakonda, Telangana, India ***
Abstract - In the event of combating harmful emissions and saving petroleum fuels, the importance of electrical vehicles is increasing due to the advantages of zero local emissions and respective governments’ incentives. However, going fully electric in a short period is a challenging task because of inevitable limitations. Hybrid vehicles act as a suitable linkage between conventional and pure electric vehicles. The present work aims to evaluate the harmful pollutant emissions from a hybrid electric vehicle using ADVSIOR for 3 different driving cycles viz; UDDS, NEDC and US06 and to compare the emissions of these driving cycles by varying the initial state of charge. Also, the pollutant emissions of hybrid vehicles are compared with that of the conventional vehicle of the same model. For comparison purposes, the Toyota Prius vehicle model (parallel Hybrid) was chosen. In order to predict different performance parameters i.e. Brake Power, Brake Thermal Efficiency, and Harmful emissions (HC, NOx, and CO), the help of an Artificial Neural Network with ethanol-gasoline blend type, and the ethanol blend varied from E0 to E20. The final developed ANN model delivered the best correlation coefficient ranging from 0.96567 to 0.99989 for all the performance parameters and exhaust emissions. The mean square errors and the correlation coefficients for different performance parameters were calculated.
Key Words: Emissions, Hybrid vehicle, ADVISOR, Driving cycle, Ethanol-gasoline blend, Artificial Neural Networks
Thefossilfuelautomobileshavebeenservingthecommunityinlight,mediumandheavydutyapplicationsforoveroneand halfacentury.Theautomotiveindustryhasalsogivenaprovisionforotherindustriestogrow.However,duetoitslargescale use,ithasledtothedifficultyofunevensupplyofpetroleumfuelsandmoreimportantlyairpollutionrelatedissues.Many partsofmajorcitiesintheworldareinthegrabofhighlevelsofairpollutionmostlyfrompassengervehicles. Thesoleaimis tominimizethenegativeimpactonthenature.Effortshavebeenmadetoovercomethedifficultieswithconventionalvehicles byusingalternativefuelseitherinneatorblendedformandexhaustgasaftertreatmentdevices.However,duetostringent emissionnormsofEUROorBSVI,itisbecomingimminenttoswitchovertoelectricmobilityinaphasedmanner.Asasolution tothesecomplexissuesnowfocusisbeinglaidonelectricvehicles.Butaquicktransitiontopurebatteryelectricvehiclesfrom conventionalinternalcombustionenginedrivenvehiclesseemsdifficulttobefeasibleowingtomanyconstraints.Thekey constraintsincludepoorinfrastructureandavailabilityofchargingstationservicewheretheEVsareoperated.Also,therange anxiety is a major concern too which dissuades many customers from swaying away from using EVs. As the automotive industryoftheentireglobeisinatransitionphasei.e.wearemovingfromconventionalvehiclestopure batteryelectric vehicles.Hence,inordertomakethetransitionsmootheraHybridvehiclemayactasasuitablelinkagetoactasasuitable mediumoftransport.Hybridelectricvehiclesasthedefinitionabovesuggests,ahybridvehicleissimplytheonethatrelieson two different power sources for undergoing motion. The two different power sources are basically gasoline and energy storagesforelectricity.
ThemajorcomponentsofHEVincludesElectricmotor,Internalcombustionengine,Batterypack,converter,controlboardand gasoline/dieselfueltank.Allthesekeycomponentsofhybridelectricvehiclescanbebroadlyclassifiedintothreecategories. Theyare:
1.Drivetrain 2.Energystoragesystem 3.Controlsystem
International Research Journal of Engineering and Technology (IRJET) e-ISSN: 2395-0056
Volume: 09 Issue: 10 | Oct 2022 www.irjet.net p-ISSN: 2395-0072
DrivetrainhelpstocombinethepowersourceofICEandelectricaldriveinaphysicalmanner.Theenergystoragesystem prioritizestheenergystorageandpowercapacitieswhethertheyarelargeorsmall.Thecontrolsystem,asthenamesuggests, controlsandmanagestheICE,electricalsystemandenergystoragesystemofhybridvehicles.
1. Traction motor-Initssimpleform,anelectricmotor aidsthevehiclewheeltomovebysupplyingpowerfromthetraction batterypack.Insomevehiclesmotorgeneratorsareemployedtoperformboththedriveandregenerationduties.
2. Internal Combustion Engine (spark-ignited): Inthiscomponent,thefuelusedisgasolinewhichispumpedintoeitherthe intakemanifoldorthecombustionchamber,whereitgetsmixedwithairandignitedwiththehelpofasparkplug.
3. Battery Pack or Stack-Thebatterypackorstackhasthefunctiontostoreelectricitywhichistobeconsumedbytheelectric tractionmotor.Thebatteryembeddedinthetractionbatterypack,helpstoprovideelectricitytostartthevehiclebeforethe engagementofthetractionbatterypack.Addingtothat,theauxiliarybatteryalsoprovidespowertovehicleaccessoriesfor theiroperation
4. Converter- Theconversionofhigher-voltageDCpowerfromthetractionbatterypacktothelower-voltageDCpoweris takenplacewiththehelpofaconverter.TheconvertedlowerDCvoltageisutilizedbythevehicleaccessoriestodrivethemand forrechargingpurposeofthebatterypack
5. Electric Generator: Thisisimplementedtoservethepurposeofregenerativebraking. Whilebraking,themovingwheels generateelectricity,whichisthentransferredtothetractionbatterypack.
6. Gasoline or Fuel Tank-Thistankisusedtostoregasolineandremainspreservedtilltheengineneedsit.
Therearefourtypesofhybridvehiclebasedontheir degree of hybridization values.
i. A Micro hybrid possessesa degree ofhybridization valuewhichliesbelow5%. The embeddedelectricmotorhasthe functionofstartingandstoppingthevehicle.Addingto thatthevehiclehastheabilitytostoptheengineinanimpulsive mannertoo.Mildhybridswouldnotprovidewithanyextratorquebytheelectricallypoweredmotor.
Example:BMW1series,FortwoMercedes
ii.A full hybrid canrunonjustthecombustionengine(i.e.diesel/petrol),theelectricsource(i.e.powerfrombatteries),ora combinationofboththepowersources.FHEVsarethemostfuelefficienttypeofhybridvehicle.Theyarealsocapableof operatingin series mode, parallel mode or all-electric mode.Theall-electricmodeasitexplainsitselfandisusedtorunthe FHEVsatalowvehiclespeed.Seriesmodealsomakesuseoftheelectricmotortodrivethewheelsbuttheinternalcombustion engineisusedatthesametimeasanon-boardgenerator.Parallelmodeutilizesboththeinternalcombustionengineandthe electricmotortogethertodrivethewheels.
Example:FordFusionHybrid,ToyotaPrius.
iii.A mild hybrid consistsofelectricmotorandInternalcombustionenginewhichalwaysworktogethertopropelthevehicle. Amildhybridislimitedtoparallelmodesocanreallybelookeduponashavingabatteryandahelpermotor.
Example: FerrariLaFerrari,ChevroletMalibu.
iv. A plug-in hybrid,asthenamesuggests,itdoesrequirepluggingactionintothemainstogetitsbatteryfullyrecharged. PHEVscanruninjustelectricmode.ThesehybridsuseallthetechnologiesofaFHEVbutpossessarelativelylargercapacity batterywhichcanbepluggedintothemainsforchargingpurpose.Thekeyadvantageofplug-inhybridvehiclesisthattheir rangeinallelectricmodesishigherthanthatofanaverageFHEV.
Example:BMWi8,KiaOptima,PorscheCayenneS
value:
International Research Journal of Engineering and Technology (IRJET) e-ISSN: 2395-0056
Volume: 09 Issue: 10 | Oct 2022 www.irjet.net p-ISSN: 2395-0072
Therealgoalofahybridvehicleistoutilizetheelectricportionofthedrive-trainasmuchasitcanwithoutcompromisingon itsperformance.Thisbasicallyaimstocutdowntheharmfulemissionsandimprovethefuelefficiency.Thisisbecausethe electricmotorisrelativelymoreefficientascomparedtoaninternalcombustionengineandproduceszeroemissionslocally.In ordertopowertheelectricportionofahybridengine,ahybridvehiclehastocarryabatterypack.Inthebatterypack,thesize ofthe batteryvariesdependingonthe degreetowhichthevehicle isdesignedto relyonit,andthe waythe batterygets recharged.Thehybridvehiclesalsocanbeclassifiedonthebasisoftheirdegreeofhybridizationvalue. Table-1.1shownbelowdepictsthesummaryofclassificationofhybridvehiclesdependingonthevaluesoftheirdegreeof hybridization(DoH).
Table 1.1-classification of hybrid vehicles based on DoH.
Type DoH
Micro <5% Mild Upto10%
FullHybrid: Parallel Series 10%to50% 50%to75%
Basedonvehiclearchitecturethehybridvehiclesareof3types.Theseare:
1. Parallelhybrid
2. Serieshybrid
3. Series-Parallelhybrid
Sincethechosenvehicleconfigurationisaparalleltypehybrid-ToyotaPrius,descriptionofparallelhybridisonlypresented here.
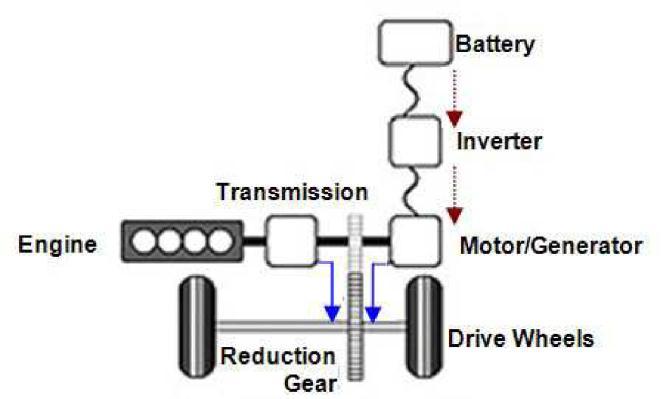
Aparallelhybridpossessestheflexibilityofusingmorethanonepowersourcetodeliverthepropulsivepowertothewheels. HereboththeICengineandelectricmotorareconfiguredinparallelwithasuitablemechanicalcouplingthatutilizesthe torquecomingfromboththesources.Thisvehiclerequireslessmotorpowerascomparedtoserieshybridandelectricvehicles astheICenginewhichisconnectedinparallelwithitcontributestothetotalpowerdemandedbythevehicle.Fig.1.1illustrates thedetailedmechanicalandelectricalconnectionbetweenthemajorcomponentsoftheparallelhybridconfiguration.
Figure 1.1- Configuration of parallel hybrid vehicle (4)
International Research Journal of Engineering and Technology (IRJET) e-ISSN: 2395-0056
Forevaluationofvehicleperformanceandemissionsinalaboratory,achassisdynamometerisusedandthevehicleisallowed torunsimulatingnormalroadandloadconditions. Drivingcyclerepresentsaseriesofdatapointswhichshowthevariationof speedversustime.
Fordifferentcountriesandorganizations,variousdrivingcyclesareimplementedtoassesstheperformanceofastandard vehiclemodel.Forexample,itcanbeusedtoassessthefuelconsumption,vehicleemissions,accelerationandgradeabilitytest.
Inaddition,drivingcyclesarealsoutilizedinpropulsionsystemsimulationstopredicttheperformanceofinternalcombustion engines(petrolanddieseltype),electricvehicle,hybridelectricvehicle,fuelcellelectricvehicleetc.
Drivingcyclesaredividedintotwocategories.Theyare:
In transient driving cycle, the continual speed variations typical of on-road driving which include several alterations are representedwhereas,longdurationsofcontinuousspeedareinvolvedinmodaldrivingcycles.
The"Drive-cycle"isessentiallyarepresentationoftheroadwheretheconcernedvehicleisoperated.Drivecyclesareusedto reducethecostofon-roadtests,testtime,andtestengineerfatigue.Theentireconceptistobringtheroadtothetestlab(a chassisdynamo-meter)ortoacomputersimulation.
Therearetwotypesofdrivingcyclesthatcanbecreated.Oneistimedependent,whereastheotherisdistancedependent (speed versus distance versus altitude) (speed versus time versus gear shift). The time dependent is a compressed representation of the actual time taken to conduct the test on the road, whereas the distance dependent is an exact reproductionofthetestroute.TheEuropeanNEDCcycleandFTP-75areexamplesoftimedependentdrivingcycles.Time dependentdrivingcyclesareutilizedspecificallyforchassisdynamometertestingsincetheresultsmaybeobtainedinashort amountoftimeandrepeatedtestsaresimple.
ThepopulardrivingcyclesareUDDS,NEDCandUS06.
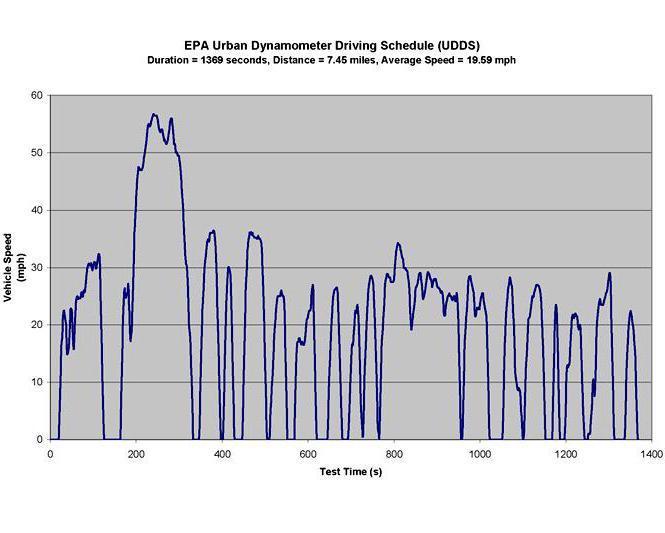
UDDSisanacronymforUrbanDynamometerDrivingScheduleanditreferstodynamometertestonfueleconomymandated bytheUSEnvironmentalProtectionAgencythatsimulatescitydrivingconditionsonly.It’sshowninFig.1.2.
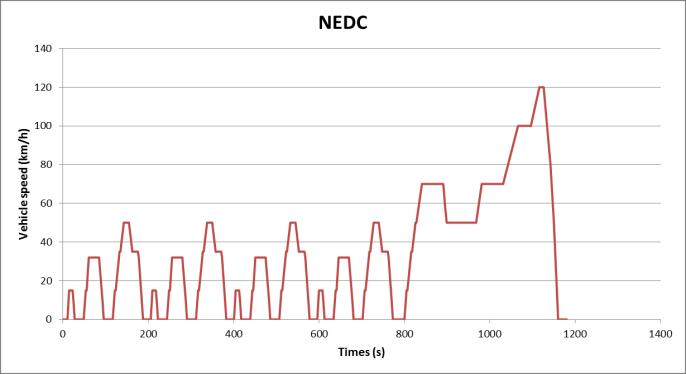
NEDCisanacronymfornewEuropeandrivingcyclewhichisdevelopedtoevaluateautomotiveengineemissionsandfuel economyinpassengercars(whichexcludeslighttrucksandcommercialvehicles).It'salsoknownastheMVEGcycle(Motor VehicleEmissionsGroup).Initiallyitwasdesignedtopredicttheperformanceofgasolinebasedenginesbutnowit’swidely usedtoestimatetheelectricpowerconsumptionandrangeofhybridandbatteryelectricvehicles,asrepresentedinFig.1.3
Volume: 09 Issue: 10 | Oct 2022 www.irjet.net p-ISSN: 2395-0072 © 2022, IRJET | Impact Factor value: 7.529 | ISO 9001:2008 Certified Journal | Page855
International Research Journal of Engineering and Technology (IRJET) e-ISSN: 2395-0056
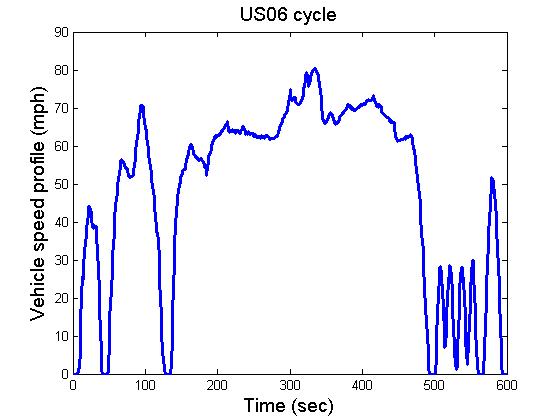
TheUS06SupplementalFederalTestProcedure(SFTP)wasdevelopedtosolvetheFTP-75testcycle'slimitationsinorderto representanaggressive,high-speed,and/orhigh-accelerationdrivingbehavior,fastspeedfluctuations,anddrivingbehavior afterstarting,showninFig.1.4
1.5.1 Degree of Hybridization (DOH)-Theratioofpowerdevelopedbyanelectricmotorinahybridvehicletothetotalpower developedbytwosourcesofthevehicleisknownasdegreeofhybridization. Heretotalpowerreferstothesumofthecontributionofpowerfromthemotorandtheinternalcombustionengine.
Mathematically,DoH=MotorPower/(MotorPower+EnginePower)
ForconventionalvehicleMotorpower=0hence,theDoHforaconventionalvehicle=0
ForapureElectricvehiclethereisnocontributionofpowerfromengine,hencetheDoHforapureelectricvehicle=1 Forahybridelectricvehicle,ithasbothelectricmotorandICengine,so DoHofhybridvehicleliesinbetween0and1
1.5.2. State of Charge (SOC)-TheSOCofthebatterymaybedefinedastheratioofthecurrentremainingbatterycapacitytothe availablecapacityundercertainoperatingconditionsi.e.temperature,chargeanddischargeratio,etc.
Mathematically,SOC=(Qc/Q)*100
WhereQc=Residualchargeofthebatteryatthemomentofcalculation Stateofcharge(SOC)atanyinstant,
Volume: 09 Issue: 10 | Oct 2022 www.irjet.net p-ISSN: 2395-0072 © 2022, IRJET | Impact Factor value: 7.529 | ISO 9001:2008 Certified Journal
International Research Journal of Engineering and Technology (IRJET) e-ISSN: 2395-0056
SOC(t+1)=SOC(t)where,SOC(t)representsthestateofchargeattsecondsand i representstheelectriccurrentatthatinstant Qrepresentsthe maximumchargestoringcapacityofthebattery.
Itmeasures error between two data sets.Itcomparesapredictedvalueandanobservedorknownvalue.Thesmalleran RMSEvalue,thecloserpredictedandobservedvaluesare.Rootmeansquareerrortakesthedifferencebetweeneachobserved andpredictedvalue.
Mathematically,itcanbewrittenas, RMSE
Pi= Predictedvalue, Oi=Observedvalueandn=no.ofsamples
1.5.4.
Correlationcoefficientisameasureofthestrengthoflinearrelationshipexistingbetweentwovariables.Whenthevalueof linearcorrelationcoefficientisgreaterthanzero,thenitindicatesapositiverelationship.Butwhenthecorrelationcoefficientis lessthanzero,itindicatesanegativerelationship.Ifthecorrelationcoefficientiszerothenitindicatesnorelationbetweenthe two variables which are compared. In case of less error between the predicted and observed experimental values, the correlationcoefficientliescloserto1.
Inordertoarriveatthescopeandobjectivesforthepresentwork,literaturereviewhasbeendone. Adynamicdynamicmodelwas simulatedinADVISORofasplitpluginhybridelectricvehicle whichincludedadetailed representationofahybridelectricvehicle.Basedonthesimulation,theyproposedavehiclecontroller.Withtheuseofthe proposedcontrolleritwasshownthatworkingindifferentmodesofoperation,theenginewasoperatedinhighefficientareas oftheefficiencymapwhichindicatedarelativelyhigherefficiencyascomparedtotheconventionaldrive-trainconfiguration [5].Bhatikaretal[2000]proposedamodelfortheenergystoragesystemofahybridelectricvehicleusingArtificialNeural Network. The ANN model dealt with regression analysis to calculate the Mean square error. They also demonstrated the effectivenessofsmartselectiontechniquestodesignthetrainingdataforanANNmodel.
Markeletal[2002] gaveadetailedintroductiontoADVISORsoftwarewhichwasdevelopedbytheNationalRenewableEnergy LaboratoryoftheUSA.AddingtothatitwasbrieflydescribedhowADVISORprovidesthevehicleengineeringcommunitywith aneasy-to-useandflexible,yetrobustandsupportedanalysispackageforadvancedvehiclemodeling.Andrewetal[2004] proposedamodeltocombinethebatteryinparallelwithanultracapacitor.Theyobservedthatthestorageandpeakcurrent characteristicscouldbeachievedwithoutdegradingthestandardsofthevehicle.MariamKhanetal[2009]describedthe drawbacksofconventionalvehiclesandtheharmfulimpactresultingfromemissions.TheyobservedthatHEVswouldreduce theharmfulemissionslikeCO,HC,NOxanddemonstratedthegrowingneedforsustainabletransportationandtheroleofHEVs asapossiblesolution.
KianiDehKianietal[2009]focusedonpredictingtheperformanceparameterslikebrakepower,brakethermalefficiency, brakespecificfuelconsumptionandemissions-HC,NOx,COandParticulateMatter.TheimplementedANNmodelandutilized ethanolgasolineblendfuelandloadattheinputlayer.TheoHofmanetalanalyzedthedrivetrainconfigurationsofToyota Prius.TheoverallgoaloftheresearchwastofindtheminimalspecificationsforthePrimarypowersource,Secondarypower source,andTransmissiontechnologyinordertoachieveapredeterminedfueleconomyandperformancewhilekeepingcost andlifetimelimitsintoaccount.
Duarte et al [2013]carried out work onthe effect of battery StateofCharge on fuel consumptionandgaseous pollutant emissionsinacompleteHybridElectricVehicle.TheyusedVehicleSpecificPower(VSP)methodsandaportablelaboratoryto characterizethevehicle'senergyandenvironmentalfootprintbasedonitspowerdemand.On-roadenergyandpollutantmass emission rates according to VSP mode were coupled with NEDC VSP time distribution, allowing certification data to be
Volume: 09 Issue: 10 | Oct 2022 www.irjet.net p-ISSN: 2395-0072 © 2022, IRJET | Impact Factor value: 7.529 | ISO 9001:2008 Certified Journal | Page857
International Research Journal of Engineering and Technology (IRJET) e-ISSN: 2395-0056
Volume: 09 Issue: 10 | Oct 2022 www.irjet.net p-ISSN: 2395-0072
comparedtoacquiredataunderreal-worldoperation.ImdatTaymazetal[2014]focusedontheimportanceofhybridvehicles andhowitcouldplayamajorroleinthefuturebyreducingtheemissionsalongwithagreaterfueleconomy.Theycalculated theemissionsofastandardhybridvehiclemodelindifferentmodesofoperation-normaldrivingmode,accelerationmode, decelerationmodeandchargingmode.Apartfromthattheydeterminedfuelconsumptionofavehiclethroughsimulation methodsindifferentdrivingcyclestocomparetheperformanceofavehicle.
Hannanetal[2014],emphasizedtheimportanceofenergymanagementtechniqueswhichweredepictedalongwithrenewable energytechnologyasapotentialsolutiontoenvironmentalpollution.Apartfromthatthey elaboratedtheclassificationof hybridelectricvehiclesonthebasisoftheirdegreeofhybridizationvalues.
ZouYuanetal[2014]proposedamodelthatcanbeusedtooptimizethecontroldevelopmentofapowersplithybridvehicle. In order to get the benefits of series and parallel hybrid vehicles, they proposed use of a power-split planetary gear arrangementinhybridvehiclemodels.Theyconductedatrade-offstudybetweenfueleconomyandemissionsandtheresults werecomparedwiththesimulationresultsoftheADVISOR.
Pandayetal[2015]explainedhowthevariationoftemperatureaffectsthebattery'scurrent,voltage,andstateofcharge(SOC), whichinturnaffectstheengine'son/offtransition.Theeffectoftemperaturewasstudiedinordertolimittheoperational rangeofthevehicletooptimizefuelefficiencyandhavealongerbatterylife.
SrinathPaietal[2016]developedanANNmodeltopredicttheemissionsofNOx,HCforadieselengine.Usingthepredicted modelperformanceparameterslikecorrelationcoefficients,meansquareerrorwerecalculatedandcomparativeanalysiswas madeinagraphicalformbetweenthepredictedandactualvalues.Itwasalsoshownthatowingtoitssimplicityandflexibility, ANNcouldbesuccessfullyimplementedtopredicttheparameterswithdesiredaccuracyinlessertime.
Jianfeietal[2016]demonstratedtheadvantagesofusingapower-splitplug-inhybridelectricvehiclewhichbasicallytakesthe advantagesofbothseriesandparallelcombinationofvehicles.Theyperformedasimulationregardingtheenergymanagement strategyofpowersplithybridvehicles.Onthebasisofsimulationresults, theyshowedthemaximumpoweroftheengine correspondingtothemostfueleconomicalareaanditsdependencyonvelocityvariation.
DibakorBoruahetal[2016] triedtoquantifytheutilityofanartificialneuralnetworkasablack-boxmodelforinternal combustionengineperformance.Asaresult,anartificialneuralnetwork(ANN)-basedmodelforafour-cylinder,four-stroke internalcombustiondieselenginehasbeenbuiltusingparticularinputandoutputvariablesbasedonsomeexperimentaldata for various load and engine speed conditions. They calculated the RMSE and correlation coefficient and explained the importanceofANNtoolinpredictingcertainoutputswithgreateraccuracy.
Ojas[2017]presentedtheclassificationofhybridelectricvehiclesonthebasisofparametersviz;degreeofhybridizationand thevehiclearchitecturaldesign.Theauthorclassifiedthehybridvehicleinto4typeslikemicro,mild,fullyandplug-inhybrids dependingontheirdegreeofhybridizationvalues.Similarlyonthebasisofvehiclearchitecturethevehicleswereclassifiedas hybridvehiclesintoparallel,seriesandseries-parallelhybrids.
AnANNmodeldevelopedbySametUsluetal[2018]topredicttheparameterslikeexhaustgastemperature,brakethermal efficiency,NOx,CO,HCandsmoke.Experimentaldatashowedthattheadditionofdiethylethertodieselfuelsincreasesbrake thermal efficiency and brake specific fuel consumption but on the contrary if the engine performance was considered it reducedtheexhaustgastemperature.SignificantreductioninCO,NOx,HCandsmokeemissionconcentrationswereseenwith theuseofDiethylEther-dieselfuelblends.
Thakuretal[2018]envisagedamodelusingANNtopredicttheperformanceparameterslikebrakepower,brakethermal efficiency,brakespecificfuelconsumptionandemissionslikeHC,NOx,CO.TheimplementedANNmodelandutilizedethanolgasolineblendfuelandloadattheinputlayer.UsingANNasatoolinMATLAB,theycalculatedcorrelationcoefficientsandroot meansquareerror.Singhetal[2019]laidimportanceonhybridvehicleswhichhasprogressedfromitsinfancytobecomea possibleanswertotheplanet'smajorexistentialcrisis.Thepaperextensivelydescribeddifferentcomponentsofastandard hybridvehicleandhowHEVswouldcombinethepropulsioncapabilitiesofaninternalcombustionengineandanelectric motor.
JanDizoetal[2021]madeastudyabouttheimportanceofplug-inhybridandelectricvehiclesandthekeyareaswherethey couldserve better thanthe conventional vehicle. They emphasized ontheavailabilityofa sufficient number of charging stationsandinfrastructuralgrowthsothatthefutureofhybridandelectriccarswouldbeviable.
International Research Journal of Engineering and Technology (IRJET) e-ISSN: 2395-0056
Volume: 09 Issue: 10 | Oct 2022 www.irjet.net p-ISSN: 2395-0072
Anh Tuan Hoang et al [2021] emphasized on the ANN model which would help to optimize the engine performance and emissioncharacteristicsfueledwithbiodiesel-basedfuels.Attheinputlayerstheparameterslikeload,cetanenumber,density andspeedweretakentopredicttheoutputparameterslikebrakethermalefficiency,brakespecificfuelconsumptionand emissionparameterslikeCO,HC,NOxandsmoke.
Fromtheaboveliteraturereview,thefollowingpointswerenoted:
• TheinitialStateofchargeanddrivingcycleshaveaprofoundimpactontheemissionsofahybridvehiclemodelwhich requiressomeadditionalresearchforcomparativestudy.
• There is a scope of evaluation of emissions for a parallel hybrid and conventional vehicles to compare their performanceforaparticularstandarddrivingcycle.
• Implementation of some tools like ANN can be a handy approach in the automotive industry to predict the performanceofavehicletoarrivereasonablyaccurateandsimplewithoutinvolvingexpensiveexperimentalsetup.
1. ToevaluatetheemissioncharacteristicsofahybridvehicleusingADVISORsoftwarefordifferentdrivingcycles.
2. TocomparetheemissionsofHybridelectricvehicleswithConventionalvehicleswithgasoline-ethanolblendsasfuel.
3. TopredicttheperformanceofahybridvehicleusingArtificialNeuralNetwork.
Thepresentworkdealswithasimulationprocessfortheperformanceandemissionsevaluationofhybridelectric using ADVISOR software-ADvanced VehIcle Simulator developed at the National Renewable Energy Laboratory(NREL),USA.Thesoftware possessesthecapabilityto simulatedifferentkindsofvehiclesi.e.conventional, electric,orhybridvehicles(series,parallel,orfuelcell).ADVISORsoftwareservesasthebackboneforthedetailed simulationandanalysisofadefiniteuserdefineddrivetraincomponents,astartingpointofverifiedvehicledataand algorithms from which it takes the full advantage of the modeling flexibility of SIMULINK and analytic power of MATLAB.Itcanbeusedforpredictingthe fueleconomy,accelerationperformance gradesustainabilityandemission evaluation.Inordertoevaluatetheemissionsofahybridvehiclemodelthissoftwaredemandscertaininputvariables whichplayanessentialroletoevaluatetheharmfulpollutants.
Followingstepsareinvolvedin thesoftwaretoevaluate theemissionsofahybridelectric vehicle.ADVISORworks ontheMATLAB/SIMULINKbased environment. SIMULINKcanbeusedtographically represent complex systems using block diagrams, while MATLAB provides the flexibility of an easy-to-use matrix-based programming environment for executingcalculations.Thelinks betweenvarious componentsaregraphicallyportrayedintheADVISORcarmodelusing SIMULINK block diagrams. During the simulation, the model reads the input data from the MATLAB workspace, and the resultsaredisplayedintheresultswindow.
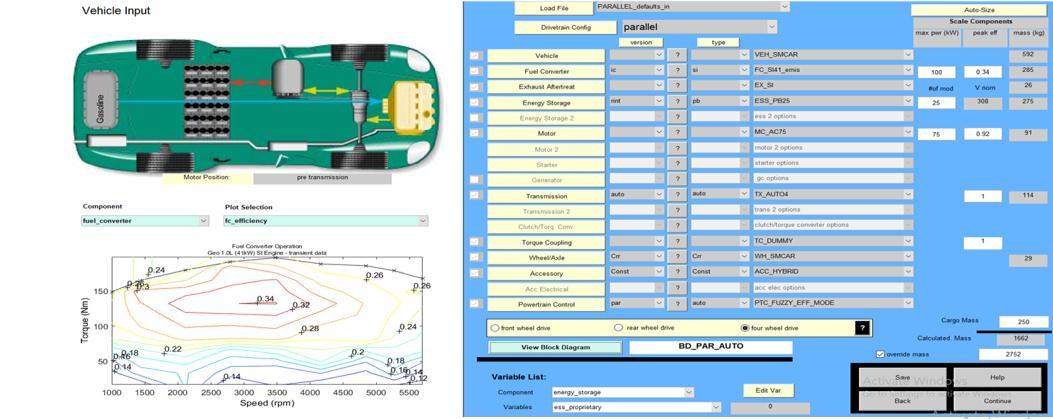
• ADVISORprovidestheflexibilitytotheusertoselectthecaratone’sinterestintheADVISORvehicleinputwindow,as showninFig.3.1.Thevariouspull-downchoicesareusedtoselectacertainvehicleconfiguration,whichcanbea conventionalvehicle,apureelectricvehicle,orahybridvehiclewithaseries/parallelconfiguration.
• Thecharacteristicperformancemapsforthevariouscomponentsarepresentedinthelowerleftofthewindowand canbeaccessedusingthepull-downmenu.
• Inthisworkthesimulatedvehicleconfigurationhasparallelhybridconfiguration,henceparallelhybridconfiguration ischosenattheinputwindow.
International Research Journal of Engineering and Technology (IRJET) e-ISSN: 2395-0056
Volume: 09 Issue: 10 | Oct 2022 www.irjet.net p-ISSN: 2395-0072
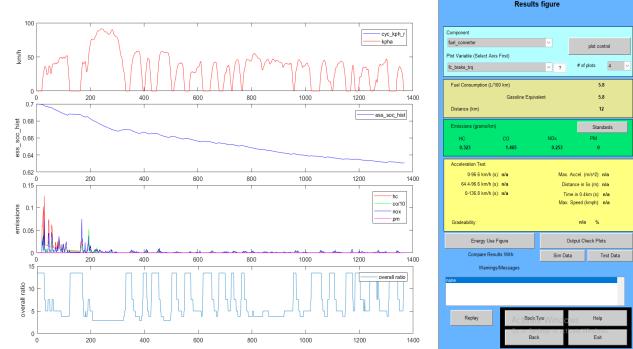
● To guide the user through the simulation process, ADVISOR employs three key graphical user interface (GUI) windows.TheGUIsallowtheusertoexaminetheeffectsofvehiclespecificationsanddrivingcyclerequirementson vehicleperformance,emissionsandfueleconomyinaniterativemanner.Thegraphicaluserinterfaces(GUIs)makeit easiertodealwiththerawinputandoutputdatain theMATLABworkspace.Todefinetheconnectionsbetween variouscomponents,thevehiclemodelisgraphicallyshownusingSIMULINKblockdiagrams.Duringthesimulation, themodelreadstheinputdatafromtheMATLABworkspaceandoutputstheresultstotheworkspace,whichmaybe examinedintheresultswindow.
● TheuserdefinestheeventoverwhichthecarwillbemodeledintheADVISORsimulationsetupwindow(Fig.3.2).The followingaresomeoftheoccurrencesthatcouldbesimulated:Asingledrivecycle,severalcycles,anduniquetesting techniquesareallavailable.Theupperrightcorneroftheset-upwindowgivestheopportunitytochoosedifferent drivingcyclesasperdesireoftheuserwhichtheusercanagainseeintheright-handcornerofthewindow.Inthe simulationmode,itallowstheusertoselectcyclesanddefinesimulationparametersinformationabouttheselected cycleswhicharepresentedintheleftportion.

International Research Journal of Engineering and Technology (IRJET) e-ISSN: 2395-0056
Volume: 09 Issue: 10 | Oct 2022 www.irjet.net p-ISSN: 2395-0072
Fig.3.4illustratesthecompleteblockdiagramofahybridvehiclewhichisdevelopedintheMATLAB/SIMULINK environment. Thisdiagramextensivelydescribeseachandeverycomponentofthevehicle.
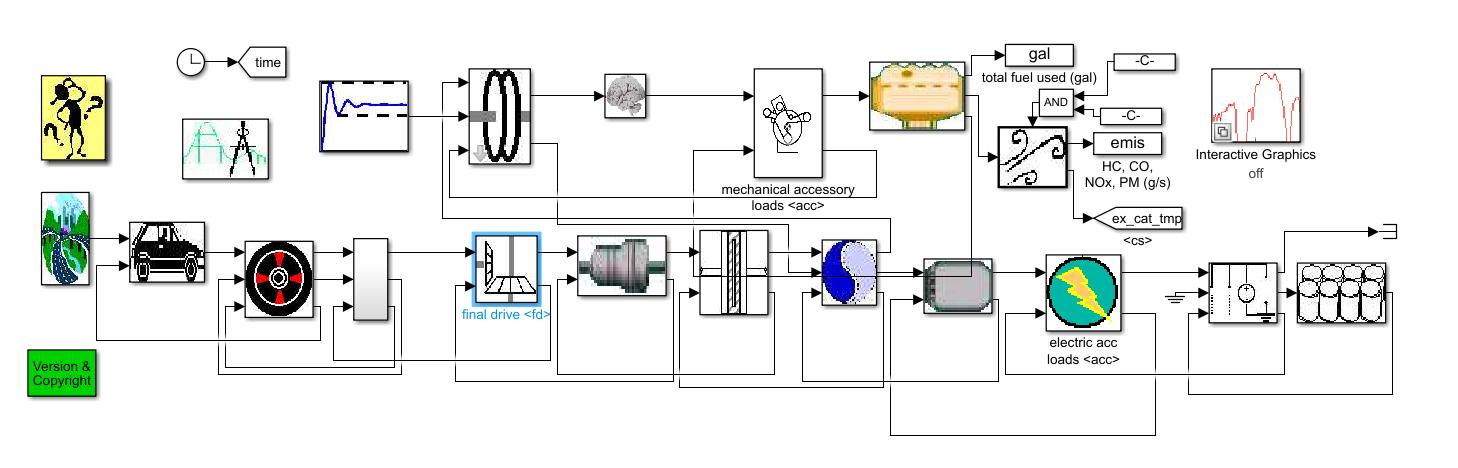
• ForaHybridelectricvehicle, Fuelconverter,Motorcontroller,Torquecoupling,Energystorage,Vehicle,Powertrain control,Exhaustaftertreat,Accessories etc.aretheinputvariablesforinitiatingsimulation.
• Foraconventionalvehicle,attheinput,thenumericalvaluesofdifferentvariablesunderfuelconverter,power-train, Vehicle,Wheelaxle,Trans-mission,Accessories,Exhaustafter-treatmentetc.aretobeentered.Afterenteringthe desiredinputvariablesthenweproceedtosimulationbyclickingonrunandtheresultsofsimulationareshowninthe outputscreen.Similarly,theADVISORoutputscreengivesusresultsbasedonvehiclearchitectureselectedandthe testparametersthatweprovidesuchasdrivecycle,exhaustemissioncharacteristics.
• In order to proceed to simulation some essential numerical data are required by the ADVISOR software. These numericaldataplayavitalroleindeterminingtheemissionparameterslikeHC,CO,NOxandPMofastandardvehicle model.
• Table3.1describesthenumericaldatademandedbyADVISORtoproceedtowardssimulation. Table 3.1- Input parameters for hybrid vehicle (Toyota Prius)
International Research Journal of Engineering and Technology (IRJET) e-ISSN: 2395-0056
Volume: 09 Issue: 10 | Oct 2022 www.irjet.net p-ISSN: 2395-0072
13 No.ofcylinders 4in-line 14 Kerbweight(kg) 1380 15 Noofbatterymodules 28 16 Batterycapacity(kWh) 1.31
17 BatteryNominalvoltage(V) 201.6
18 Batterycapacity(Ah) 6.5
• It’sreallytimeconsumingandcostlytotestanautomotivevehicleengineunderdifferentoperatingconditionsand withavarietyoffuels.Inthisregard, ANNhelpstomodeltheperformanceandexhaustemissionsofanenginewitha goodaccuracy.
• TopredictafewperformancecharacteristicsofHEV suchasbrakepower,brakethermalefficiency,andpollutant emissions (HC, CO, NOx) which are essentially the ANN model's output in this paper. At the input the provided parameters are Speed, Ethanol blend, Gasoline flow rate and Load. The number of hidden layers in each case of simulationis20.
• MATLABhasaprovisiontouseANNasatool.InANNmodelthereare3differentlayers.Theyarebasicallyinputlayer, outputlayerandhiddenlayer.
⮚ Inputlayer-Thislayerhasthesamenumberofneuronsasthenumberofinputstoneuralnetwork.Thislayer ismadeupofpassivenodes,whichdonotparticipateinsignalmodificationbutjustpassthesignalontothe nextlayer
⮚ Hiddenlayer-Thislayerhasanarbitrarynumberoflayers,eachwithanarbitrarynumberofneurons.
⮚ Outputlayer-Thislayer'snodesareactivebecausetheyparticipateinsignalmodification.Thenumberof neuronsintheoutputlayeristhesameasthenumberofoutputvaluesintheneuralnetwork.This layer containsonlyactivenodes.
ThefollowingstepsareinvolvedinANNmodelinginMATLAB.
Step-1:NeuralLayerfitting
Step-2:Dataselection
Step-3:Conversionfromcolumnmatrixtorowmatrix
Step-4:Divisionofdataintotraining,testandvalidation
Step-5:Selectionofhiddenlayers
Step-6:Selectionofalgorithm
ThestepsinvolvetheFittingofdifferentlayersofANN.Inthisstep,thearchitectureofANNisdepictedwhichincludesinput, hiddenlayer,outputlayerandoutput.Thisneurallayerfittinghelpstoselectdata,createandtrainanetworkandtoevaluate the performance by calculating mean square error and regression analysis. This step includes the input and output data selectioninformacolumnmatrix
Astheselecteddata(inputandtarget)areinformofacolumnmatrix,thisstephelpstoconvertthecolumnmatrixtorow matrixsothatthedatasetcanbetrainedinthenextstep.
Theselecteddataaredividedinto3training,testingandvalidationandtherespectiveweightpercentagesare70%,15%and 15%.Thisindicatesthedivisionoftotalnoofsamplesintotraining,validationandtesting.Thetotalnoofsamplesselectedfor
2022, IRJET | Impact Factor value: 7.529 | ISO 9001:2008 Certified Journal | Page862
International Research Journal of Engineering and Technology (IRJET) e-ISSN: 2395-0056
Volume: 09 Issue: 10 | Oct 2022 www.irjet.net p-ISSN: 2395-0072
training,validationandtestingare211,45and45respectively.Thenumberofhiddenlayerschosenis20foreachperformance parameter.
Thealgorithmusedinthisstepis Levenberg-Marquardt.Afterselectionofalgorithmsthenetworkistrainedtoproceed towardssimulation.Thisyieldsthemeansquareerroraswellasthecorrelationcoefficientafteracertainnoofiteration.
1.Thisalgorithmisbasicallyusedinthecaseswhenthereexistsanon-linearrelationbetweeninputsandoutputs.
2.It'sabackpropagationalgorithmwhichisusedinanartificialneuralnetworktopredicttheresultsbasedontheinputdata setprovidedtoit.
3.ThisAlgorithmisatechniquewhichisiterativeinnatureandithelpstolocatetheminimumofamultivariatefunctionthat canbeexpressedasthesumofsquaresofnon-linearreal-valuedfunctions.
4.Inthiscasetheusedinputvariablesi.e.load,speed,gasolineblend,fuelflowrateandtheseareusedinthealgorithm to predicttheoutputvariablesi.e.theperformanceparameterswhichareBrakepower,BrakeThermalEfficiency,Pollutants missions-HC,NOxandCO.
5.TheANNmodelutilizesthisalgorithmtopredicttheperformancesothattheerrorscanbecalculated.Basically2kindsof parametersarecalculatedhere.Theyare RMSE (Rootmeansquareerror)and R (Correlationcoefficient)
Properties of gasoline and ethanol (13).
Table- 4.1- properties of Gasoline and Ethanol
Fuelproperty Fuel Gasoline Ethanol
Molecular formula C4-C12 C2H5OH
Molecular weight 100-105 grams/mole 46.07grams/mole
Densityat20 740kg/m3 790kg/m3
Lower heating value 45.26MJ/kg 25.12MJ/kg
Specificheat 1.99kJ/kgK 2.38kJ/kgK
The standard urban dynamometer schedule test driving cycle test mode was chosen for a time period of 6000 seconds (approximately 100 minutes). The plot helps to find the value of any harmful pollutant at any instant of time during the operationofahybridvehicle.
Theconventionalvehiclewassubjectedtotestingasperchosendrivingcycleurbandynamometerdrivingschedule(UDDS)for comparisonpurposes.Fig.5.1.showstheemissionplotfor aconventionalvehicle.
2022, IRJET | Impact Factor value: 7.529 | ISO 9001:2008 Certified Journal |
International Research Journal of Engineering and Technology (IRJET) e-ISSN: 2395-0056
Figure.5.1. Variationofemissionswithtimeon UDDSDrivingcycleforaconventionalvehicle
Figure5.2.VariationofemissionsonUDDS DrivingCycleforHybridElectricvehicle
ThechosenvehicleconfigurationunderhybridelectricmodewasallowedtoperformforpredictingemissionsonUDDSdriving cycle. TheFig.5.2shows themagnitudeofemissionsoveracertainperiodoftimeforastandardToyotaPriushybridmodel. ThemagnitudeofCOandNOxarewithinthelimitsofBSVInormswhereastheHCemissionmagnitudeislittlemorethanthe BSVI6norms.Astheselectedhybridmodelisapetrolenginedriven,hencethemagnitudeofemissionssatisfytheBSVInorms except HCemissionwhoserangeislittlebitmorethantheBSVIi.e.0.1gram/km.
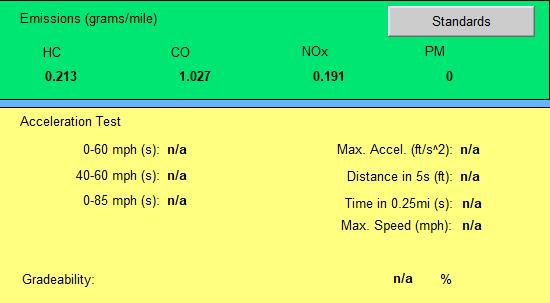
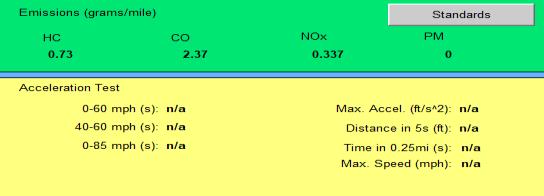
Table 5.1-Comparisonofemissionsbetweenhybridandconventionalvehicle
VehicleType HC(gram/mile) CO(gram/mile) NOx(gram/mile) PM(gram/mile)
HEV 0.213 1.027 0.191 0
Conve-ntional 0.73 2.37 0.337 0
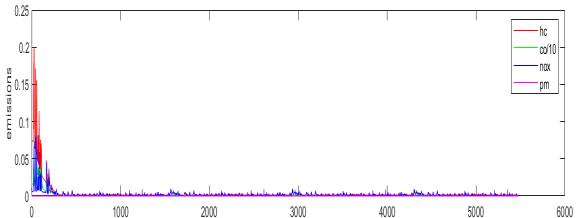
Table5.1givesthecomparisonofdifferencesofemissionsbetweenconventionalandhybridelectricvehicle.Thecomparative analysissuggestedthattheharmfulpollutantemissionsfromhybridvehicleswerelowerthanthatofconventionalvehicle operation.ThereductioninHCemissionswereabout70%,57%ForCOandNOxwerereducedby45%.
Volume: 09 Issue: 10 | Oct 2022 www.irjet.net p-ISSN: 2395-0072 © 2022, IRJET | Impact Factor value: 7.529 | ISO 9001:2008 Certified Journal | Page864
International Research Journal of Engineering and Technology (IRJET) e-ISSN: 2395-0056
Volume: 09 Issue: 10 | Oct 2022 www.irjet.net p-ISSN: 2395-0072
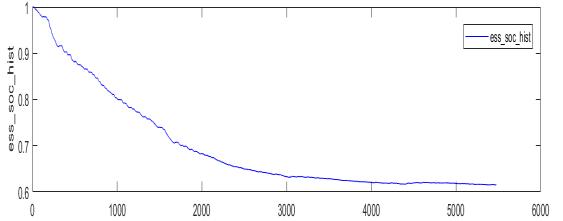
TheplotinFig.5.3showsthevariationofstateofchargewithrespecttotimeforaperiodof6000seconds(approx.100min).At thestartofvehicleoperation,thebatteryisfullychargedbutoncethevehiclestartstorun,thebatterygetstodischargeand thereisagradualfallinthestateofchargeaftersomeperiodoftime.Stateofchargeplotgivesawarningaboutthebattery withrespecttotime,asbatterychargingisavitalaspectinhybridelectricvehicles.
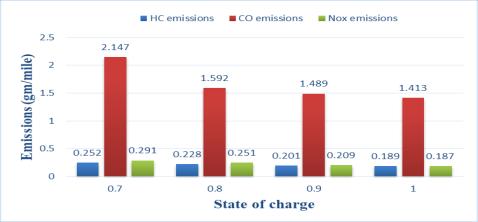
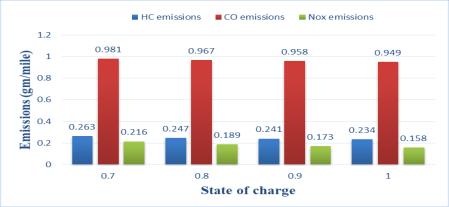
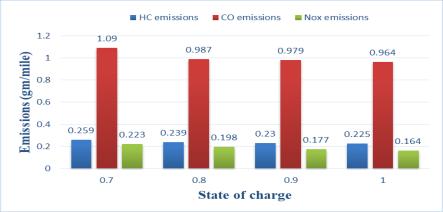
Thestateofchargeofahybridvehicleplaysavitalroleasfarastheemissionsofahybridvehicleisconcerned.Thevariationof stateofchargehasaprofoundimpactontheengineemissions.Thethreedifferentdrivingcycles(UDDS,NEDCandUS06)were chosenwhoseinitialstateofchargewasvariedtoevaluatetheemissionsofastandardhybridelectricvehicle.TheFigs-5.4,5.5 and5.6representthevariationofpollutantemissionsversusstateofchargeincaseofallthedrivingcycles.Fromtheabove histogramit’sseenthatasthestateofchargedecreasesgradually,thereisariseinemissionvaluesofthepollutants.Allthe harmfulpollutantsshowanincreaseintheirvaluesasthestateofchargedecreases.
Figure5.4:VariationofEmissionswith SOCinUDDSdrivingcycle
Figure5.5:VariationofEmissionswith SOCinNEDCdrivingcycle
Figure5.6:VariationofEmissionswith SOCinUS06drivingcycle
International Research Journal of Engineering and Technology (IRJET) e-ISSN: 2395-0056
Volume: 09 Issue: 10 | Oct 2022 www.irjet.net p-ISSN: 2395-0072
Itisknownthat aparallelhybridvehicledrawsitspropulsivepowerfrom2powersourcestopropelitself.Asthestateof chargedecreasesthecontributionofpowersuppliedfromthebatteryreducestoo.So,thevehicletendstodrawmorepower fromtheICenginewhichispetrol/gasolinedriven.Hencemorepowerisconsumedfrompetrol/gasolinethanbefore.Thusthis makesthevehicleemitmoreandmoreharmfulpollutants.That’swhythemagnitudeofpollutantemissionsincreaseswith decreaseinthestateofchargevaluesforaparticulardrivingcycle.
Thepercentageincreaseintheemissionsofvariouspollutantsas SOC decreasesfrom 1 to 0.7 isshownintabularformats belowfordifferentdrivingcycles.
ItcanbeseenfromFigs.5.4to5.6thattheriseinNOxpercentageismaximumamongallthepollutantsunderallthree Driving Cycles.TheriseinNOxemissionismaximumintheUS06drivingcyclewhichliesintherangeof55-60%.Outofallthedriving cyclesUS06drivingcyclehasseenthemaximumincreaseintheemissionsofalltheindividualpollutants.Thisisbecauseofthe nature of the US06 driving cycle which is basically designed for aggressive, high-speed with great-acceleration driving behavior,fastspeedvariationsafterthestartoftheengine.
Forpredictionoftheperformanceofahybridvehiclemodel,awellknowntool-ArtificialNeuralNetworkwastaken.TheANN model basically considers two important parameters to predict the performance of a vehicle. The values of correlation coefficientandmeansquareerrorarecalculatedfortraining,testandvalidationineachperformanceparameterandtheyare showninatabularform.
Correlation coefficient (R) performance
Figure
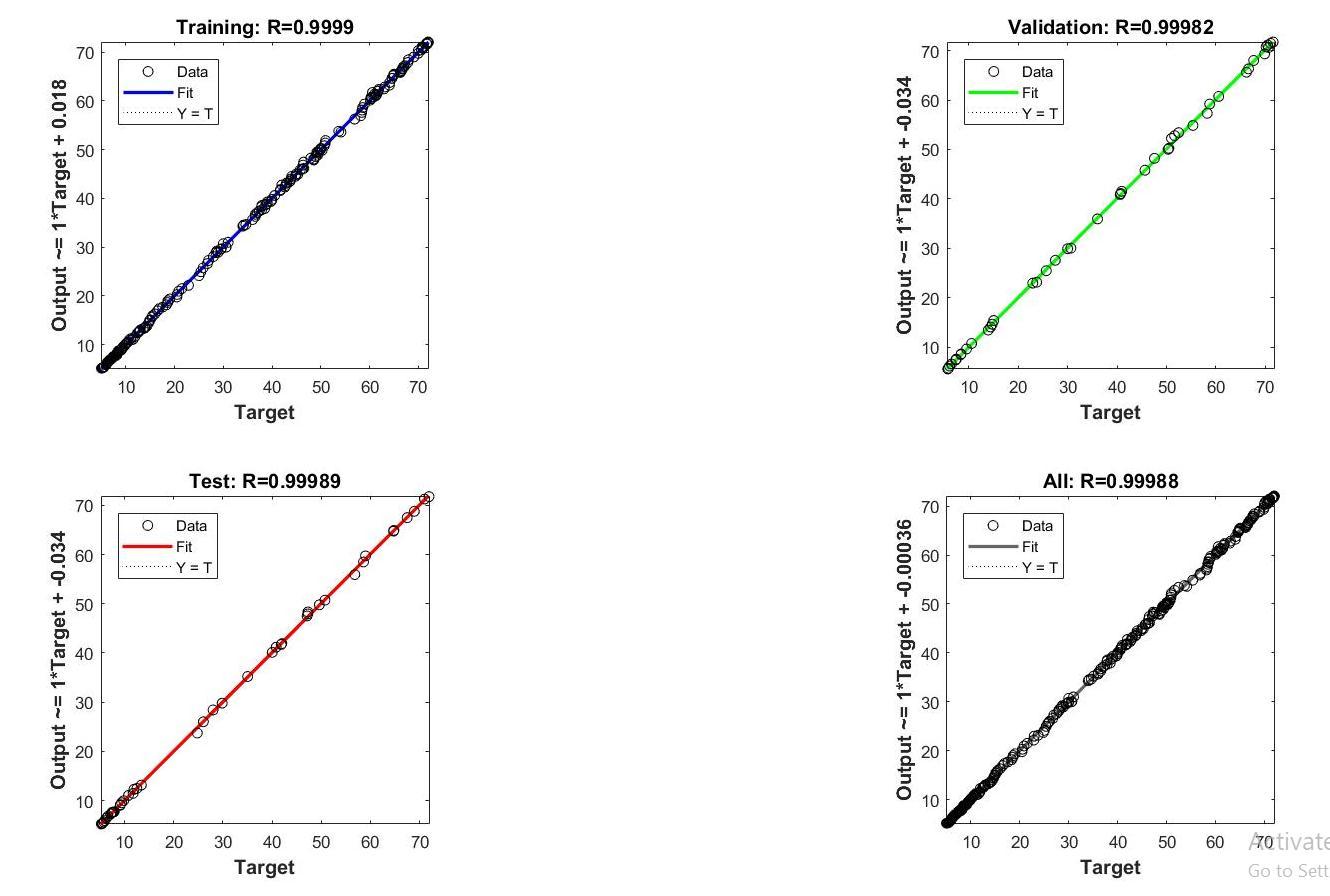
ReferringtoFig.5.7,forpredictingthecorrelationcoefficientforBrakePower,amaximumvalueofpowerof72kW,asperthe specifications of chosen vehicle configuration was selected. The target represents the experimental values and output representsthepredictedvalueswhichwereobtainedfromtheANN.Fromtheaboveplotthevaluesofcorrelationcoefficient (R)fortraining,validationandteststagesforbrakepowerwhichwere0.9999,0.99982and0.99989respectively.Thevalueof correlationcoefficient(R)ineachstageiscloserto1.Thisindicatesthepredictedresultsobtained inthetraining,testand validationstageswerepositiveandstrongandhencethereexistsaperfectcorrelationbetweenthepredictedandexperimental values.
International Research Journal of Engineering and Technology (IRJET) e-ISSN: 2395-0056
Volume: 09 Issue: 10 | Oct 2022 www.irjet.net p-ISSN: 2395-0072
Table5.2shownbelowrepresentstheRMSEandRvaluesforbrakepower.
Table 5.2-R and RMSE values for Brake Power prediction
Stageofmodel Correlationcoefficient(R) RootMeansquareerror(RMSE) Training 0.9999 0.3236 validation 0.99982 0.4604 test 0.99989 0.3441
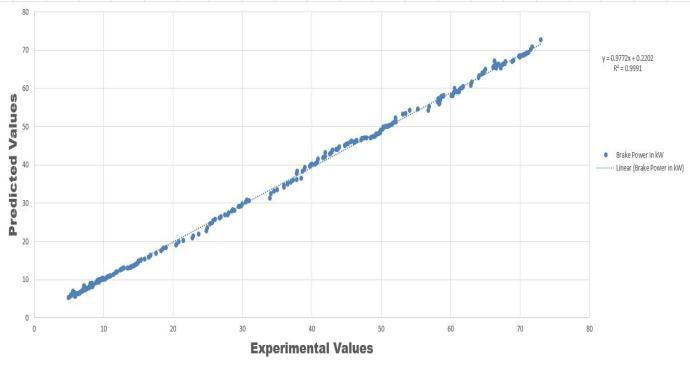
Theabove plotrepresentsthevariationof predictedvaluesversus experimental valuesfor brakepower. Thecorrelation coefficientofthebrakepowershowsavalueof0.998whichisprettycloseto1.Thusitindicatestherelationbetweenthe predictedvaluesandExperimentalvaluesispositiveandstrongandtheywereclosertoeachother.AstheRvalueliescloserto 1whichmeansthereexistsaperfectcorrelationbetweenthepredictedandexperimentalvaluesinpredictingthebrakepower usingANN.Thereisariseinbrakepowervalueastheethanolblendpercentageincreasesandduetothat,thereoccursaslight deviationbetweentheexperimentalandpredictedvalues.
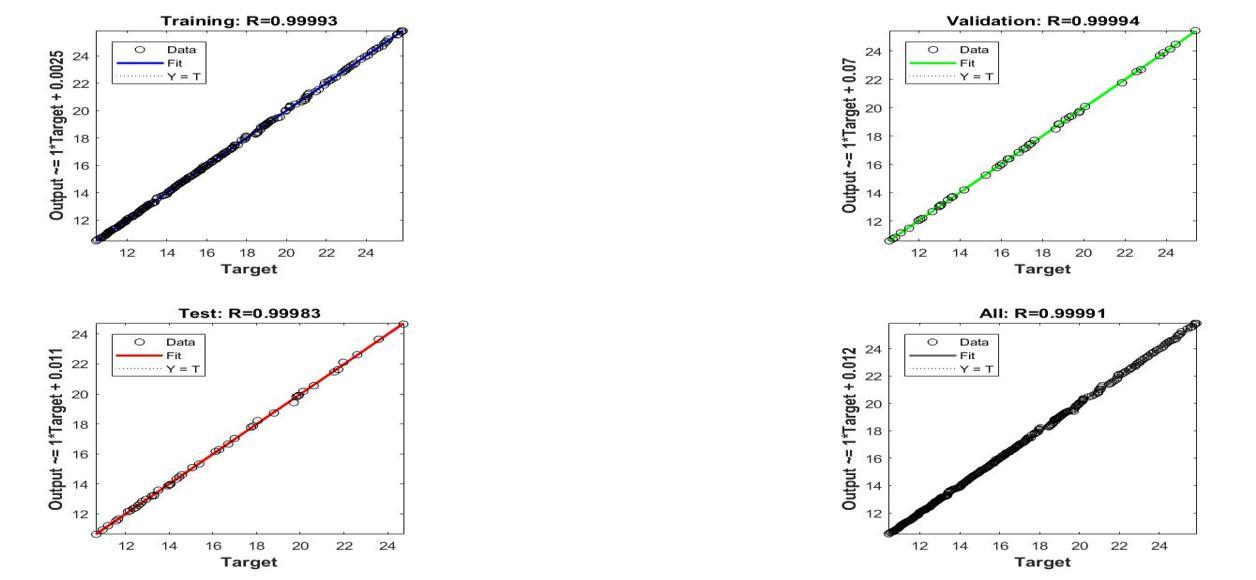
5.5.2 Prediction of Brake Thermal Efficiency using ANN Correlation coefficient (R) performance Figure 5.8:Correlation coefficient for brake thermal efficiency
2022, IRJET | Impact Factor value: 7.529 | ISO 9001:2008 Certified Journal | Page867
International Research Journal of Engineering and Technology (IRJET) e-ISSN: 2395-0056
Volume: 09 Issue: 10 | Oct 2022 www.irjet.net p-ISSN: 2395-0072
Fig.5.8showsthegraphicalvariationoftheoutputversustargetforbrakethermalefficiencyandthelimitofbrakethermal efficiencywastakenas26%.Fromtheaboveplotthevaluesofcorrelationcoefficient(R)fortraining,validationandteststages forpredictingthebrakethermalefficiencyare0.99993,0.9994and0.99983respectively.Thevalueofcorrelationcoefficient (R)ineachstageiscloserto1.It indicatesthepredictedresultsobtainedinthetraining,testandvalidationstagesarepositive andstrongandthereexists a perfectcorrelation betweenthepredictedand experimental values. Table5.3shownbelow representstheRMSEandRvaluesforbrakepower.
Stageofmodel Correlationcoefficient(R) RootMeansquareerror(RMSE)
Training 0.99993 0.0513 Validation 0.99994 0.05015 Testing 0.99983 0.07163
Figure 5.14
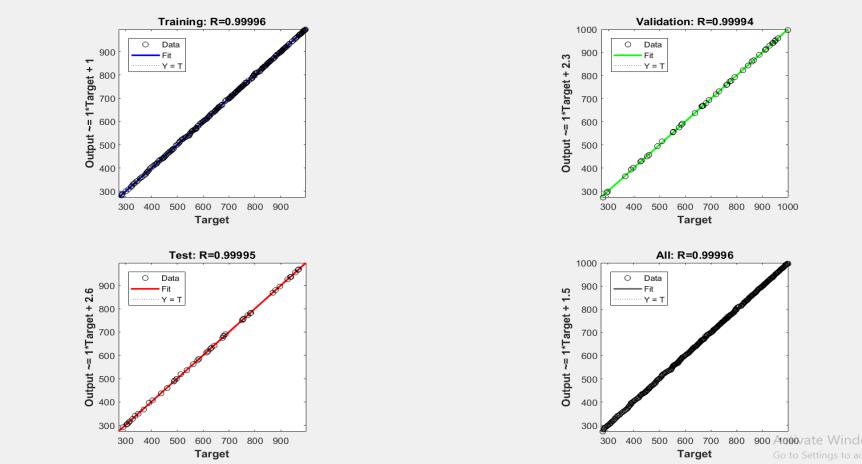
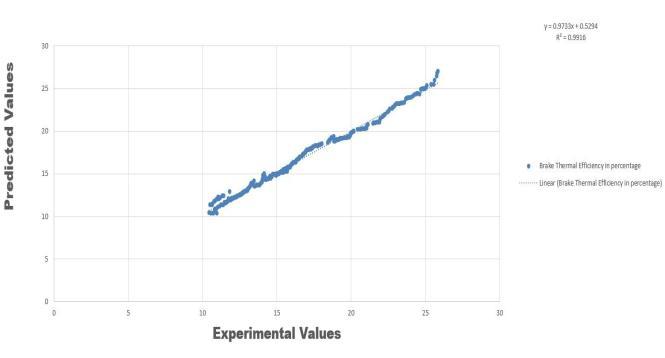
Fig.5.10 shows the variation predicted values versus experimentally obtained values for brake thermal efficiency. The maximumlimitofbrakethermalefficiencyis26%intheplot.Themagnitudeofcorrelationcoefficientis0.995. Itcanbeseen thatthereisanincreaseinbrakethermalefficiencywhichwasduetotheadditionofethanolblendgasoline.Theadditionof ethanolaidedinimprovedcombustionefficiency.Theinitialfluctuationarisesbecauseoftheerrorintroducedinthepredicted buttheerrorliesinthedecimalrangeanditisminimalastheethanolblendpercentincreases.
5.5.3 Prediction of HC emission using ANN Correlation coefficient performance
Figure 5.11- Correlation coefficient for HC emission
2022, IRJET | Impact Factor value: 7.529 | ISO 9001:2008 Certified Journal | Page868
International Research Journal of Engineering and Technology (IRJET) e-ISSN: 2395-0056
Volume: 09 Issue: 10 | Oct 2022 www.irjet.net p-ISSN: 2395-0072
Fig.5.11showsthevariationoftheoutputversustargetforHCemissionwherethelimitofHCemissionwastakentill1000 PPM.Thetargetrepresentstheexperimentalvaluesandoutputrepresentsthepredictedvalueswhichwerepredictedbythe ANN.Fromtheaboveplotthevaluesofcorrelationcoefficient(R)fortraining,validationandteststagesforpredictingthe brakethermalefficiencyare0.9996,0.99994and0.99995respectively.Thevalueofcorrelationcoefficient(R)ineachstageis closerto1.Thisindicatesthepredictedresultsobtainedinthetraining,testandvalidationstagesarepositiveandstrongand thereexistsaperfectcorrelationbetweenthepredictedandexperimentalvalues.
5.5.4 Prediction for CO emission using ANN
Correlation coefficient performance
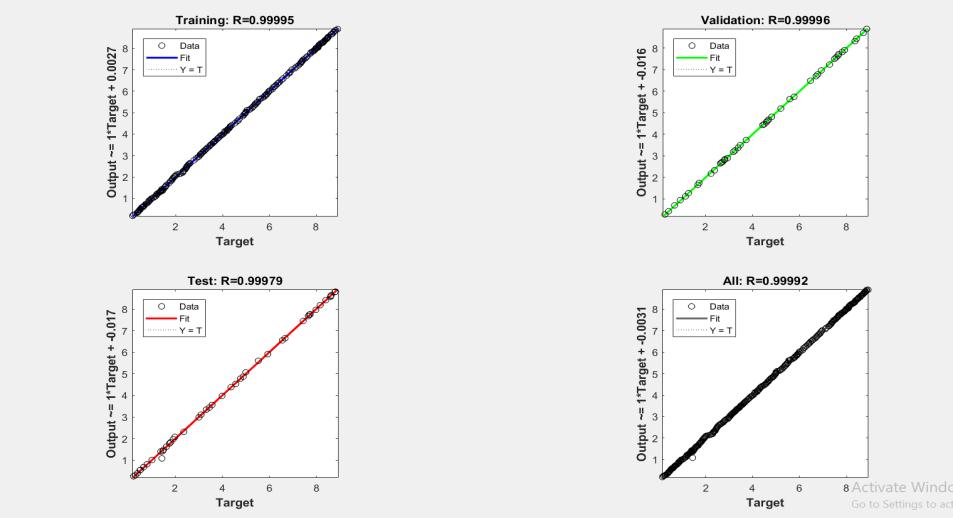
Figure 5.12-Correlation coefficient performance for CO emission
Fig.5.12showsthegraphicalvariationoftheoutputversustargetforCOemissionwherethelimitofHCemissionistakentill 10%.Herethetargetrepresentstheexperimentalvaluesandoutputrepresentsthepredictedvalueswhichwerepredictedby theANN.Fromtheaboveplotthevaluesofcorrelationcoefficient(R)fortraining,validationandteststagesforpredictingthe brakethermalefficiencyare0.99995,0.99996and0.99979respectively.Thevalueofcorrelationcoefficient(R)ineachstageis closerto1.Thisindicatesthepredictedresultsobtainedinthetraining,testandvalidationstagesarepositiveandstrongand thereexistsaperfectcorrelationbetweenthepredictedandexperimentalvalues.
5.5.5 Prediction of NOX emission using ANN
Correlation coefficient(R) performance
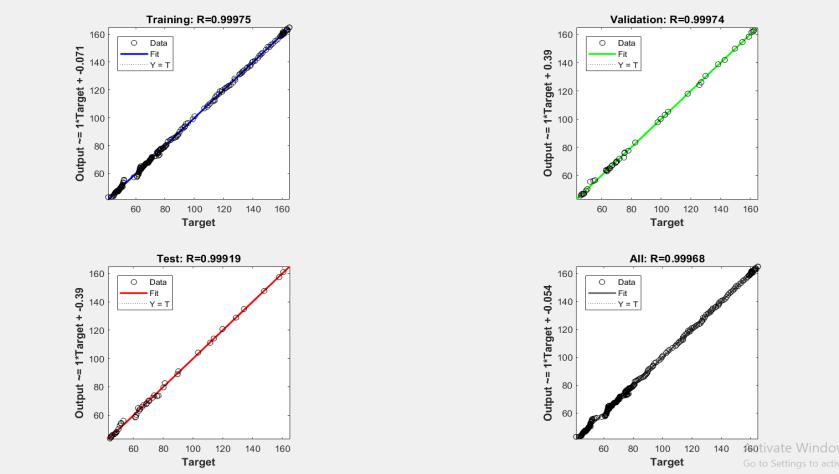
Figure 5.13:Correlation coefficient performance for NOx emission
International Research Journal of Engineering and Technology (IRJET) e-ISSN: 2395-0056
Volume: 09 Issue: 10 | Oct 2022 www.irjet.net p-ISSN: 2395-0072
Fig.5.13showsthegraphicalvariationoftheoutputversustargetforHCemissionwherethelimitofHCemissionistakentill 170PPM.Herethetargetrepresentstheexperimentalvaluesandoutputrepresentsthepredictedvalueswhichareforecasted bytheANN.Fromtheaboveplotthevaluesofcorrelationcoefficient(R)fortraining,validationandteststagesforpredicting thebrakethermalefficiencyare0.99975,0.99974and0.99919respectively.Thevalueofcorrelationcoefficient(R)ineach stageiscloserto1.Thisindicatesthepredictedresultsobtainedinthetraining,testandvalidationstagesarepositiveand strongandthereexistsaperfectcorrelationbetweenthepredictedandexperimentalvalues.
1. Presently,hybridelectricvehicleswouldbeabetteroptionforcombatinglocalpollutionlevels.
2. Theharmfulemissionsfromahybridvehicleliebetweentheconventionalvehicleandpureelectricvehicle.
3. TheCOemissioninUS06drivingcycleismorethanthatofinurbanmodedynamometerscheduleandNewEuropean drivingcycle.
4. Owingtoaggressive,highspeedand/orhighaccelerationdrivingbehavior,quickfluctuationsinspeed,theUS06 drivingcycleproducesmorecarbonmonoxidethanthecorrespondingUDDSandNEDCdrivingcycle.
5. Stateofchargeofabatteryhasaprofoundimpactontheemissionsofahybridelectricvehicle.Astheinitialstateof chargedecreases,theemissionofharmfulpollutantsincreasesinallthedrivingcyclesforahybridelectricvehicle.
6. The percentage rise in NOx emission is maximum in all the driving cycles of the hybrid vehicle and the rise is maximuminUS06drivingcyclei.e.55.61%
7. TheANNmodelusedforpredictionbrakepower,brakethermalefficiencyofahybridmodelusingethanol-gasoline blendgivessatisfactoryresultsasthecorrelationcoefficientvalueslieintherangeof0.97to0.99
8. ForpredictionofemissionslikeHC,COandNOx,thecorrelationcoefficientvalueliesintherangeof0.96to0.99which indicatestherelationbetweenthepredictedandtargetvaluesispositiveandstrong.
9. ThroughANNtool,goodcorrelationisobservedbetweenpredictedandexperimentalvalues.Presentmodel’sRvalues areveryneartoone,andtheRMSEvalueisquitelow.
The authors wholeheartedly thank theauthorities ofNIT Warangal for permittingtocarry out the work by extending all support.
1. S.R.BhatikarandR.L.Mahajan,K.WipkeandV.Johnson“NeuralNetworkBasedEnergyStorageSystemModelingfor HybridElectricVehicles” 2000(http://dx.doi.org/10.2172/935117)
2. T. Markel, A. Brooker, T. Hendricks, V. Johnson, K. Kelly, B. Kramer, M. O’Keefe, S. Sprik, K. Wipke ADVISOR: a systemsanalysistoolforadvancedvehiclemodeling,2002.(https://doi.org/10.1016/S0378-7753(02)00189-1)
3. AndrewC.Baisden, AliEmadiADVISOR-BasedModelofaBatteryandanUltra-CapacitorEnergySourceforHybrid Electric Vehicles, IEEE Transactions on Vehicular Technology ( Volume: 53, Issue: 1, January 2004) (https://ieeexplore.ieee.org/document/1262142)
4. MariamKhan andNarayanC.Kar“HybridElectricVehiclesforSustainableTransportation:ACanadianPerspective” World Electr. Veh. J. 2009, 3(3),551-562 (DOI:10.3390/wevj3030551)
5. AfundamentalcasestudyonthePriusandIMAdrivetrainconcepts,TheoHofman,RoellvanDruten,AlexSerrarens, JannekevanBaalen)
6. M.KianiDeh,Kiani, B.Ghobadian.T.Tavakoli,A.M.Nikbakht,G.Najafi,TarbiatModares“Applicationofartificial neuralnetworksforthepredictionofperformanceandexhaustemissionsinSIengineusingethanol-gasolineblends” EnergyVolume35,Issue1,pp: 65-69. (https://doi.org/10.1016/j.energy.2009.08.034)
International Research Journal of Engineering and Technology (IRJET) e-ISSN: 2395-0056 Volume: 09 Issue: 10 | Oct 2022 www.irjet.net p-ISSN: 2395-0072
7. M.A.Hannan, F.A.Azidin, A.Mohamed Hybrid electric vehicles and their challenges: A review Renewable and SustainableEnergyReviewsVolume29,2014,pp:135-150(https://doi.org/10.1016/j.rser.2013.08.097)
8. LiuDe-xing,ZouYu,LiuTeng“ModelingandControlfortheToyotaPriusunderConsiderationofEmissionsReduction” 2014IEEEConferenceandExpoTransportationElectrificationAsia-Pacific(ITECAsia-Pacific)(DOI:10.1109/ITECAP.2014.6941286)
9. Emissionsandfueleconomyforahybridvehicle,ImdatTaymaz,MerthanBenliFuelVolume115,2014,pp:812-817 (https://doi.org/10.1016/j.fuel.2013.04.045)
10. G.O. Duarte , R.A. Varella , G.A. Gonçalves, T.L. Farias “Effect of battery state of charge on fuel use and pollutant emissions of a full hybrid electric light duty vehicle” Journal of Power Sources Volume 246, 2014, pp: 377-386 (https://doi.org/10.1016/j.jpowsour.2013.07.103)
11. AishwaryaPandayandHariOmBansal“HybridElectricvehiclePerformanceAnalysisunderVariousTemperature Conditions” EnergyProcediaVolume75, 2015,pp:1962-1967(https://doi.org/10.1016/j.egypro.2015.07.238)
12. C.Jianfei,J.Peng,H.Hongwen“ModelingandSimulationResearchonPower-splitHybridElectricVehicle” Energy ProcediaVolume104,December2016,pp:354-359.(https://doi.org/10.1016/j.egypro.2016.12.060)
13. SrinathPai,Krishnaprasad, AbdulSharief, Shivakumar,ShreeprakashBEmissionAnalysisofaDieselEngineUsing ANN–AReview,, NationalConferenceonAdvancesinMechanicalEngineeringScience(NCAMES-2016).
14. Fundamentals and Classification of Hybrid Electric Vehicles, Ojas M. Govardhan-2017 International Journal of EngineeringandTechniques-Volume3Issue5,Sep-Oct2017
15. Muhammad,IkramMohdRashid,HamdanDanialADVISORSimulationandPerformanceTestofSplitPlug-inHybrid Electric Vehicle Conversion Energy Procedia Volume 105, 2017, pp:1408-1413 https://doi.org/10.1016/j.egypro.2017.03.524)
16. SametUslu,MustafaBahattinCelik“Predictionofengineemissionsandperformancewithartificialneuralnetworksin asinglecylinderdieselengineusingdiethylether”EngineeringScienceandTechnology,InternationalJournalVolume 21,Issue6,2018,pp:1194-1201(https://doi.org/10.1016/j.jestch.2018.08.017)
17. DibakorBoruah,PintuKumarThakur,DipalBaruahArtificialNeuralNetworkbasedModelingofInternalCombustion EnginePerformanceInternationalJournalofEngineeringResearch&Technology(IJERT)Vol.5Issue03,March-2016.
18. A.K.Thakur,K.K.S.Mer&AjayKaviti“Anartificialneuralnetworkapproachtopredicttheperformanceandexhaust emissions of a gasoline engine using ethanol–gasoline blended fuels”. Biofuels, Volume 9,issue 3, 2018. DOI:10.1080/17597269.2016.1271630)
19. K.V.Singh,H.O.Bansal,Dheerendra Singh“Acomprehensivereviewonhybrid electricvehicles:architecturesand components” J. Mod. Transport. 27,77–107(2019)https://doi.org/10.1007/s40534-019-0184-3)
20. JánDižo, MiroslavBlatnický, StanislavSemenov,EvgenyMikhailov, MariuszKostrzewski,PawelDroździel,Pavol Šťastniak “Electric and plug-in hybrid vehicles and their infrastructure in a particular European region” TransportationResearchProcediaVolume55,2021,Pp..629-636(https://doi.org/10.1016/j.trpro.2021.07.029)
21. AnhTuanHoang,SandroNiˇzeti,HwaiChyuanOng,WieslawTarelko,VanVietPham,TriHieuLe,MinhQuangChau, Xuan Phuong Nguyen “A review on application of artificial neural network (ANN) for performance and emission characteristicsofdieselenginefueledwithbiodiesel-basedfuels”, SustainableEnergyTechnologiesandAssessments Volume47,2021,101416(https://doi.org/10.1016/j.seta.2021.101416)