Volume: 09 Issue: 10 | Oct 2022 www.irjet.net p-ISSN: 2395-0072

Volume: 09 Issue: 10 | Oct 2022 www.irjet.net p-ISSN: 2395-0072
Singh1 , Dr. Anirudh Gupta2
1M.Tech. Student, Environmental Engineering, Institute of Engineering and Technology, Lucknow, Uttar Pradesh, India
2Assistant Professor, Civil Engineering department, Institute of Engineering and Technology, Lucknow, Uttar Pradesh, India ***
Abstract - This study discusses the present solid waste management practices in the Kanpur municipal region in the Kanpur district of Uttar Pradesh state, India. The exponential growth in population as well as the general advancement of society and businesses are the main causes of the city's rising generation of solid waste. One of the essentialcomponents ofsolid waste management is routing, and optimizing the collection route reduces travel time and disposal expenses. In order to identify the most efficient routes for municipal solid waste (MSW) collections in Kanpur, India, this study integrated the network analyzer tool's algorithms and built-in optimization techniques into the Geographical Information System (GIS) platform. According to our study, there was a 5.59 km decrease in the chosennetwork.
Words: ArcGIS, OPTIMIZATION, SWM, TRANSPORTATION, TRANSFER STATION
Different methods are used to handle, store, collect, and dispose of the wastes produced by the many human sports.Therefore,ifgarbageisnotmanagedappropriately, waste management places a risk on the environment and hasanegativeimpactonpublichealth.Kanpur'ssystemof reliable garbage management is no longer unique among the vast majority of Indian cities. Kanpur Nagar Nigam (KNN) had the responsibility for collecting, transporting, andcastingoffthestrongwastegeneratedinsidethetown, predictedataboutathousand tons in keeping with day in Kanpur. As consistentwith provisional reports of Census India, the populace of Kanpur in 2011 is 27. Seventy-four Lakhs, Kanpur town is administratively divided into 6 zones and one hundred tenwards. There are 203 lively collectionfactorsinseveral wardsofsixzones.Runningon KanpurNagarNigam,region2 wards ninety-five and total wastegatheredis80%drywasteand20%wetwaste.
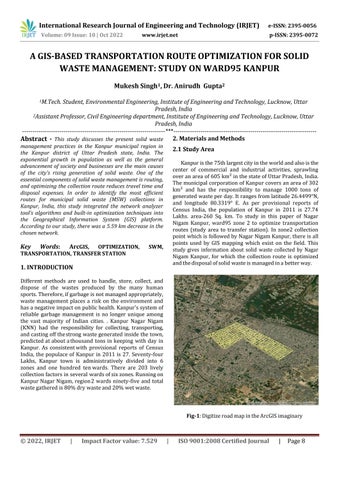
Kanpuristhe75thlargestcityintheworldandalsoisthe center of commercial and industrial activities, sprawling overanareaof605km²inthestateofUttarPradesh,India. ThemunicipalcorporationofKanpurcoversanareaof302 km² and has the responsibility to manage 1000 tons of generatedwasteperday.Itrangesfromlatitude26.4499°N, and longitude 80.3319° E. As per provisional reports of Census India, the population of Kanpur in 2011 is 27.74 Lakhs. area‐260 Sq. km. To study in this paper of Nagar Nigam Kanpur, ward95 zone 2 to optimize transportation routes (study area to transfer station). In zone2 collection pointwhichisfollowedbyNagarNigamKanpur,thereisall points used by GIS mapping which exist on the field. This study gives information about solid waste collected by Nagar Nigam Kanpur, for which the collection route is optimized andthedisposalofsolidwasteismanagedinabetterway. Fig-1:DigitizeroadmapintheArcGISimaginary
e-ISSN: 2395-0056
Volume: 09 Issue: 10 | Oct 2022 www.irjet.net p-ISSN: 2395-0072
ArcGIS is a geographical information system (GIS) software that allows handling and analyzing geographic information by layer-building graphical statistics through layer-building maps like climate data and modeling natural systemprocessesand functions.Using thatBend ViewArc GIS 10.4, the raster picture that appeared on the pcscreenis changedoverintovectordelineations.
The numerous definite enhancement plan for Zone 2 ward 95 of Nagar Nigam Kanpur have been investigated. Using Arc View via GIS, the filtered images are then digitized. Digitizing: Refers to the process of convertingreferenceddatatodigitalformat(shapefile).
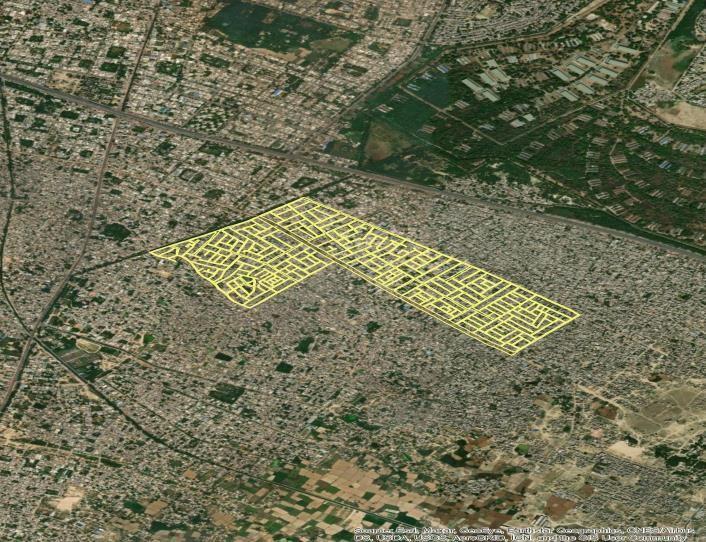
Kanpur Nagar Municipal ward 95 zone 2 generates roughly 400 kg of solid trash each day. Domestically generated MSW is collected inthecity bystreet sweepingwith conventional shorthandledbroomsandtheDoortoDoorcollectionsystem..Waste bycollectingTATAACEEHoppersofthecity.Solidwastein themunicipalareaiscollected.Thesolidwastecollectionis 100% in the area. Presently sweeping, collection and transportationactivitiesaredonebysanitaryworkersinthe municipality. Further,a tractor isused for transporting the collectedwastetothedumpingground.
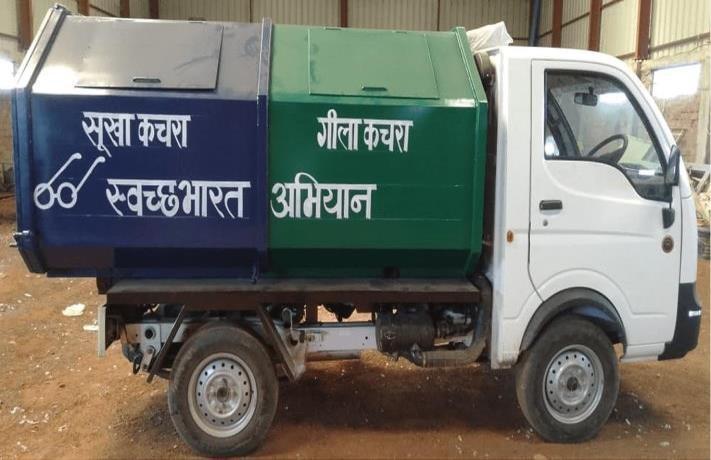
Transportation of solid waste includes lifting of closed containers, lifting of dead animals, and lifting of silt from nalla.Thetransportationofunattendedwasteinopenplots and unwept waste in slums is also done manually or mechanically through a variety of vehicles. Approximately two closed containers of waste are emptied into a bigger tipper at the transfer station which is taken for final transfer toalandfillsite.
Kanpur Municipal organization has a stable waste managementplant,forthe processingof biomedical waste and casting off the unsegregated, strong Waste on the dumping floor. Further, the fabric is transferred to the segregationphasewherewasteisisolatedinvariousforms which include wet, dry, recyclable, and inert wastes. The wasteprocessinganddisposalplantispositioned.Mostwaste being degradable is transferred to the window platform whereintheBio-culturehelpsincompostingwaste.
Due to a lack of area landfills, biodegradable backyard waste is allowed to decompose in a medium designed for the reason. The handiest biodegradable waste substances are utilizedincomposting.Itsmilesabiologicalprocessinwhich microorganisms, specifically fungi, and bacteria convert degradablenaturalwasteintosubstanceslikehumans.This finished product, which seems like soil is excessive in carbon andnitrogen.Precisefineenvironmentallyfriendlymanureis fashioned from compost which is a first-rate medium for developing vegetation and can be used for agricultural purposes.
In this method, stable wastes are burned at high temperatures until they are reduced to ashes. Incinerators are constructed in such a way that when burning solid waste,theydonotproduceexcessiveheat.Waste-to-energy plants are incinerators that reuse thermal energy through furnaces and boilers. Because they need specialized equipmentandcontrols,highlyqualifiedtechnicalstaff,and auxiliary fuel facilities, waste-to-energy systems are more expensive to install and operate than simple incinerators. Thistechniqueofstrongwastemanagementcanbefinished by people, municipalities and even institutions. The coolest element about this approach is the reality that it reduces the extent of waste up to twenty or thirty of the authentic quantity.
Recycling or restoration of sources is the method of taking beneficial however discarded items for subsequent use. Plastic baggage, tins, glass, and boxes are frequently recycled automatically considering, in lots of situations, they're likely to be scarce commodities. Historically, these itemsareprocessedand cleanedbefore theymayberecycled. Theprocesstargetsatreducingpowerloss,consumptionof thelatestmaterial,andreductionoflandfills.Themaximum advancedinternationallocationsfollowarobustwayoflifeof recyclingtodecreasevolumesofwaste.
One such large city in North India is Kanpur, which generates about a thousand tonnes of hazardous trash daily.Thekitchen,foodscraps,spoiledorganicgoods,fruits, plants,seedstockpiles,andotheritemsmakeuptheherbal department. Paper, glass, metal, and plastics make up less than 15% of total garbage. . They determine the present kingdom of municipal stable waste management (MSWM) in Kanpur metropolis with the aim of identifying the principle barriers to its efficiency andthe potentialities for improvisation of thestrong wastecontrol devicewithin the city. The existing strong waste management device within
International Research Journal of Engineering and Technology (IRJET) e-ISSN: 2395-0056
Volume: 09 Issue: 10 | Oct 2022 www.irjet.net p-ISSN: 2395-0072
thecityisobservedtobedistinctlyinefficient.Primaryand Secondary series, transportation, and open dumping are the most effective activities practiced that too in a nontechnicalmanner.
The primary collection of segregated MSW from individual households and establishments (door-to-door collection) is accomplished through the use ofcontainerized pushcarts, tricycles or small mechanized vehicles, compactors,ortippingvehiclesdependingontheterrainofthe locality,widthofstreets,andbuildingdensity.
The secondary collection includes selecting up waste from community boxes, waste garage depots, or switch stationsandtransportingittowasteprocessingsitesortothe very last disposal site. On the secondary series factors, segregated waste needs to be saved on-website online in separateblanketedcontainersforsimilarcollectionandhasto be kept separate in the course of all steps of waste series, transportation,andprocessing.ULBsneedtoensurethatonthe secondary garage factors the waste is ought to be attended to each day or before the field starts overflowing.
Fig -3:SkipTruck(Dumperplacermachines)
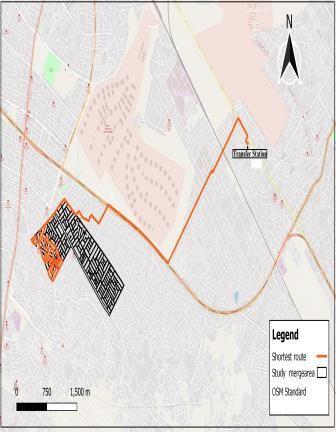
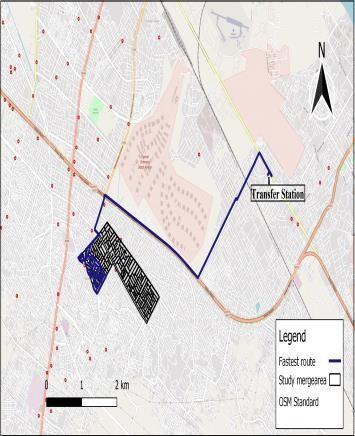
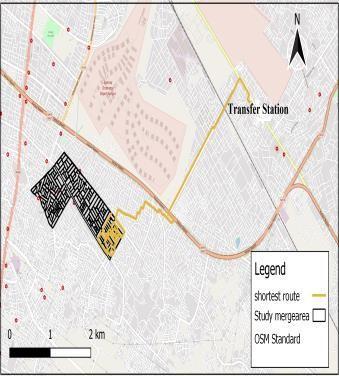
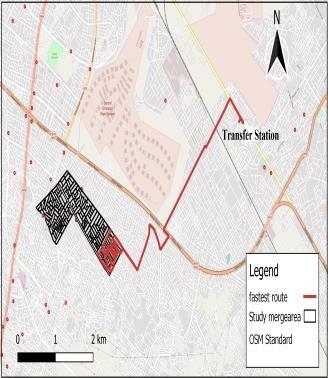
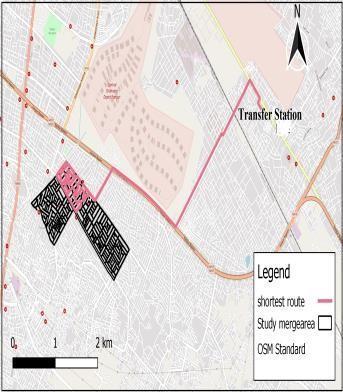
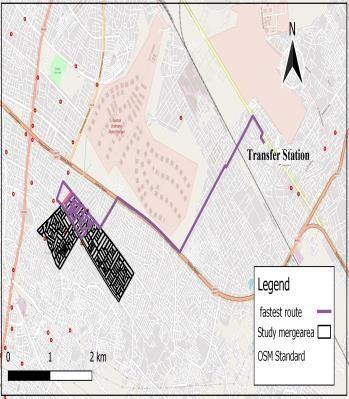
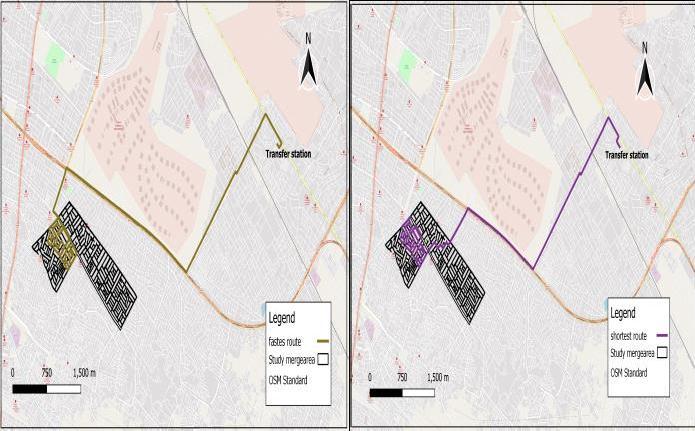
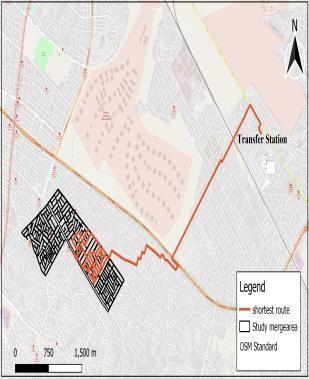
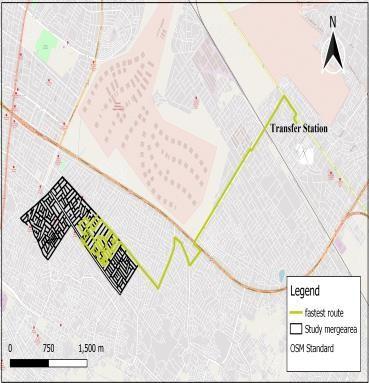
TheGISprovideddetailedinformationonroadnetwork connectivity among different study points. After applying QGIS‘networkanalysttool,’andgivingthestartingnodes,i.e., variouswardsonebyone,andthedestinationnode,i.e.,the etransferstation,thealgorithmidentifiedtheshortestpath and provided the same on a GIS map, along with route distance,foreachofthedesiredlinks.Theoptimizedroutes generated from this approach were compared with the current routes that measured the distance between the individual ward to the disposal site at the Transfer station. The QGIS network analyst tool was applied by making the ward number 95 as a starting point of vehicle1 (S1) to the transfer station as a destination as shown in Fig.4. The shortestroutewasfoundas11.63km(optimizeddistance), compared to 13.09 km (existing route distance), and vehicle2 (S2) as shown in Fig.5. The shortest route was found as 10.45km compared to 12.05km, and vehicle3 (S3)asshownin Fig.6. The shortest route was found as 10.75km, compared to 11.65km, and for the vehicle4 (S4) as shown in Fig.7. The shortest route was found 10.23km, compared to 11.29km, and for the vehicle5 (S5) as shown in Fig.8. The shortest route was found as 9.22km, compared to 9.79km (exiting route distance), that is practiced by municipal vehicles for transportationpurpose.TheArcGIS-optimizedrouteshowed that.
e-ISSN: 2395-0056
Vehicle1:
Vehicle Route4:
Fastestroute13.09Km Shortestroute11.63Km Fig-4: Optimizedsolidwastecollectionvehicle(S1)route.
Vehicle Route2:
Fastestroute12.05Km Shortestroute10.45Km Fig-5: Optimizedsolidwastecollectionvehicle(S2)route.
Vehicle Route3:
Fastestroute11.29Km Shortestroute10.23Km Fig-7: Optimizedsolidwastecollectionvehicle(S4)route.
Vehicle Route5:
Fastestroute11.65Km Shortestroute10.75Km Fig-6: Optimizedsolidwastecollectionvehicle(S3)route.
Fastestroute9.79Km Shortestroute9.22Km Fig-8: Optimizedsolidwastecollectionvehicle(S5)route.
Table-1: Resultsfromtheapproachbycomparingcurrent distancev/soptimizeddistance(Km).
Vehicles points Destination points Practicing distance(km) Optimized distance(km) Saving distance(km)
S1 TS 1309 1163 1.64 S2 TS 1205 1045 1.6 S3 TS 1165 1075 0.9 S4 TS 1129 1023 1.06 S5 TS 9.79 9.22 0.57
Total 5787 5228 5.59
From the above data these are results with the help of ArcGIS10.4 and QGIS 3.24 route optimization. And it gives the
Volume: 09 Issue: 10 | Oct 2022 www.irjet.net p-ISSN: 2395-0072 © 2022, IRJET | Impact Factor value: 7.529 | ISO 9001:2008 Certified Journal | Page11
e-ISSN: 2395-0056
Volume: 09 Issue: 10 | Oct 2022 www.irjet.net p-ISSN: 2395-0072
optimized route with distance covered, (study area to transfer station) which used in a collection of solid waste of Zone2, Nagar Nigam Kanpur. Five vehicles are working to collect the waste from the ward, it is optimized by two routes theshortestand fastest route. The network analyst toolintheGISwasutilizedinmodeling theoptimalroutes forMSWcollectionatKanpur.Thisstudyfindsthereductions in haul distance as 5.59Km for locations. And the distance betweenthenodes,thelocationofcollectionpoints,andthe location of transfer sites were provided as input parameters in the modeling system. The future scope of this study may include savings in hauling time taken for both the current and shortest paths by considering traffic conditions.Theapproachinthisstudycanbeusedasatool for MSW management meant for the entire city in the study area, and the researchers can investigate the management scenario of MSW in other similar cities in developing countries.
[1] Karadimas, N. V., & Loumos, V. G. (2008). GIS-based modelling for the estimation of municipal solid waste generation and collection. Waste Management & Research, 26(4),337-346.
[2] Chalkias, C., & Lasaridi, K. (2009). A GIS based model for the optimisation of municipal solid waste collection: the case study of Nikea, Athens, Greece. technology, 1,11-15.
[3] Khan, D., & Samadder, S. R. (2016). Allocation of solid waste collection bins and route optimisation using geographical information system: A case study of Dhanbad City, India. Waste Management & Research, 34(7),666-676.
[4] Ansyar, M. H. (2020, October). Effectiveness of integrated waste management based on community empowerment: a cast study of Mamuju city. In IOP Conference Series: Earth and Environmental Science (Vol.575,No.1,p.012172).IOPPublishing.
[5] Koushki, P. A., Al-Duaij, U., & Al-Ghimlas, W. (2004). Collection and transportation cost of household solid wasteinKuwait. Wastemanagement, 24(9),957-964.
[6] Rızvanoğlu, O., Kaya, S., Ulukavak, M., & Yeşilnacar, M. İ. (2020). Optimization of municipal solid waste collection and transportation routes, through linear programming and geographic information system: a case study from Şanlıurfa, Turkey. Environmental MonitoringandAssessment, 192(1),1-12
[7] Singh, S., & Behera, S. N. (2019). Development of GISbased optimization method for selection of transportation routes in municipal solid waste
management. In Advances in Waste Management (pp. 319-331).Springer,Singapore.
[8] Das, S., & Bhattacharyya, B. K. (2015). Optimization of municipal solid waste collection and transportation routes. WasteManagement, 43,9-18.
Mukesh Singh is a student ofMaster of Technology, Environmental Engineering, Dept. of Civil Engineering, Institute of Engineering and Technology, Lucknow,UttarPradesh.
Dr. Anirudh Gupta is working as Assistant Professor, Dept., of Civil Engineering in InstituteofEngineering and Technology, Lucknow,UttarPradesh.