International Research Journal of Engineering and Technology (IRJET)
e-ISSN: 2395-0056
Volume: 07 Issue: 01 | Jan 2020
p-ISSN: 2395-0072
www.irjet.net
The Acoustical Study of Large Auditorium C. Pradeepa¹, A. Ramachandraiah² ¹ Research Scholar, School of Architecture, SRMIST, Chennai TamilNadu, India ² Professor, School of Architecture, SRMIST, Chennai TamilNadu, India ---------------------------------------------------------------------***----------------------------------------------------------------------
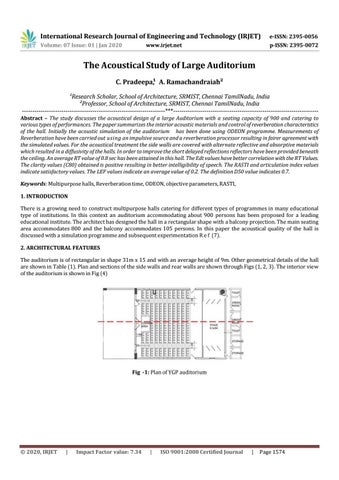
Abstract – The study discusses the acoustical design of a large Auditorium with a seating capacity of 900 and catering to various types of performances. The paper summarizes the interior acoustic materials and control of reverberation characteristics of the hall. Initially the acoustic simulation of the auditorium has been done using ODEON programme. Measurements of Reverberation have been carried out using an impulsive source and a reverberation processor resulting in fairer agreement with the simulated values. For the acoustical treatment the side walls are covered with alternate reflective and absorptive materials which resulted in a diffusivity of the halls. In order to improve the short delayed reflections reflectors have been provided beneath the ceiling. An average RT value of 0.8 sec has been attained in this hall. The Edt values have better correlation with the RT Values. The clarity values (C80) obtained is positive resulting in better intelligibility of speech. The RASTI and articulation index values indicate satisfactory values. The LEF values indicate an average value of 0.2. The definition D50 value indicates 0.7. Keywords: Multipurpose halls, Reverberation time, ODEON, objective parameters, RASTI, 1. INTRODUCTION There is a growing need to construct multipurpose halls catering for different types of programmes in many educational type of institutions. In this context an auditorium accommodating about 900 persons has been proposed for a leading educational institute. The architect has designed the hall in a rectangular shape with a balcony projection. The main seating area accommodates 800 and the balcony accommodates 105 persons. In this paper the acoustical quality of the hall is discussed with a simulation programme and subsequent experimentation R e f (7). 2. ARCHITECTURAL FEATURES The auditorium is of rectangular in shape 31m x 15 and with an average height of 9m. Other geometrical details of the hall are shown in Table (1). Plan and sections of the side walls and rear walls are shown through Figs (1, 2, 3). The interior view of the auditorium is shown in Fig (4)
Fig -1: Plan of YGP auditorium
© 2020, IRJET
|
Impact Factor value: 7.34
|
ISO 9001:2008 Certified Journal
|
Page 1574
International Research Journal of Engineering and Technology (IRJET)
e-ISSN: 2395-0056
Volume: 07 Issue: 01 | Jan 2020
p-ISSN: 2395-0072
www.irjet.net Table -1: Geometrical details of the hall
Geometrical Parameter Average Length L,m 31 Average Length L,m 15 Average height H, m 9 Depth D, m 3.5 Volume V m³ 4185 Seating capacity Sₐ,m² Total Area ST, m² Mean rake angle
Fig -2: Section of the auditorium
800 465 4.5
Fig -3: Rear wall of the auditorium
Fig -4: Interior View of the auditorium 3. SIMULATION MODEL USING ODEON –ACOUSTIC SIMULATION SOFTWARE: Modelling of the auditorium has been done using ODEON (version 13) Ref (1) programme. The modelling involves the following steps Ref (10): 3.1 CONSTRUCTING THE MODEL: A 3D room model has been created and imported to the ODEON. This is done through Google sketch up, Bim software and CAD programs in the DXF format. 3D model has to be generated with minimum required detail to achieve the highest accuracy of the results. High detail in the model tends to produce inaccurate results increasing in the processing time and the extensive image source inclusion. 3.2. ACOUSTICAL STUDY: The 3d model is exported to the ODEON. Sources on the stage have been modelled as point source. Sources on the stage have been modelled as point sources Fig (5). The other properties of the sources such as directivity pattern, gain, equalization and delay allowing the definition of natural sound sources as well as loud speaker systems. It has a list of common sources to choose from the library included in the programme where the absorption coefficients from 63 Hz to 8 KHz are provided. To ensure that the computations are reliable, the geometries should be © 2020, IRJET
|
Impact Factor value: 7.34
|
ISO 9001:2008 Certified Journal
|
Page 1575
International Research Journal of Engineering and Technology (IRJET)
e-ISSN: 2395-0056
Volume: 07 Issue: 01 | Jan 2020
p-ISSN: 2395-0072
www.irjet.net
consistent. ODEON includes a number of tools for geometry verification. Ray tracing display can also be employed for the verification of room geometry as a 3D billiard projection. Fig (6).
Fig -5: 3D Sources and Receivers
Fig -6: 3D Billiard
4. RESULTS AND DISCUSSIONS: The following objective parameters have been obtained. Ref (2,4,8): 4.1. REVERBERATION TIME: Ref (5, 6): Reverberation time (RT) is the time required for sound to decay 60dB, whereas early decay time (EDT) refers to the early part of the first 10dB of the sound decay. Using an impulsive signal the reverberation in the hall has been tested. A comparison of simulated values of RT and measured values is shown in Table (2) Ref (4, 10). The decay of sound is completely linear and the hall experiences good diffuse sound field Fig (7). A fall of 3 dB of SPL is observed from the stage to rear position of audience.
Fig -7: RT values Table (2) Measured and simulated RT values 250 0.91 0.85
Measured (Location 3) Simulated
500 0.88 0.98
RT VALUES 1000 2000 4000 8000 0.85 0.91 0.97 0.7 1.28 1.19 0.96 0.61
4.2. CLARITY: Clarity is defined by the equation
© 2020, IRJET
|
Impact Factor value: 7.34
|
ISO 9001:2008 Certified Journal
|
Page 1576
International Research Journal of Engineering and Technology (IRJET)
e-ISSN: 2395-0056
Volume: 07 Issue: 01 | Jan 2020
p-ISSN: 2395-0072
www.irjet.net
The clarity values obtained in this study are higher averaging around 6dB. In the case of South Indian classical music halls the clarity values are comparatively lower Ref (5) when compared with the values obtained in this study Fig (8)
Fig -8: Clarity 4.3 DEFINITION ( D50): Definition is the ratio of early to total sound energy. The early sound is the direct sound that arrives within 5omsec. This is expressed as = Where =50ms or 80 msec. The D50 values obtained at different frequencies are shown in the Fig (9). The desirable value is 0.7 and he values obtained are above 0.7.
Fig -9: Definition with different frequencies 4.4 LATERAL ENERGY FRACTION: Lateral energy fraction is the ratio of lateral energy received by a figure of eight microphone to the lateral energy measured by an Omni-directional microphone.
LEF= Where © 2020, IRJET
|
Impact Factor value: 7.34
|
ISO 9001:2008 Certified Journal
|
Page 1577
International Research Journal of Engineering and Technology (IRJET)
e-ISSN: 2395-0056
Volume: 07 Issue: 01 | Jan 2020
p-ISSN: 2395-0072
www.irjet.net
LEF is related to the subjective sense of spatial impression or envelopment and is inversely related to the width of the hall. Acceptable r a n g e of values l i e 0.77 <LF80< 0.2. The obtained values for this hall are within this range. 5. REFLECTION METHOD: Ref (8) Early reflections in ODEON are reflections generated by point sources while the reflection order is less than or equal to the transition order specified in the Room setup. Every time a ray is reflected at a surface the position of an image source, which may or may not give a contribution to the response at the receiver, is found. The position of this image is defined by the incident direction and the path length travelled from the source to the surface. ODEON checks each image source to determine, whether it is visible from the receiver. The first reflection starts from the source towards the stage and it takes the various paths in the stage and then it takes its path to the first row of the audience and then evenly distributed to the audience area Fig (10).
Fig - 10: Single p o i n t Ray 6. AURALISATION: The reflectogram displays the arrival of early reflections to a receiver (Fig 10). The each single reflection can be separated independently based on the early reflections. The arrival time and energy of the reflections can be determined on the reflectogram. In addition to that the direction and the surfaces involved in the reflection path are shown in reflectogram. In order to avoid the defects of echo, a particular reflection can be removed or modified. The Binaural Impulse Response of the receiver at 13m away from the sound source, it is observed that the direct sound arrives at the listener’s ears at approximately between 0.1-0.2 ms.
Fig -10: Auralisation © 2020, IRJET
|
Impact Factor value: 7.34
|
ISO 9001:2008 Certified Journal
|
Page 1578
International Research Journal of Engineering and Technology (IRJET)
e-ISSN: 2395-0056
Volume: 07 Issue: 01 | Jan 2020
p-ISSN: 2395-0072
www.irjet.net
7. CONCLUSION: An acoustical design of a large auditorium has been discussed. The study has been made through a simulation programme ODEON. Experiments have been conducted in the hall and the resulting RT values have been compared with simulated values which are in fairer agreement. A suitable identified absorption has to be incorporated in the simulation study. The diffusivity is fairly uniform in the hall. The materials incorporated in the construction have ensured better acoustic quality of the hall. REFERENCES 1. 2. 3. 4. 5.
https://odeon.dk/support/user-manual,Version 13 A.Abdou and R.W.Guy. “Room acoustic diagnosis” , JASA, Vol.100 ,No.5, Nov 1996 J.S. Bradley , A comparison of three classical concert halls , JASA, 89 (3), March 1991 J.H. Rindel, “Simulations, Measurements and Auralisations in Architectural Acoustics”, Acoustics 2013, New Delhi. Pancharatnam S and Ramachandraiah A “A Study on the Computer Aided Acoustic Analysis of an Auditorium”, IE (I) Journal-AR, 2003M. 6. Carolina Reich Marcon et al “Statistical Comparison of RT measured by the integrated impulse response and interrupted noise methods”, Applied Acoustics, 2010. 7. Sohaeldakdoky et al, “Acoustic improvement on two lectureauditoria: simulation and experiment”, Frontiers of Architectural Research (2017) 6,1-16. 8. Tansu Yilmaz, “A Acoustical Analysis Of A Multipurpose Hall By Computer Simulation Method: Metu Northern Cyprus Campus Auditorium (Ncca) As A Case Study”, M.S Thesis, The Middle East Technical University. 9. J.H. Rindel,”The use of computer modeling in room acoustics”, Journal of Vibro engineering, 2000. 10. Hiroyoshi Shiokawa,” Comparisons between Computer Simulations of Room Acoustical Parameters and Those Measured in Concert Halls”, Report of the Research Institute of Industrial Technology, Nihon University, No. 89, 2007. AUTHOR: C. Pradeepa, completed Master Degree in Architecture from SRM University with Gold medal. Currently pursuing research in Architectural Acoustics. Her publications are 11 National conference papers, 8 International conference papers and 2 Journal papers. Her achievements are Gold medal for Best best paper in Research Day 2016, SRM University and Best Poster Award, Research Colloquium, SRMIST, 2019
© 2020, IRJET
|
Impact Factor value: 7.34
|
ISO 9001:2008 Certified Journal
|
Page 1579