DATA SCIENCE APPROACH TO STOCK MARKET ANALYSIS
Sneh Patil1, Yash Bharat Jadhav2, Neel Gude3, Anish Shivram Gawde4, Mohammed Naif5, Aditi Bombe6
Abstract - Stock analysis is atechniquethataidsbuyersand sellers for investors and traders.Investorsandtradersattempt to obtain an advantage in the markets by making educated decisions by researching and assessing both historical and recent data. We only care about the information that is pertinent to us in the information-overflowing world. The material can be categorised according to a number of disciplines, including engineering, the arts, science, history, sports, geography, and economics. In these circumstances,itis crucial for us to focus on the information that is pertinent to us.[16] The information that is provided is poorly organised and only provides information on the current situation, particularly when it comes to the sector of finance. On the stock market, virtually all significant economic transactions take place at a dynamic rate known as the stock value based on market equilibrium. A precise forecast of this stocktrendin advance could result in enormous rewards.
Key Words: Data Science, Stock Market, Algorithms, Trade, Data Analysis
1.INTRODUCTION
The stock market is quite complicated and prone to volatility,anditisinfluencedbyanumberoffactors.Dueto themarket'sunpredictability,investorscanbenefitorlose money.Stockanalysisisatoolusedbytradersandinvestors toassistthemdecidewhattopurchaseandsell.Investors andtradersstrivetoobtainanadvantageinthemarketsby making educated decisions by researching and analysing both historical and recent data. A precise forecast of this stock trendinadvancecouldresultin enormousrewards. [14,21]Twostrategiesareusedinthispapertoachievethe prediction.Utilisingdifferenttechnicalindicatorsisoneof them. These technical indicators are used to predict upcomingshiftsinstocktrend.[21]Thetechnicalindicators usedinthisstockmarketforecastingtoolwillsubstantially supportthepredictability.
Thesecondstrategy,whichisbasedontheHiddenMarkov Model,ismoreprobabilistic.Thismodelhasbeenbroadand is more suited for dynamic systems. used when solving patternrecognitionissues.[22,23]Itisfocusedonstatistical techniquesandhasarobustcapacityforhandlingnewdata. Basedonhistoricaldatasetsthatcomplementcurrentstock price behaviour, this model interpolates the two datasets using suitable neighbouring price elements.[16, 15] As a result, a prediction is made regarding the variable of interest'sstocktrendtomorrow.[22]Fundamentalanalysis, which considers the financial performance of the specific
firmweareanalysingaswellassignificantfinancial news regarding the company, can be used to analyse the stock market.[14]Thisleadsustonewsanalysis,wherewemust parsethroughallthepertinentcompanynewsandpapersto obtainthenecessarydatasothatwecandecidewhetheror nottoinvest.The"TheoryofDemandandSupply"underlies thefunctioningofthestockmarket[12,18].Itassertsthat supplyanddemandarealwaysnegativelycorrelated.[18]As a result, as demand rises, purchasers seize control of the stockmarket,whichthenturnsbullish.Ontheotherside,as soonassupplyentersthemarket,sellersseizecontroland stock prices begin to decline sharply. The "Head and ShoulderTheory"[18],whichstatesthatthehighestpriceof anystockisconsideredtheheadandthenextpeakhighis called the shoulder, can also be used to analyse the stock market.Themajorityoftheindicatorswe'llencounterinthis study have a statistical basis. As a result, each technical indicator'sdesignstepinvolvessomeassumptions.
2. UNDERSTANDING STOCK MARKET
Althoughpracticallyanythingcannowbepurchasedonline, each commodity often has its own market. For instance, individuals travel to farms and the outskirts of cities to acquire Christmas trees, go to the neighbourhood timber market to buy wood and other supplies for house renovations,andshopatWalmartfortheirweeklygroceries. Such a focused marketplace acts as a venue for various buyers and sellers to connect, communicate, and conduct business. One can be sure that the pricing is fair because therearesomanymarketparticipants.Forinstance,ifthere isonlyoneChristmastreevendorintheentirecity,hewill befreetochargewhateverhewantsbecausetherewillbe nowhere else for customers to go. If there are many tree sellers in a single marketplace, they will have to compete withoneanothertodrawcustomerstopurchasetheirgoods. It will be a fair market with transparent pricing because purchasers will have a wide range of options. Even when buying online, customers compare prices from several merchants on the same app or across different apps or websites to find the greatest offers, which compels the different online vendors to provide them the best deal. A stockmarketisacomparablevenuesetasideforthetrading ofvarioussecuritiesinaregulated,secure,andcontrollable setting.Thestockmarketensuresfairpricingpractisesand transparencyintransactionsbybringingtogetherhundreds ofthousandsofmarketplayerswhowanttopurchaseand sell shares of various companies. Modern computer-aided stock markets operate electronically, which makes them more and more advanced. Earlier stock markets used to
workontheissueandtransactinpaper-basedphysicalshare certificates.
In short, stock markets offer traders a safe, regulated environmentwheretheycanconfidentlytradesharesand other permissible financial products with little to no operationalrisk.Thestockmarketsfunctionasbothprimary and secondary markets while adhering to the regulator's establishedguidelines.Thestockmarket,whichservesasa primarymarket,enablesbusinessestoissueandselltheir shares to the general public for the first time through the initial public offering (IPO) procedure. This practise aids businesses in obtaining the funding they want from investors. Itbasicallyimpliesthata businessdividesitself intoacertainnumberofshares,suchas20million,andsells a certain portion of those shares, such as 5 million, to the general public at a certain price, such as $10 a share. A corporationneedsamarketwherethesesharescanbesold tomakethisprocesseasier.Thestockmarketprovidesthis marketplace. If everything goes according to plan, the corporation will sell the 5million shares at a price of $10 each and make a profit of $50 million. In anticipation of growing share prices and any prospective income in the formofdividendpayments,investorswillreceivebusiness sharesthattheycananticipatetoholdforthetermoftheir choice. The corporation and its financial partners pay the stock market a fee for its services as a facilitator of this capital-raisingprocess.
The stock exchange also acts as the trading platform that enablesroutinebuyingandsellingofthelistedsharesafter thefirst-timeshareissuanceIPOexercise,alsoknownasthe listingprocess.Thesecondarymarketiscomprisedofthis. Every trade that takes place on the stock exchange's platform during secondary market activity generates a chargeforthestockexchange.Thetaskofguaranteeingprice transparency,liquidity,pricediscovery,andfairdealingsin such trading activities falls to the stock exchange. The exchangemaintainstradingsystemsthateffectivelymanage the buy and sell orders from diverse market participants becausenearlyallmajorstockmarketsacrosstheworldnow operate electronically. In order to facilitate transaction executionata pricethatisfairtobothbuyersandsellers, theycarryoutthepricematchingfunction.Alistedfirmmay later conduct other offerings, such as follow-on offers or rights issues, to issue new, extra shares. They might even buybacksharesortakethemoffthemarket.Suchtradesare facilitatedbythestockexchange.TheS&P500indexandthe Nasdaq 100 index, which provide a gauge to follow the movementofthewholemarket,areonlytwoexamplesofthe numerous market-level and sector-specific indicators that thestockexchangefrequentlydevelopsandmaintains.
Thestochasticoscillatorandstochasticmomentumindexare othertechniques.Allcorporatenews,announcements,and financial reporting are also maintained by the stock exchangesandaretypicallyaccessibleontheirsites.Various
additionalcorporate-level,transaction-relatedactivitiesare alsosupportedbyastockmarket.Profitablebusinesses,for instance, may reward investors by providing dividends, which are often derived from a portion of the company's profits.Allofthisinformationismaintainedbytheexchange, which also has the potential to facilitate some of its processing.
2.1 Interval
Every second, there are millions of trades made in the market.So,inordertoanalysethedata,wemustcategorise thesetradesaccordingtothetimeandperiodinwhichthey occurred.Thesetradescanbedividedintoshort-termand long-term time frames. One minute, two, five, ten, fifteen, thirty,andsixtyminutesareadditionalcategoriesforintraday. Long-term intervals fall within the daily, weekly, monthly,andsoforthcategories.CounttheCostsAnystock willbeassociatedwith4differentpricecategoriesatevery interval.High,Low,Open,andClosepricesarealldisplayed. The greatest value at which it was exchanged during that periodoftimeiswhatismeantbythehighprice.Thebargain pricerepresentsthelowestamountitwentforduringthat time.Thepriceatwhichthestockwaslasttradedduringthat intervalisknownasthe"closeprice,"whilethe"openprice" referstothefirstdealthatoccurredduringthatperiod.
2.2 Trend
Anystock'sdemandatanyonetimemaybehigherthan itssupplyorlowerthanitsavailablesupply,dependingon the trend. As a result, we can divide this Trend into two categories,namelyBearishandBullish.Whenthereismore demandthansupplyatagivenperiod,astockissaidtobein abullishtrend.Astockissaidtobeinabearishtrendifthere isagreateravailablesupplythanthereisdemand.
3. ANALYSIS OF STOCK MARKET
The most prevalent application of algorithmic trading is high-frequency trading (HFT). Trading involves buying a potential share at a discount and then selling it at the market'stopgrowthrate.Toascertainthestock'spotential, athoroughstatisticalverificationandstockresearchprocess is used. The factors that affect this trade activity include time, price, volume, and technical indicators. The trading choiceshouldtakehumanparallaxerrorsintoconsideration at every stage. In the case of algorithmic trading, these actions are specifically planned to maximize profit while loweringriskineachtradingtransaction.Thealgorithmcan process in a timely cycle, allowing it to complete more transactionsinagiventimeframe.
3.1 Basic Technical Trading Signals
We can assess market activity and predict future market behaviourthankstoseveralcrucialtechnologicaltoolsofthe trade.
MovingAverageConvergenceDivergence(MACD):After the trading circumstances have been created, moving averageconvergenceanddivergence(MACD)indicators giveindications.knownalsoasatrailingsignal.
Aroon Indicator: The Aroon Indicator tracks the new highs and lows in the price movement of the market trend.
The Average Directional Index (ADI): A price moving trend's momentum and intensity are gauged by the Average Directional Index (ADI). The directional strengthisstrongwhentheADXvalueismorethan40. Whenitdropsbelow20,thevigouriswaning.
AccumulationorDistributionLine(A/D):Thismeasures the volume of trades in a security over time. accumulation and dispersion across either a short, medium,orlongdistance.
OnBalanceVolume(OBV):isametricthatmeasuresthe volume of securities across time while accounting for positiveandnegativeflows.
Relative Strength Index (RSI): These leading signs, known as the Relative Strength Index (RSI), appear beforetrade-relatedsituations.
DMI (Directional Movement Indicator): A price indication that contrasts the current share price with the prior price range is known as a DMI (Directional Movement indication). The positive figure denotes an increaseinprice,whereasthenegativevaluedenotesa decreaseinprice.
MovementofTrendlines:Overtime,atrendlineshows theuphillanddownhillchangesinmarketvalues.Create a collection of practises for using trading logistics to purchaseandsellstocksonthemarket.Next,askyour stock broker for API connectivity so you may submit bidsrightaway.Althoughitmightseemsimple,ittakes alotoftimeandefforttocreateatradingbotthatcan make millions through high-frequency trading, somethingthathumanscannotdo.
3.2 Stock Market Analysis Using Data Science
Everywhereyoulook,youcanreadaboutthepowerofdata science. The problem of data affects everyone. Businesses areinterestedinlearninghowdata could potentiallysave expenses and improve their bottom line. The healthcare industryiscuriousabouthowdatasciencemighthelpthem identifyailmentsearlierandtreatpatientsmoreeffectively. Datascienceisfrequentlyrepresentedbynumbers.These numbers, however, could apply to anything, such as the number of customers who purchase a product or the quantity of commodities sold. Of course, these numbers couldalsorepresentmoney.Inordertodevelopadistinctive
perspective on the stock market and financial data, data scienceisbeingusedinthismanner.Stocks,commodities, andsecuritiesall abideby thesamebasicprinciples.Over thepast20years,tradingplatformshavebecomemoreand morepopular,buteachonehasitsownfeatures,resources, and fees. Canadians still lack access to zero-commission tradingplatformsdespitethisgrowingtrend.Ina12-month study,GaryStevensofHostingCanadaexaminedthefeatures that each of the most well-known stock trading platforms providestoitsusers.Tomakethegreatestdecisionforyou, youmustcomprehendhowtheywork,andGary'sin-depth explanation may help you with that. We wholeheartedly endorsethisarticlefromTheBalanceifyou'reinterestedin learningmoreaboutCanadianETFs.
RecognisingBasicDataScienceIdeasintheStockMarketIn data science, there are a number of idioms that only scientistswouldcomprehend.Datascienceisjustmathsplus adashofprogrammingandstatisticsskills.
Algorithm: Data science extensively makes use of algorithms. A task-completion algorithm is essentially a seriesofinstructionsthatmustbefollowed.Probability is thatyouareawareoftheemploymentofalgorithmsinthe buying and selling of stocks. Using algorithms to decide whentobuyorsellstocksisknownasalgorithmictrading. Forinstance,astockmaybeprogrammedintoanalgorithm tobeboughtifitdropsby8%duringthecourseofthedayor sold if it loses 10% of its value since being purchased. Algorithmsaredesignedtofunctionwithouttheassistance of humans. They are commonly referred to as bots. They behavemuchlikerobotswhilemakinglogicaldecisions.
Training: We're not discussing running a 50-meter dash. Trainingistheprocessofusingdatatoeducateasystemhow toreactinmachinelearninganddatascience.Weareableto createalearningmodel.Acomputercannowmakeprecise predictions based on historical data thanks to machine learning.Youwillneedamodelofthestockvaluesfromthe previousyeartoserveasafoundationtopredictwhatwill happenifyouwanttoteachacomputertoestimatefuture stockprices.
Testing: ThetrainingsetwouldbethedatafromJanuaryto October.Then,we'llruntestsinNovemberandDecember. The predictions made by the computer will be contrasted withactualprices.
The modeling used to Predict Stock Prices: The foundationofdatascienceismodelling.Withthisapproach, pastactionsareanalysedmathematicallyinordertopredict futureoutcomes.Inthestockmarket,atimeseriesmodelis used. A time series is a collection of data that is indexed acrosstime,inthiscasethevalueofastock.Itispossibleto divide this time span into hours, days, months, or even minutes.Bygatheringpricingdatausingmachinelearning and/or deep learning methods, a time series model is created.Beforefittingthemodeltothedata,analysisofthe
dataisrequired.Thisiswhatmakesitpossibletoanticipate futurestockvaluesoveracertainperiodoftime.Asecond typeofmodellingusedinmachinelearninganddatascience is a categorization model. These models attempt to categorise or anticipate what is represented by the data points when they are provided input. A machine learning modelmaybegivenfinancialinformationliketheP/Eratio, totaldebt,volume,andotherfactorstodeterminewhether ornotastockisagoodinvestmentwhentalkingaboutthe stockmarketorstocksingeneral.Basedonthefinancialdata wesupply,a model can determineif itis the righttime to sell,hold,orbuyastock.It'spossibleforamodeltoforesee something so complex that it ignores the relationship betweenthefeatureandthedesiredoutcome.Overfittingis thetermforthis.Whenamodeldoesnotaccuratelyreflect the data, it is said to be underfit, which leads to overly straightforwardforecasts.Ifthemodelhastroubledetecting stockmarketpatterns,overfittingisanissue.Whenamodel predictsthefundamentalaveragepricebasedontheentire historyoftheasset,underfittingoccurs.Poorforecastsand projections are the outcome of both overfitting and underfitting.Wehaveonlybeguntoexploretheconnections betweenstockmarketinvestmentandtheideasofmachine learning.Butit'simportanttounderstandthefundamental ideaswecoveredtodaysincetheylaythegroundworkfor realisinghowmachinelearningisusedtopredictwhatthe stockmarketcando.Therearemoresubjectsavailablefor thosewhowishtogointothedetailsofdatascienceandhow itrelatestothestockmarket.
4. DATA SCIENCE IN STOCK MARKET
Numerous thingscanberepresentedbythenumbersthat areusuallyusedtorepresentdata.Thesenumberscouldbe for sales, inventory, clients, and last but not least, money. Thisbringsupfinancial information,specificallythestock market.Stocks,commodities,securities,andothertrading instrumentsarelargelycomparable.DataScienceusesalot ofterms,expressions,andjargonthatmanypeoplearenot familiarwith.Weareavailabletoassistwithallofthat.Data science requires a working knowledge of mathematics, statistics,andprogramming.I'llprovidelinkstonumerous resources throughout the text if you want to read more about these ideas. Let's go right to what we all wanted to know now: how to build market evaluations using data science. To decide whether a stock is worthwhile for investment, we employ analytics. Now let's go over some datascienceconceptsthathavetodowithmoneyandthe stock market.Thefieldsof data scienceandprogramming frequentlyusealgorithms.Asetofguidelinesthatmustbe followedinordertofinishaspecificactivityisknownasan algorithm.
Agrowingtrendinthestockmarketisalgorithmictrading, as you may have heard. Trading algorithms used in algorithmictradingincludeparameterslikebuyingastock onlywhenithasdeclinedbyexactly5%thatdayorsellinga
stockonceithaslost10%ofitsvaluesincebeingbought.All ofthesealgorithmshavetheabilitytofunctionwithoutthe assistance of a person. Since their trading strategies are largelymechanicalandtheytradewithoutemotion,theyare occasionally referred to as trading bots. Programming, mathematics, and business are all combined in the multidisciplinary field of data science and analytics. You needtounderstandbothwordsbeforeyoucandistinguish betweenthem.Therefore,let'sstartwithdatascience.The term "data science" is used to refer to a wide range of approaches and strategies for obtaining information. In plainer language. Data science is a field that consists of a varietyoftools,machinelearningstrategies,andalgorithms forfindingpatternsinunstructureddata.Dataanalyticsisa processforincreasingoutputandrevenue.Inthispart,data sets are examined in order to draw conclusions about the information they contain. Information is extracted, categorised,andsubjecttovariousapproachesdependingon organisationalneedsinordertodiscoverandassessconduct information.Itwasalsoknownasdataanalysis.
Data Scientist: Computertechniqueslikeneuralnetworks and machine learning, as well as knowledge of Applied Statistics, Data Mining, are all necessary. It's vital to be familiarwithdatabasearchitectureslikeMySQL,Hive,and others.Datascienceisusedinavarietyofscenarios,suchas online searches and digital advertising. The progress of machinelearningandAIdependsondatascience.Thendata analystsconstructanalgorithmusingthedata.
Data analysts: The ability to retrieve and query data is necessary.Datablending,datapurification,datadiscovering, anddata visualisationareamonga data analyst'sprimary responsibilities.Itiscrucialtohaveabasicunderstandingof statistics.Thebestindustriesfordataextractionbyanalysts includehealthcare,gaming,andretail.
5. PATTERNS IN STOCK MARKET
ContinuationPatterns: Anongoingtrendcanbeconsidered tocometoanendwithacontinuationpattern.Thishappens wheneverabullmarketpausesduringanupswingorabear marketpausesduringadownturn.Whenapricingpattern begins to take shape, it is impossible to tell whether the trend will last or turn around. To determine if the price breaksaboveorbelowthecontinuationzone,aswellasthe trendlinesthatwereemployedtocreatethepricepattern, pay great attention. Technical analysts frequently predict thatatrendwilllastaslongasitcannotbedemonstratedto havechanged.
Reversal patterns: arepricingpatternsthatshowachange inthedirectionofthepresenttrend.Whenthebullsorbears havepeaked,thesepatternsshowit.Theexistingtrendwill halt before continuing in a new direction as fresh energy emergesfromtheopposingside(bullorbear).
Pennant: Pennants are continuation patterns that are created when two trendlines cross. Pennants are characterizedbytrendlinesthatmoveinoppositedirections, oneupandonedown.Belowisanillustrationofapennant. Frequently,thevolumewill decreasewhilethepennant is built and then increase when the price eventually breaks through.Abearishpennantpatterndenotesapricetrendin thenegativedirection.Volumeisdecreasing,andaflagpole forms on the right side of the pennant, forming a bearish pattern.
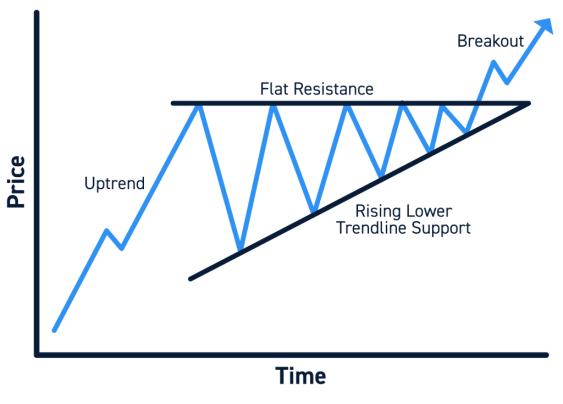
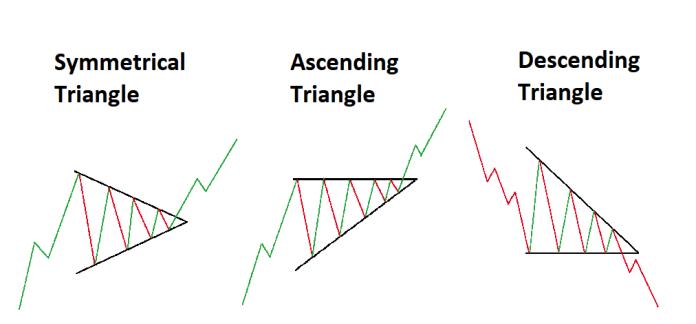
Ascending Triangle: A trend continuation pattern with a stated entry point, profit target, and stop loss level is an ascending triangle. The entrance point is where the resistance line crosses the breakout line. An ascending triangleisabullishtradingpattern.
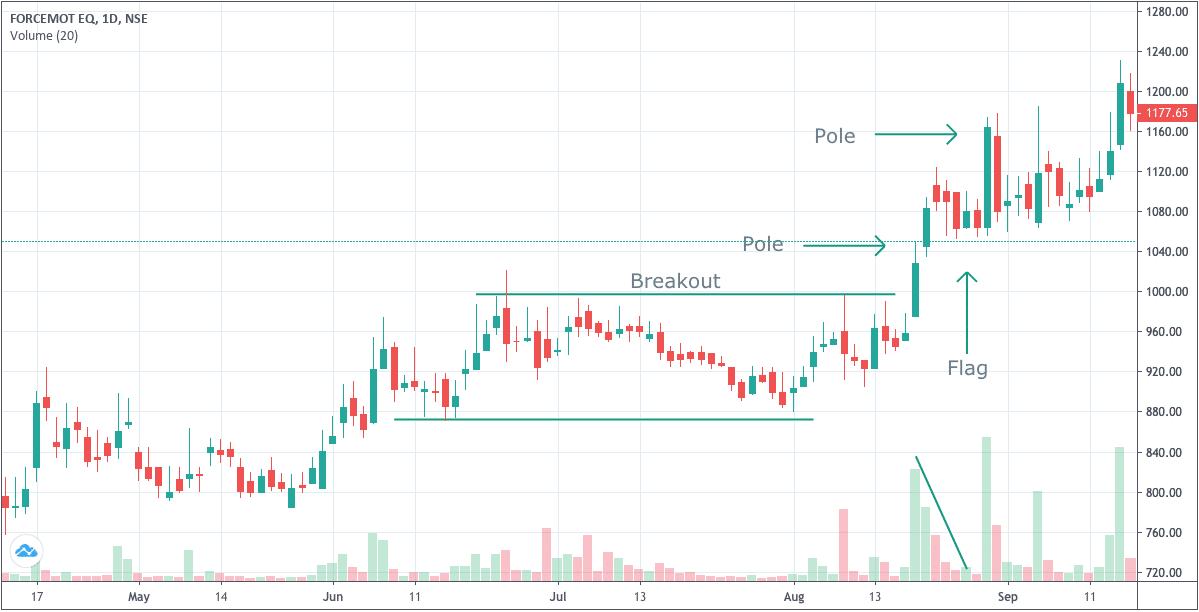
Flag: Flag patterns consist of two parallel trendlines that may be inclined upward, downward, or horizontally. In contrast,aflagwithadownwardbias(bearish)showsasa breakinanuptrendingmarket.Aflagwithanupwardslope (bullish)appearsasastandstillinadowntrendingmarket. Usually,whenaflagformdevelops,thereisareductionin volumethatisfollowedbyariseinvolumewhentheprice breaksoutoftheflagshape.
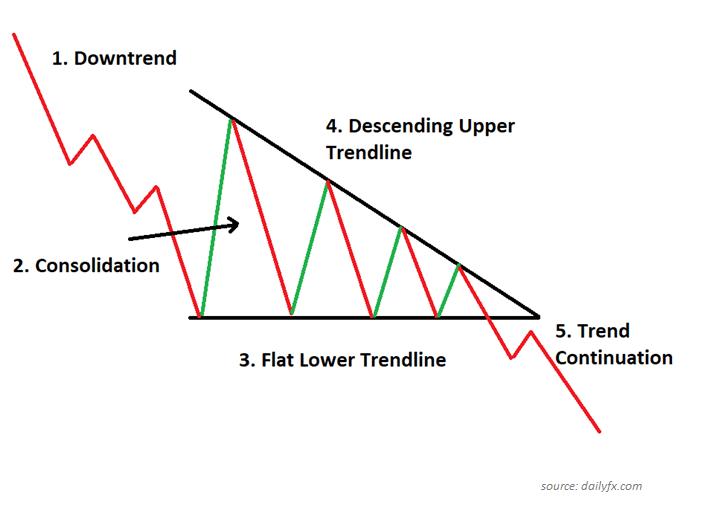
Descending Triangle: A descending upper trend line suggeststhatacollapseisabouttooccur,andadescending triangle is the opposite of an ascending triangle in that it suggestsdecliningdemand.
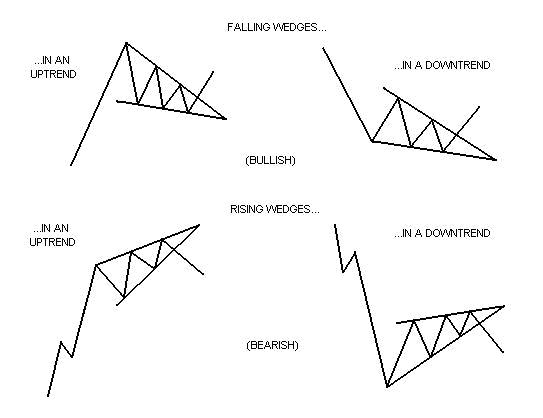
Wedge: Pennants and wedges are both continuation patterns made of two trendlines that are convergent; however, a wedge differs from a pennant in that both trendlines are moving in the same direction, either up or down.Awedgewithadownwardslopedenotesabreakinan upswing,whereasonewithanupwardslopedenotesapause in a downturn. while with pennants and flags, volume frequentlydeclineswhilepatternsformbeforerisingafter thepricebreaksaboveorbelowthewedgepattern.
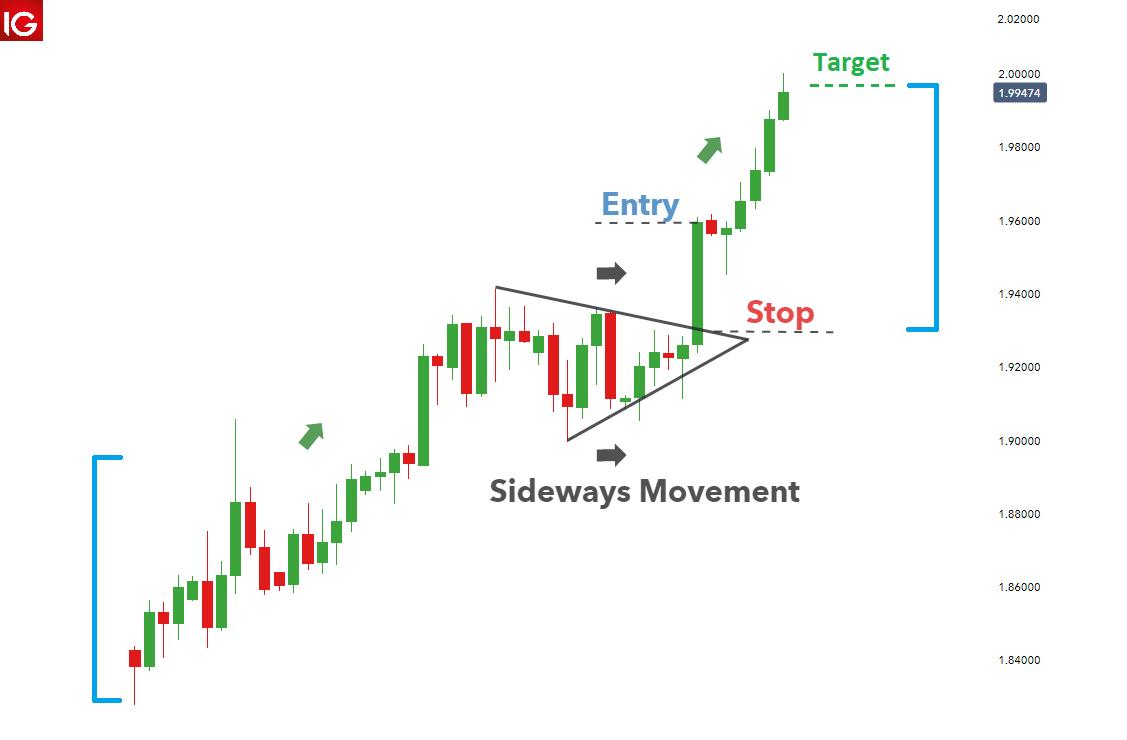
Symmetrical Triangles: There is neither an upward nor downward trend in symmetrical triangles, which emerge whentwotrendlinesconvergeintheirdirectionandsignal animpendingbreakout.Asshownintheillustrationbelow, the size of the breakouts or breakdowns is frequently the sameastheheightofthetriangle'sleftverticalside.
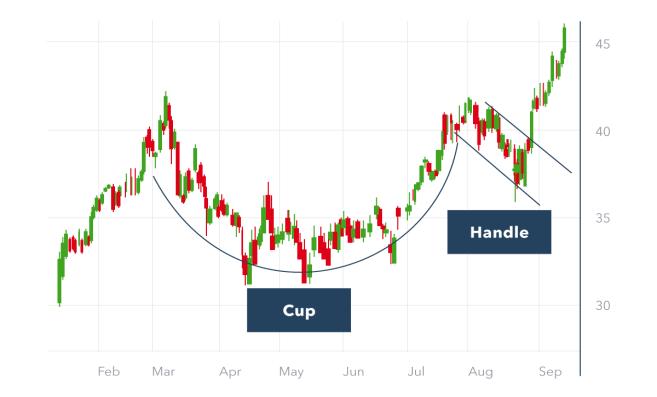
Handle and Cup: Abullishcontinuationpatterncalledthe cupandhandleshowsthatanupwardtrendhashaltedbut will pick up again if the pattern is confirmed. The "cup" portionofthedesignshouldbea"U"shapethatresembles the roundingofa bowl rather thana "V"shape with equal highsonbothsidesofthecup.
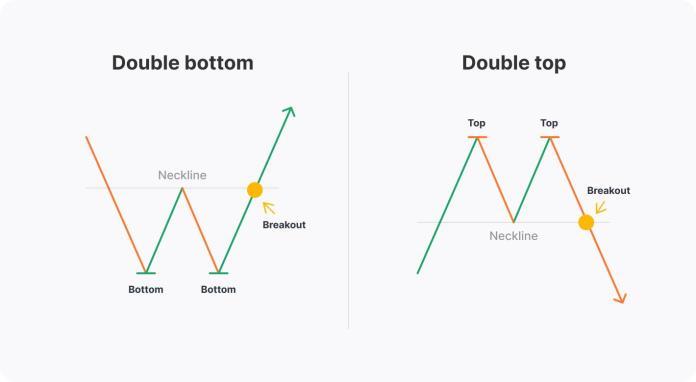
Double Top and Bottom: These reversal patterns show areaswherethemarkethastwicefailedtobreakthrougha supportorresistancelevel.Theyareusedtoidentifythese areas.Adoubletopischaracterisedbyaninitialpush-uptoa resistancelevel,followedbyasecondunsuccessfulattempt, whichresultsinatrendreversal.Itcommonlyresemblesthe letterM.
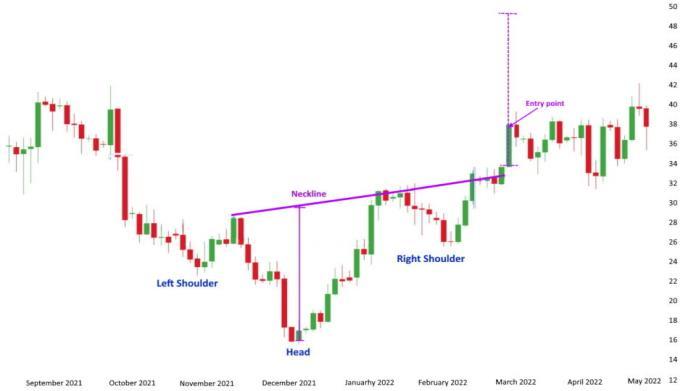
Head and Shoulders: Areversalpatternknownasthehead andshoulderscanappearatmarketpeaksorbottomsasa series of three pushes: an initial peak or trough, a second, largerone,andathirdpushthatrepeatsthefirst.Aheadand shoulderstoppatternhasthepotentialtoreverseanuptrend andstartadecline.Itisalmostcertainthatanupwardtrend willresumeafteradeclinethatformsaheadandshoulders bottom(oraninvertedheadandshoulders).Asseeninthe imagebelow,trendlinescanbebuilttoconnectthepeaksand valleysbetweentheheadandshoulders.Thesetrendlinescan behorizontalorslightlyslanted.Volumemaydecreasewhile thepatterntakesshapeandthenriseafterthepricingpattern isbroken.
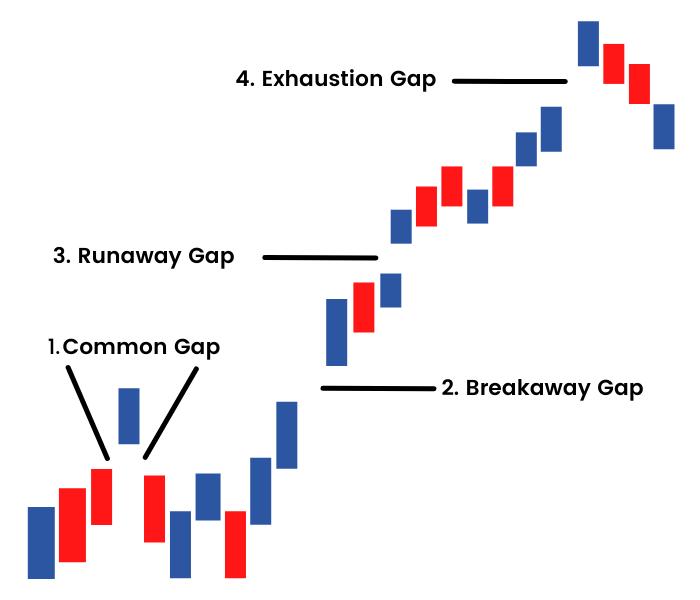
Gaps: Patterns of reversal are gaps. They appear if a significant price increase or decrease occurs between two trading periods. For instance, a stock may close at $5 and open at $7 after great results or other news. The three primary categories of gaps are fatigue, runaway, and breakawaygaps.Breakawaygaps,runawaygaps,andfatigue gaps all appear during the beginning, middle, and end of trends,respectively.
6. CONCLUSION
Technical analysis seeks to forecast future changes in financial price based onpastprice movements. Because it doesn'tgenerateprecisepredictionsaboutthefuture,think of technical analysis as being analogous to weather forecasting.Technicalanalysis,ontheotherhand,canhelp investorsmakepredictionsaboutwhatwill"likely"happen topricesovertime.Stocks,indexes,commodities,futures,or anyothertradableassetwhosepriceisinfluencedbysupply and demand dynamics can all be subject to technical analysis.Pricedataisanycombinationoftheopen,high,low, close, volume, or open interest for a certain asset over a
specificperiodoftime(or,asJohnMurphyprefers,"market action"). The price information might be daily, weekly, or monthlyaswellasintraday(1-minute,5-minute,10-minute, 15-minute,30-minute,orhourly).Manytechniquessuchas MachineLearningandDataSciencecanbeusedtopredict Stock Market but it can and will never be predicted with 100%accuracy.
REFERENCES
[1] S.Kamil,A.Pinar,D.Gunter,M.Lijewski,L.Oliker,J. Shalf,"ReconfigurableHybridInterconnectionforStatic andDynamicScientificApplications",ACMInternational ComputingFrontiers,2007.
[2] IPMHomepage:http://ipm-hpc.sourceforge.net/
[3] C. Bell, D. Bonachea, R. Nishtala, K. Yelick, “OptimizingBandwidthLimitedProblemsUsing
[4] Robert W. Wisniewski, Peter F. Sweeney, Kartik Sudeep,MatthiasHauswirth,EvelynDuesterwald,Calin Cascavel, and Reza Azimi, "Performance and Environment Monitoring for Whole-System CharacterizationandOptimization",PAC2(Conference on Power/Performance interaction with Architecture, Circuits,andCompilers),2004.
[5] G.Bell,J.Gray,A.Szalay,“PetascaleComputational Systems,” IEEE Computer, Volume: 39, Issue: 1 Jan. 2006,pp110-112.
[6] William T.C. Kramer, John Shalf, and Erich Strohmaier,“TheNERSCSustainedSystemPerformance (SSP) Metric,” LBNL Technical Report LBNL-58868, September2005.
[7] S. Kamil, J. Shalf, L. Oliker, and D. Skinner, “UnderstandingUltra-ScaleApplicationCommunication Requirements,” in Proceedings of the 2005 IEEE InternationalSymposiumonWorkloadCharacterization (IISWC),Austin,TX,Oct.6–8,2005,pp.178–187.(LBNL58059)
[8] Krste Asanovic, et. al., “The Landscape of Parallel ComputingResearch:AViewfromBerkeley,Electrical EngineeringandComputerSciences,”theUniversityof CaliforniaatBerkeley,TechnicalReportNo.UCB/EECS2006-183, December 18, 2006. ( http://view.eecs.berkeley.edu/)