Identification, Discrimination and Classification of Cotton Crop by Using Multispectral imagery using complete enumeration approach over Haryana state
Om Pal1 , Hemraj1
1Haryana Space Application Centre, Hisar, India ***
Abstract - The accurate and timely crop production forecast plays a pivotal role in management for taking the decision related to import, export etc. by the policy makers which may be very helpful for enhancing productivity, resource allocation, and sustainable land management. The cropproductionforecastcomprisesmainlycropareaandyield assessment. In recent years, crop classification and area assessment using remote sensing and GIS techniques have gainedprominenceduetotheirnon-invasiveandcost-efficient nature.Theuseofmulti-spectraldataoperatinginthevisible and near infrared region of electromagnetic spectrum is widely used for the crop area, health and condition assessment. This research paper presents an in-depth exploration of cotton crop classification and area estimation using single date multi-spectral imagery by employing complete enumeration approach in major cotton growing districts of Haryana. The study investigates the potential of optical data for accurate cotton crop identification and monitoring. The paper discusses the methodology, data acquisition, feature extraction, classificationalgorithms, and showcasing their applicability in different agricultural contexts. Through an extensive review of existing literature and empirical analysis, the study suggests the implication of supervised classification technique and the role of remote sensing and GIS based technology in enhancing agricultural crop management.
Key Words: Agriculture, Cotton crop, Optical data, SupervisedClassification,GIS,Areaestimation
1. INTRODUCTION
Cotton, a vital cash crop, plays a crucial role in the global economybyprovidingrawmaterialforthetextileindustry. Temporal monitoring the growth stages and crop health assessmentofcottoncropisessentialforoptimizingyield and resource utilization. Traditional methods of crop assessmentusingfieldsurveyislabour-intensiveandoften may be lacking of accuracy due to human intervention. In recent years, remote sensing technologies coupled with advanced machine learning techniques have emerged as powerfultoolsforcropclassificationandmonitoring.Optical data from satellite and drone-based sensors provide valuableinformationaboutthespectralreflectanceofcrops. These temporal data sources offer insights into various physiological and biochemical changes within the plants.
Multispectralandhyperspectraldata,aswellasvegetation indices such as NDVI (Normalized Difference Vegetation Index), have been widely utilized in crop classification studies[1],[2].
Machine learning algorithms have shown remarkable success in analysing optical data for crop classification. Maximum Likelihood, Convolutional Neural Networks (CNNs),RandomForest,SupportVectorMachines(SVMs), and k-Nearest Neighbors (k-NN) are commonly employed for feature extraction and classification [3], [4]. Accurate identification of cotton growth stages is crucial for timely crop assessment. Optical data can assist in distinguishing betweenstagessuchasplanting,emergence,flowering,boll development, and senescence. Machine learning models trainedonannotateddatasetscanaccuratelyclassifythese stages[5].Earlydetectionofpestinfestationsanddiseasesis vital for preventing yield losses. Optical data can reveal stressindicatorsandanomaliesincottonfields.Integration ofspectraldatawithmachinelearningalgorithmsenables the assessment of health conditions, facilitating targeted treatment[6]
Geographical information system and satellite-based imageriesarehelpfulforidentificationanddemarcationof cottoncropfromotherassociatedlandcoverfeaturesthus capableofgeneratingthecropmapwhich isusedasbasic input for further crop health and yield assessment. This study demonstrates the potential of using high resolution imageryofSentinel-2fortheidentification,discrimination anddemarcationofcottoncropfromotherassociatedland coverclasses.
2. STUDY AREA AND DATA
2.1 Study Area
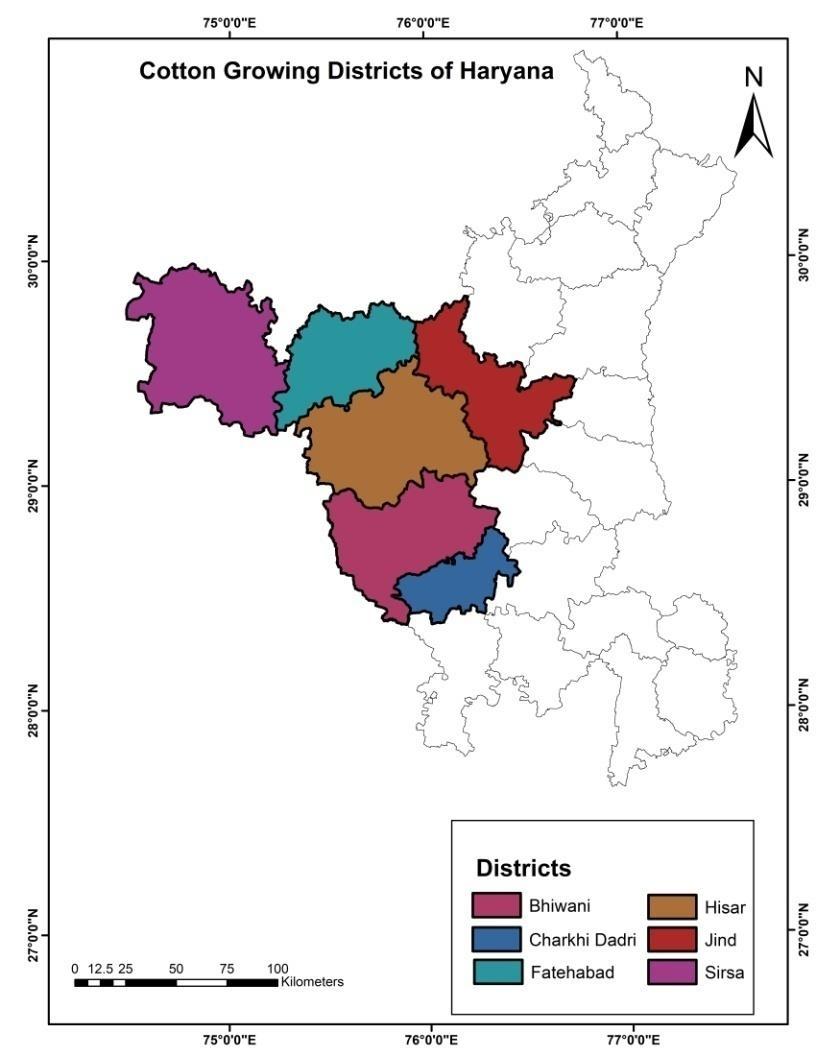
Thestudyareaissituatedintheextremewestandsouthern part of Haryana state consisting of major cotton growing districtsviz.,Bhiwani,CharkhiDadri,Fatehabad,Hisar,Jind and Sirsa (Figure 1) and covering total geographical area around18,278Kilometresquare.Thestudyarealiesbetween the27degree37'to30degree35'latitudeandbetween74 degree28'to77degree36'’longitudes.Themeanelevation of the area is 190 to 210 above sea level with annual precipitationof32-53mm.Theclimateofstudyareaissemi-
2023, IRJET | Impact Factor value: 8.226 | ISO 9001:2008

arid, sub-tropical and continental in monsoon. The soil textureofthestudyareavariesfromsandtosandyloamand siltclayloamalongtheghaggarriverbelt.Thestudyareahas a diverse topography ranging from plains, alluvial bed of ghaggar belt to sand dunes. The study area comprises of typesofunconsolidatedalluvialdepositsofQuaternaryage geographicalformations.The70%oftotalgeographicalarea ofthestudyareaiscoveredbytheagricultural fields. The majorcropsgrowninstudyareaareWheat,Mustard,Gram, Paddy, Cotton, Citrus, Guava and Indian Jujube. The study areacoversalmost80%oftotalcottoncropareaoftheentire state.TheCottoncropisgrownduringkharifseasonhaving paddy and bajra as the main associated crops. Do not use abbreviations in the title or heads unless they are unavoidable.
at temporal resolution of 5 days with spatial ground resolutionof10meter.Groundtruthdatawasalsousedto identify the signature of cotton and associated land cover featuresfordiscriminatingandclassification.
3. METHODOLOGY
3.1 Selection of Optimum Data
As classification of a particular crop requires majorly its differentiationfromassociatedcrops. Sodifferentiation of particularcropwithhighaccuracyrequirestheselectionof optimum data. The ancillary data related to cotton crop phenology and multi-date high resolution satellite data coveringtheall-mainphenologicalstagesofcropwasused to select the optimum data for the discrimination and delineation of the cotton crop from other geo-spatial features.Multi-dateSentinel-2Adataforthestudyareawas alsousedtomonitorthedynamicsofvegetationareaslike forest,paddyandcottoncropandtoselecttheoptimumbiowindowforcottoncropidentification.Aftertheanalysisof multi-temporalsatellitedata,itisobservedthedataacquired in the month of September was the most appropriate for identificationanddelineationofcottoncropfromtheother land cover classes and also to derive vegetation vigour variationwithinthecottoncrop.Thedistrictboundarywas overlaid on the image to extract the crop mask. The supervised classification technique was performed to delineatethecottoncrop.
3.2 Image Stacking and Database
TheSentinel-2Adatawasdownloaded.Afterlayerstacking district boundary was overlaid for sub-setting the study area.Thegroundtruthdatarecordingtheinformationofall landcoverfeatureswascollectedusingGPSandthecollected locationsoverlaidonsatelliteimagerywereusedtoidentify the signature of crops. Figure 2 show the flow chart depictingthemethodology.
2.2 Data Used
Sentinel-2A MSI data is used for the identification and discrimination of cotton crop in the major cotton growing districtsofHaryanaviz.,Bhiwani,CharkhiDadri,Fatehabad, Hisar, Jind and Sirsa. This data was downloaded from the Copernicus website (https://scihub.copernicus.eu/dhus/#/home) from SeptembertoOctober,2022.Sentinel-2Ahavingopticaldata
4. RESULT AND DESCUSSION
As mentioned in the Methodology crop identification and classificationwascarriedoutusingmulti-spectralsatellite imagery. The collected Ground truth data was used to identifythesignatureofcottonandassociatedcropsandalso forcheckingtheaccuracyofclassifiedmask.

After analysing the crop pattern and crop phenology the satelliteimageryacquiredinthe1stfortnightofSeptember was selected for the crop identification and classification. Firstly, unsupervised classification technique was carried out on the multi-spectral dataset to identify the land use classesandtheagriculturalcropmaskwasgeneratedforthe studyarea.Withinthecropmask,thesignatureofthecotton andassociatedcropswereidentifiedusingthegroundtruth sites and then supervised classification approach by selectingmaximumlikelihoodclassifierwasfollowedforthe classificationofimagery.ThespectralprofileoftheCotton crop and associated land cover features is depicted in the Figure 3.TheCottoncropcaneasilybediscriminatedfrom the land cover classes like settlement, fallow land, water bodiesetcasillustratedinthespectralprofiledepictedinthe Figure 3.
InthestudyareaBajraandPaddyarethemainassociated crops. As the selected imagery coincides with the peak vegetativestageoftheCottoncropsoasdepictedinthefig, the cotton crop has high reflectance in the NIR region as

compared to its associated crops. The bajra crop has low reflectancewhichfurtherdecreasesintheimageryacquired in2ndfortnightofSeptember.OntheotherhandPaddycrop also has low reflectance (Figure 3) which further may increaseslightlyintheimageryacquiredinthe2ndfortnight ofSeptember.Theanalysisshowsthatusingthesingledate multispectral imagery the desired crop can easily be discriminated with its associated crops with acceptable accuracy.
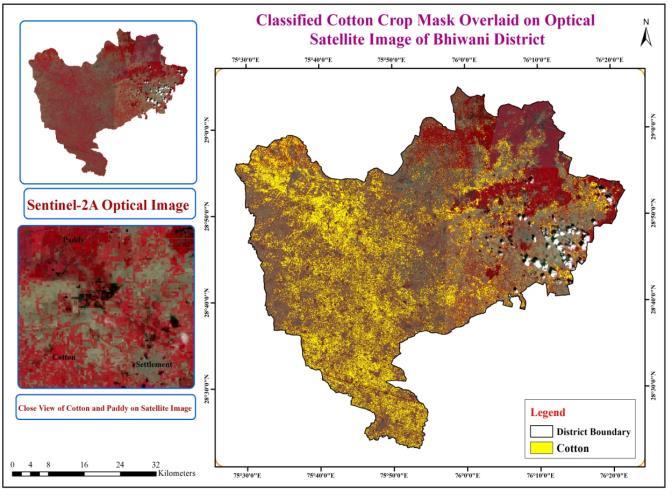
Afterclassificationdistrictwiseareaunderthecottoncrop was estimated as depicted in table 1. The crop classified maskoverlaidonthesatelliteimageryisdepictedin Figure 4.Thepresentstudyemphasisthepotentialofsingledate multispectraldataforcropdiscrimination,classificationand areaestimation.
ThedistrictwiseestimatedcottonareaisgiveninTable1.


5. CONCLUSIONS
The present study emphasis the potential of single date multi-spectral data for the crop identification and classification.AsEachagriculturalcrophasthevariationsin itsgrowingpatternandinphenologicalstagesthusshowing thewidevariationinthereflectancevaluesintheNIRand visible region. This characteristic generates distinct signature of each crop in the multi-spectral data. After analysing the crop phenology and reflectance in multispectral data the crops can easily be discriminated and classified.Theresultsofthestudyindicatesthatthe cotton crop area can easily be estimated using single date multispectraldataforthemajorgrowingdistrictscovering around85%ofthetotalcottoncropareaofthestate.
The generated crop map may be very helpful for making assessmentregardingthecropconditionandhealthbyusing temporalsatellitedatausingvariousvegetationindices.The accuratecropmaskwillbeveryhelpfulformakingthecrop lossassessmentinanynaturalweathercalamities.
ACKNOWLEDGEMENT
TheauthorsacknowledgeEuropeanSpaceAgency(ESA)for satellitedataandDirectorHARSACforlabfacility.
REFERENCES
[1] Chu,T.,Chen,R.,Landivar,J.A.,Maeda,M.M.,Yang,C.,& Starek, M. J. (2016). Cotton growth modeling and assessmentusingunmannedaircraftsystemvisual-band imagery. Journal of Applied Remote Sensing, 10(3), 036018-036018.
[2] Ma,Y.,Zhang,Q.,Yi,X.,Ma,L.,Zhang,L.,Huang,C.,...& Lv,X.(2021).Estimationofcottonleafareaindex(LAI) basedonspectraltransformationandvegetationindex. RemoteSensing,14(1),136.
[3] Kussul, N., Lavreniuk, M., Skakun, S., & Shelestov, A. (2017). Deep learning classification of land cover and croptypesusingremotesensingdata.IEEEGeoscience andRemoteSensingLetters,14(5),778-782.
[4] Li,M.,Zang,S.,Zhang,B.,Li,S.,&Wu,C.(2014).Areview ofremotesensingimageclassificationtechniques:The roleofspatio-contextualinformation.EuropeanJournal ofRemoteSensing,47(1),389-411.
[5] Jamuna,K.S.,Karpagavalli,S.,Vijaya,M.S.,Revathi,P., Gokilavani,S.,&Madhiya,E.(2010,June).Classification ofseedcottonyieldbasedonthegrowthstagesofcotton crop using machine learning techniques. In 2010 International Conference on Advances in Computer Engineering(pp.312-315).IEEE.
[6] Kamilaris, A., & Prenafeta-Boldú, F. X. (2018). Deep learning in agriculture: A survey. Computers and electronicsinagriculture,147,70-90.
© 2023, IRJET | Impact Factor value: 8.226 |