International Research Journal of Engineering and Technology (IRJET)
e-ISSN: 2395-0056
Volume: 10 Issue: 05 | May 2023
p-ISSN: 2395-0072
www.irjet.net
ANALYSIS OF THERMAL PERFORMANCE OF SOLAR COLLECTOR WITH LONGITUDINAL FINS Abhilash Kumar Pandey1 Asst. Prof. Shailendra Kumar Shukla2 1Mtech Scholar, dept of mechanical Engineering, Rewa Institute of Technology, Rewa 2 Asst. Prof., dept of mechanical engineering, Rewa Institute of Technology, Rewa
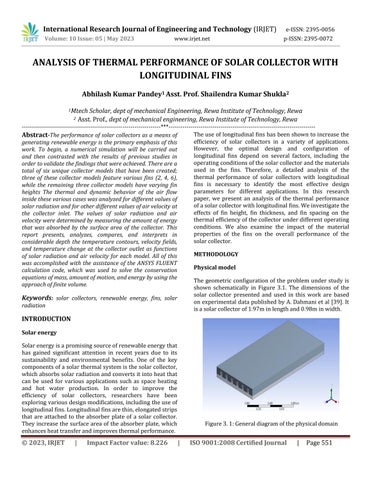
---------------------------------------------------------------------***------------------------------------------------------------------------The use of longitudinal fins has been shown to increase the Abstract-The performance of solar collectors as a means of efficiency of solar collectors in a variety of applications. generating renewable energy is the primary emphasis of this However, the optimal design and configuration of work. To begin, a numerical simulation will be carried out longitudinal fins depend on several factors, including the and then contrasted with the results of previous studies in operating conditions of the solar collector and the materials order to validate the findings that were achieved. There are a used in the fins. Therefore, a detailed analysis of the total of six unique collector models that have been created; thermal performance of solar collectors with longitudinal three of these collector models feature various fins (2, 4, 6), fins is necessary to identify the most effective design while the remaining three collector models have varying fin parameters for different applications. In this research heights The thermal and dynamic behavior of the air flow paper, we present an analysis of the thermal performance inside these various cases was analyzed for different values of of a solar collector with longitudinal fins. We investigate the solar radiation and for other different values of air velocity at effects of fin height, fin thickness, and fin spacing on the the collector inlet. The values of solar radiation and air thermal efficiency of the collector under different operating velocity were determined by measuring the amount of energy conditions. We also examine the impact of the material that was absorbed by the surface area of the collector. This properties of the fins on the overall performance of the report presents, analyzes, compares, and interprets in solar collector. considerable depth the temperature contours, velocity fields, and temperature change at the collector outlet as functions METHODOLOGY of solar radiation and air velocity for each model. All of this was accomplished with the assistance of the ANSYS FLUENT Physical model calculation code, which was used to solve the conservation equations of mass, amount of motion, and energy by using the The geometric configuration of the problem under study is approach of finite volume. shown schematically in Figure 3.1. The dimensions of the solar collector presented and used in this work are based Keywords: solar collectors, renewable energy, fins, solar on experimental data published by A. Dahmani et al [39]. It radiation is a solar collector of 1.97m in length and 0.98m in width.
INTRODUCTION Solar energy Solar energy is a promising source of renewable energy that has gained significant attention in recent years due to its sustainability and environmental benefits. One of the key components of a solar thermal system is the solar collector, which absorbs solar radiation and converts it into heat that can be used for various applications such as space heating and hot water production. In order to improve the efficiency of solar collectors, researchers have been exploring various design modifications, including the use of longitudinal fins. Longitudinal fins are thin, elongated strips that are attached to the absorber plate of a solar collector. They increase the surface area of the absorber plate, which enhances heat transfer and improves thermal performance.
© 2023, IRJET
|
Impact Factor value: 8.226
Figure 3. 1: General diagram of the physical domain
|
ISO 9001:2008 Certified Journal
|
Page 551