
Analysis Of Air Pollutants Affecting The Air Quality Using ARIMA
1Student, Computer Engineering, Datta Meghe College Of Engineering, Navi Mumbai, India 2Student, Computer Engineering, Datta Meghe College Of Engineering, Navi Mumbai, India 3Student, Computer Engineering, Datta Meghe College Of Engineering, Navi Mumbai, India 4Student, Computer Engineering, Datta Meghe College Of Engineering, Navi Mumbai, India
5Assistant Professor, Computer Engineering, Datta Meghe College Of Engineering, Navi Mumbai, India ***

Abstract - The reason for human life or any other living organismisair.However,thisairisgettingpollutedbecauseof a variety of factors, including traffic situations, industrial development and various construction businesses. Because of thesefactors,thequalityofairis decreasingdayby day,and allthe life forms who depend on this air are gettingheavilyaffected. There are various factors who influence the quality of air, and it is measured by the Air Quality Index (AQI). NO2, CO, C6H6, SO2, and CO2 are some of the components which affect the quality of our air. The aim of our paper is to predict and forecast the AQIby usingtime series generalized models such asthe AutoRegressive Integrated Moving Average (ARIMA) model. The time series data collected has a lot of missing and corrupt values, and hence, it is subjected to cleaning, modificationand aggregation as the requirement arose. The data is then checked for its stationarity, by performing various tests, and then the model is deployed. Prediction was performed on the aggregated data using ARIMA.
Key Words: ARIMA, time-series data forecasting, Moving Average model, Auto-regressive
1.INTRODUCTION
Airisoneofthemostcrucial naturalresourcesforalllifeon thisplanet'ssurvival.Everylifeformdependsonairfortheir existence and hence all the living beings require good air qualitywhichisfreefromharmfulgasesfortheirexistence. According to the Blacksmith Institute, two major pollution problems in the world are outdoor city air quality and indoorairpollution[1].
Air quality forecasting is conducted to obtain advanced knowledgeoftheairenvironmentandtotakepreventative measures to avoid health problems. Pollution, which is foundbothindoorsandoutdoors,iscausingthequalityofair to deteriorate in emerging and even developed countries allovertheworld.Airpollutioncausesshort-termandlongterm health issues, mostly affecting the elderly and young children[2].Short-termissuescanincludethroatirritation, headaches, upper respiratory infections, and other short term but dangerous issues. Lung cancer, kidney damage, respiratory disease, heart disease, and brain damage are someofthelong-termeffectsonhealthduetoairpollution. Air pollution also causes depletion of the ozone layer, whichisamajorissueasitprotectseveryonefromthesun’s harmfulUVrays[3].Anotherharmfulresultofairpollution
is acid rain, which affects rivers, trees, wildlife, and soils. Some of the environmental repercussions of air pollution include eutrophication, global warming, and haze. With the advent in technology, we aim to predict and forecast the Air Quality Index (AQI) by using unsupervised machine learning techniques. Primarily, Auto - Regressive Integrated Moving Average(ARIMA)modelisusedforairqualityanalysis.
The ARIMA model known as the auto-regressive integrated moving average is a model that includes two processes that areMAandAR.FordevelopingtheARIMA(p,d,q) model both PACFandACFauto-correlationfunctionsareveryuseful.
1.1 Motivation
Airqualitymanagementhasbeenacknowledgedasakeyissueat bothnationalandlocallevels.Inthepastfewyears,researchhas beenundertakentoidentifythesignificantchallengesbecause it is critical to ensure the health and cleanliness of the local surrounding and the community. It has been ascertainedthat different topic such as technological advancement, detail procedure regarding the measurement of air quality, determination of pollutant variable and its interconnection, identifyingthe causes and effects of air pollution and lastly forecasting of periodic and geographical variations in atmospheric levels are some of the topics that has been covered in regard to the study of air quality. Although, it has been investigated that developing countries are facing these air quality issues due to insufficient funds, and technological support.
Airpollutioninacityrequiresimmediateattention asa large numberofpeopleliveinthecity,andhence,air pollution may affectmorepeople.Thereisanimmediateneedofstrictlaws and constant monitoring of air pollutants for air pollution management[4]. For this reason, our paper focuses on a prediction model that will help us with prediction of the air pollution.
2. LITERATURE REVIEW
A paper presented a neural calibration for benzene concentration prediction utilizing a gas multi-sensor system (solid-state) developed to measure urban pollution. The results are evaluated and analyzed using prediction error characterization during a 13-month period. The relationship between training duration and efficiency is also being
investigated. A neural calibration acquired with a modest numberofmeasurementdayswerefoundtobecompetent at limiting the relative prediction error for more than 6 months, after which periodic impacts on prediction capabilitiesatlowconcentrationshighlightedtheneedfora newcalibration
Another method was proposed for employing time- series datatostudytheairpollutionindicator(API).Theauthors used the Box–Jenkins method to analyze the time series and focused on analyzing changing air pollution levels in Bangalore (INDIA) from January 2013toMarch2016 [4].A papermentionedtheuseofarandomforestclassifiermodel for data forecastingin Beijingin2019tostudyandanalyze thedataanduseitforprediction.
Inanother paper, air quality monitoring is classified by big data techniques into spatial, temporal, spatial- temporal models. Big data techniques that are needed in air quality forecasting are summarized into three folds, which are statistical forecasting model, deep neural network model, and hybrid model, presenting representative scenarios in somefolds[2].Theairpollutiontraceabilitymethodswere analyzed and compared in detail, classifying them into twocategories:traditionalmodelcombined with big datatechniquesanddatadrivenmodel.
Interpolation, prediction, and feature analysis are three significantsubjectsinurbanaircomputingusedinapaper in 2019. Due to the costly cost and maintenance of city stations, littleairqualitydatawasobtained.Theyutilizedthe K-Meansalgorithmandsupervisedmachinelearningmethods such as the Decision Tree algorithm and Multinomial Regression. This paper mainly containedtheanalysis of air pollution and prediction of air pollutants using machine learning algorithms. The proposed system was to build an algorithm in machine learning which would be a best fit modeltoanalyzeandpredicttheairpollutants[6].Theresult told us thatthe MLR model was much better than the DT model by providing us with greater accuracy and being a bestfitmodel.
3. REQUIREMENT ANALYSIS
The data set used in the project is a time series data. The datawhichisrecordedoverspecificandconsistentintervals of time is called as a time series data. The data which is obtained may be corrupted,andhavemissingvalues,which would affectthemodel.Topreventit,thedataneeds to be pre-processed.Incaseofanymissingvalues,themeanvalue of the statistical measure is used to substitute with the missingvalues.
The data which is pre-processed, needs to be stationary before it is used. Stationarity means when the statistical characteristics of the time series data, such as mean and variance, do not change overa periodoftime.Stationarity
helps us to understand the data better and choose a better range of values for model. If the data is not stationary, we performvariousteststoachievestationarity.
4. PROJECT DESIGN
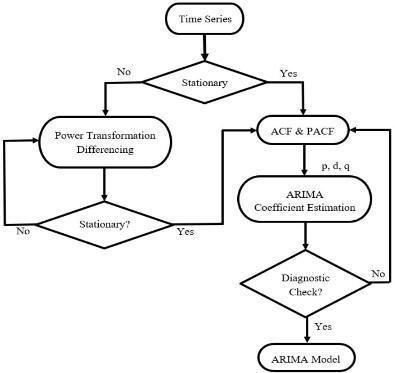
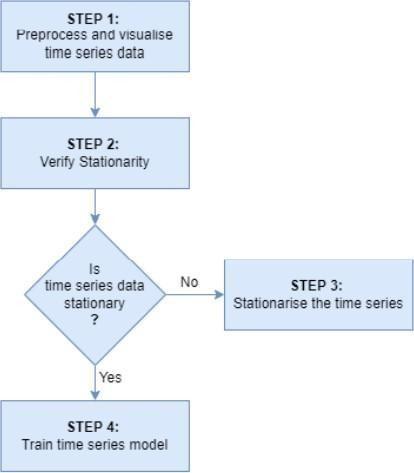
The process of project is as follows :
1. The data which is pre-processed, is our time seriesdata.Wecheckifthisdataisstationaryornot.
2. The stationarity of data can be achieved by using techniques such as Rolling Statistics and Augmented Dickery-Fuller(ADF)test.
3. Ifthedataisstationary,wecanperformtimeseries forecasting[7].WeusefunctionslikeACFand PACF, which givesusthehyperparametersforARIMA.
4. If the data is not stationary we can perform data differencing or log transformation to manage the data and to make it stationary as most time-series models assume thatthedataisstationary.
5. Weusepowertransformationdifferencingtoobtain stationarity of our data. The order of differencing depends on how many times we perform the test till we get stationarydata.
6. ThethreehyperparametersofARIMAarep,dandq. p standsforthemoving average part whichis obtainedfrom the moving average component. This is acquired from the ACF graph.pistheautoregressivelagthatcomesfromthe autoregressive component, and is obtained from the PACF graph.distheorderofdifferentiationthatweusetoconvert ournon-stationarydatatostationarydata.
7. After our data is stationarized, we deploy our ARIMAmodel.
5. TECHNOLOGIES USED
Python :
Python is one of the widely used, and a user friendly programming language used for building websites and projects, as well as conduct data analysis. The unique design of this high level programming language is that it allows us to reuse code quite easily[8]. Python is not limited to any specific problems and can be used for making an array of unique and dynamic projects, and programs.Itisdynamically-typedandgarbagecollected.
Google Colab :
Google Colab, also known as Colaboratory, is used to write and execute various programs and projects in the python programming language. Colab is a product of Google, includedintheGoogleResearch.Ithelpsustoperformany machine learning algorithms, as well as any high level programming, along with data analysis[9]. Colab can be usedtoteachpythonaswell,asitisfreeofchargeand we canaccessiteasilyfromourbrowser.
6.RESULTS
Fitting the model :
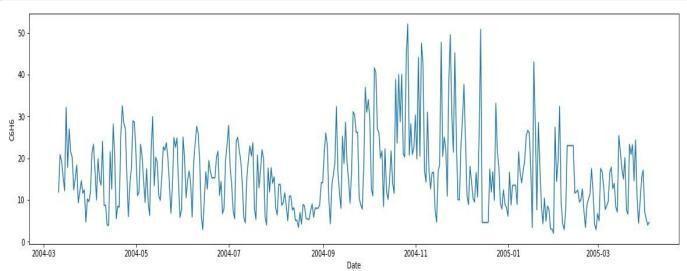
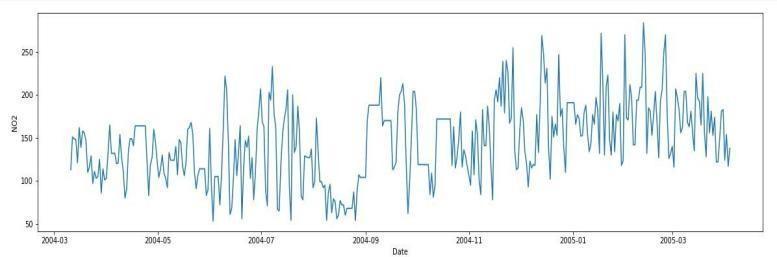
Wehavechangedthefrequencyofourdataintodaily soas tomakeourmodelmorefit.Wecanhavehourly frequency as well but it has the disadvantage that the trends and stationaryvaluesaredifficulttoacquire.
After deciding the frequency and the decomposition of the data,wewillnextcheckforthestationarityofthedata.
Stationarity :
Incaseoftimeseriesforecasting,thereisaneedtocheckif thetimeseriesdataisstationaryornotbecausethemodel requires stationary data for forecasting. Stationarity means that the mean and variance of the data should not vary over time, it should be constant. Stationarity of the data can be confirmed by making use of the Rolling StatisticstestandAugmentedDickeryFuller(ADF)test.
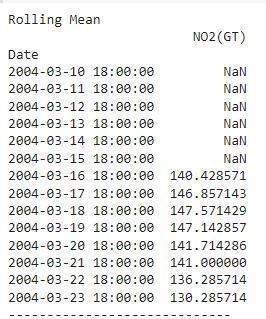
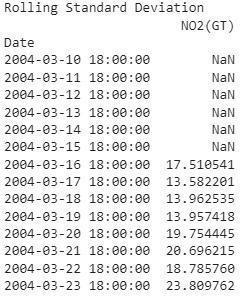
Rolling Statistics Test :
In rolling statistics test, we create a window of a specificsize and then the calculations are performed in this window. The calculations performed in the window are rolled through the data.Thistestisusedtocheckthestabilityofthemodel over time.
Wehavetakentherollingwindowsizeas7,whichisaweek value, but it can be adjusted accordingly. After takingthe rollingmean,androllingstandarddeviationoftheremaining parameters,weperformtheADFtest. WeperformtheADF testtocrossverifythestatisticityofthedata.
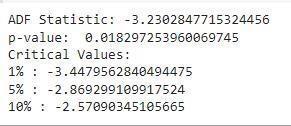
Augmented Dickery Fuller (ADF) Test :
InADFtest,weapproachwithanullhypothesis, assuming that our data is not stationary. We get a few values after performingthetest.Onthebasisofthose values, ifthetest resultislessthancriticalvaluethenwe can reject our null hypothesisandstatethatourdataisstationary.
Deploying the ARIMA Model :
The ARIMA model has three main parameters - p – thisis called the auto regressive lags which weget fromtheauto regressive component of the model. We can obtain this parameter using the PACF (partial autocorrelation function) graph. d – this is called order of differentiation which is the order of differentiation which is required to convert non stationary data to stationary data. q – this is called themovingaverageparameterwhichwegetfromthe moving average component of the model, we can obtain this parameter using ACF (auto correlation function) graph. First, we use the predict function and get the followingresults-
As we can see above, we can see that the p-value is less than 0.05, which states that we can reject our null hypothesis and accept that our data is stationary. Once our dataisstationary,wecandeploytheARIMAmodel.Incaseif the data is not stationary, we can perform data differencing or log transformation to managethedataand stationarize it since we require stationary data for our forecasting.
We can see that the model is not performing well and the predictedvaluesareverydifferentwiththeactualvalues.Asthe modeldidnotperformwell,weneedto analyse the accuracy metrics such as Mean Absolute Error (MAE) and Root Mean SquaredError(RMSE).
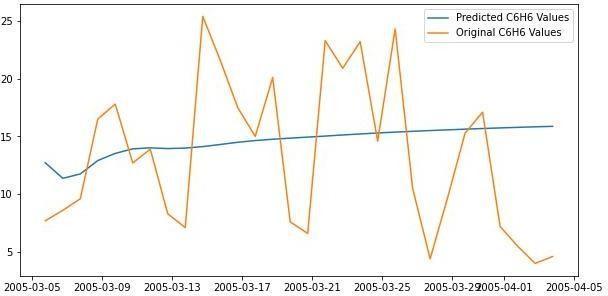
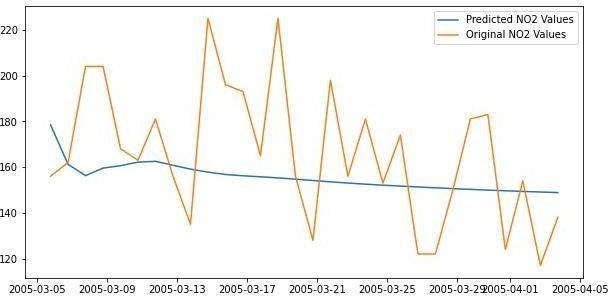
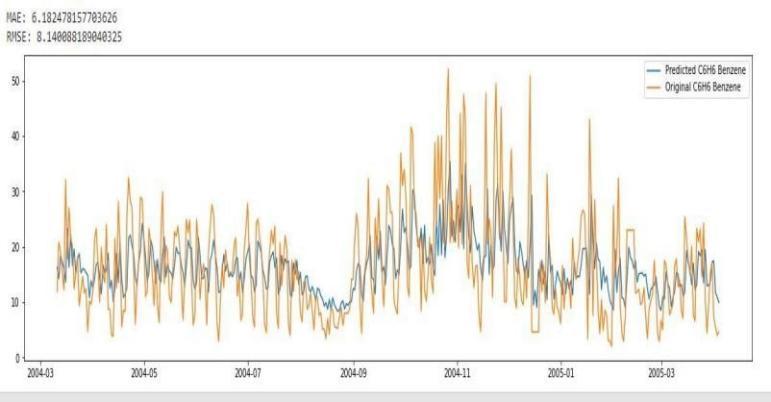
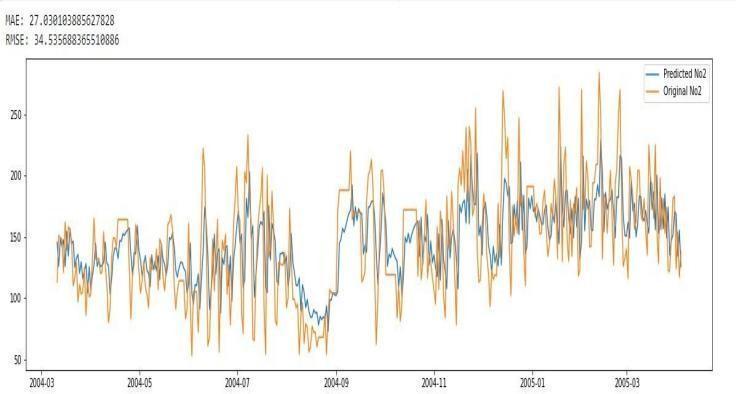
After recalculating the parameters and accuracy metrics we have a new graph with predicted values quite similar to originalvalueswiththep=5d=0andq=1whichareappliedto alltheparameters.
We can see that the accuracy of the model has improved drastically,onceweusethep,dandqvalues,whicharethe hyperparameters of the ARIMA model. We can raise the accuracybychangingtheparametersp,d,qaccordinglyas thedatarequires.
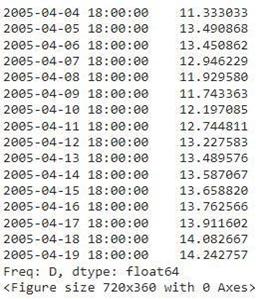
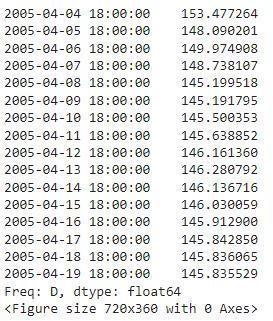
ARIMA Future Forecast :
On the basis of the train data, we can forecast the future valuesusingARIMAmodel.Usingtheparametervaluesand theaccuracymetricswecanforecastforawholeyearanduse this forecasting to understand how this can impact the environment in the upcoming years. Currently, we have forecastedforonlyoneyearaswehaveonlyyearlyamountof data.
Finalpredictionforforecastandoriginalvaluesisdoneusing ARIMA model with the predicted values. The p=5, d=0, q=1 andtheparametersaresetthesame.Togetmoreaccuracy and exact forecasting of the data, the accuracy metrics of MAE and RMSE would have to be optimized using differentiation. We can furtheroptimize the forecast by increasing the differentiation andaccuracymetrics.
7.FUTURE SCOPE
The prediction model can be improved by strengthening the methods to forecast the concentration of air quality factors, majorly for O3, as O3 does not come from direct sources but due to multiple sources of emission and their reaction to each other. There are multiple time series models which can beusedforthis.Thetimeseriesdatacan becollected fortwoor threeyears, ormore thanthat, and we can work on that data in order to make more accurate predictions.
8.CONCLUSIONS
ARIMAmodelissuitableforshort-termpredictionsbecause withthehelpofstationarydata,accuratepredictionscanbe made.Timeseriesmodelusedinforecastingisanimportant tool which helps us to control, analyse and monitor the air qualitycondition.Itis useful to take quick action before the situation worsens in the long run [10]. For that reason, we need ourmodelperformancetobeasaccurateaspossibleso that good air quality forecasting can be achieved. Moreover, thepollutants must beconsideredinanalysis of air pollution data.
REFERENCES
[1] Blacksmith Institute Press Release'. (October 21, 2008). [Online]. Available: http://www.blacksmithinstitute.org/the-2008-top- ten-listof-world-s-worst-pollution-problems.html
[2] Huang, W., Li, T., Liu, J., Xie, P., Du, S. and Teng, F. (2021) An overview of air quality analysis by big data techniques: Monitoring, forecasting, and traceability. InformationFusion75,28–40.
[3] Baralis, E., Cerquitelli, T., Chiusano, S., Garza, P. and Kavoosifar,M.R.(2016)Analyzingairpollutionontheurban environment. 1464 1469https: //ieeexplore.ieee.org/abstract/document/7 522370 Accessed14May2022.
[4] Abhilash, M.S.K., Thakur, A., Gupta, D., Sreevidya, B. (2018). Time Series Analysis of Air Pollution in Bengaluru Using ARIMA Model. In: Perez, G., Tiwari, S., Trivedi, M., Mishra,K.(eds)AmbientCommunications
and Computer Systems. Advances in Intelligent Systemsand Computing, vol 696. Springer, Singapore. https://doi.org/10.1007/978-981-10-7386-1_36
[5] De Vito, S., Massera, E., Piga, M., Martinotto, L. and Di Francia, G. (2008) On field calibration of an electronic nose for benzene estimation in an urban pollution monitoring scenario. Sensors and Actuators B: Chemical 129 (2), 750–757.
[6] Nandini, K. and Fathima, G. (2019) Urban Air Quality AnalysisandPredictionUsingMachineLearning. 98–102 https://ieeexplore.ieee.org/document/9063845 Accessed 14 May2022.
[7] Cheung, Y., and Xu, L. (2001). Independent component ordering in ICA time series analysis. Neurocomputing,41,145–152
[8].https://en.wikipedia.org/wiki/Python_(programmi ng_language)
© 2023, IRJET | Impact Factor value: 8.226 |
[9].https://research.google.com/colaboratory/faq.html [10]. Lee, M. H., Rahman, N. H. A., Suhartono, Latif, M. T., Nor, M. E. & Kamisan, N. A. B. (2012). Seasonal ARIMA for Forecasting Air Pollution Index: A Case Study. American Journal of Applied Sciences, 9(4), 570-578. https://doi.org/10.3844/ajassp.2012.570.578