International Research Journal of Engineering and Technology (IRJET)
e-ISSN: 2395-0056
Volume: 10 Issue: 04 | Apr 2023
p-ISSN: 2395-0072
www.irjet.net
Analysing the performance of Recommendation System using different similarity metrics Kopanathi Sonali1, S. V. G. Reddy2, K. Thammi Reddy3, V. Valli Kumari4 1M. Tech Student, Department of Computer Science and Engineering, GITAM University, Visakhapatnam,
Andhra Pradesh, 530045, India.
2Associate Professor, Department of Computer Science and Engineering, GITAM University,
Visakhapatnam, Andhra Pradesh, 530045, India.
3Professor, Department of Computer Science and Engineering, GITAM University, 4Professor,
Visakhapatnam, Andhra Pradesh, 530045, India. Department of CS and SE, College of Engineering (Andhra University), Visakhapatnam, Andhra Pradesh, 530045, India
---------------------------------------------------------------------***--------------------------------------------------------------------Abstract - In today's modern era of information technology, finding a favourite item in a large dataset has become an essential issue. So, there is a need for a more effective recommendation system with better performance. To achieve this, a Collaborative filtering recommendation system is proposed in this work. Here, the comparison is made with various similarity metrics like Pearson Correlation, Cosine Similarity, Jaccard Coefficient, MSD (Mean Squared Difference), Sorensen Dice Coefficient and SVD (Singular Value Decomposition) on the Movielens 100k dataset. It is observed that the Jaccard Similarity metric, compared to Pearson correlation and cosine similarity, produces better outcomes with improved accuracy and less time complexity.
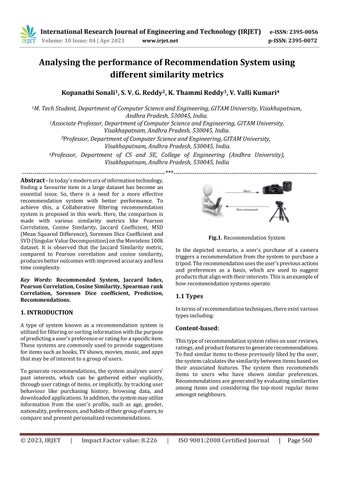
Fig.1. Recommendation System In the depicted scenario, a user's purchase of a camera triggers a recommendation from the system to purchase a tripod. The recommendation uses the user's previous actions and preferences as a basis, which are used to suggest products that align with their interests. This is an example of how recommendation systems operate.
Key Words: Recommended System, Jaccard Index, Pearson Correlation, Cosine Similarity, Spearman rank Correlation, Sorensen Dice coefficient, Prediction, Recommendations.
1.1 Types In terms of recommendation techniques, there exist various types including:
1. INTRODUCTION A type of system known as a recommendation system is utilized for filtering or sorting information with the purpose of predicting a user's preference or rating for a specific item. These systems are commonly used to provide suggestions for items such as books, TV shows, movies, music, and apps that may be of interest to a group of users.
Content-based: This type of recommendation system relies on user reviews, ratings, and product features to generate recommendations. To find similar items to those previously liked by the user, the system calculates the similarity between items based on their associated features. The system then recommends items to users who have shown similar preferences. Recommendations are generated by evaluating similarities among items and considering the top-most regular items amongst neighbours.
To generate recommendations, the system analyses users' past interests, which can be gathered either explicitly, through user ratings of items, or implicitly, by tracking user behaviour like purchasing history, browsing data, and downloaded applications. In addition, the system may utilize information from the user's profile, such as age, gender, nationality, preferences, and habits of their group of users, to compare and present personalized recommendations.
© 2023, IRJET
|
Impact Factor value: 8.226
|
ISO 9001:2008 Certified Journal
|
Page 560