Detection of Plant Diseases Using CNN Architectures
Nidhi Kunal Jha1, Kamal Shah2
1Student, M.E(IT), Thakur College Of Engineering And Technology, India
2Vice Principal, Thakur College Of Engineering And Technology, India ***
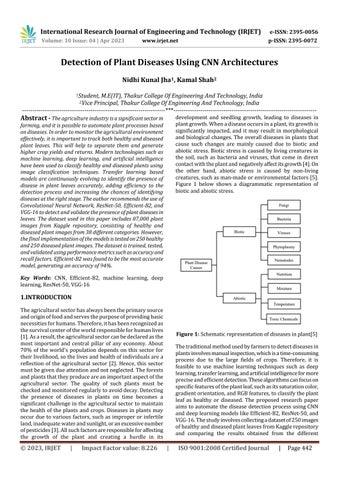
Abstract - The agriculture industry is a significant sector in farming, and it is possible to automate plant processes based on diseases. In order to monitor the agricultural environment effectively, it is important to track both healthy and diseased plant leaves. This will help to separate them and generate higher crop yields and returns. Modern technologies such as machine learning, deep learning, and artificial intelligence have been used to classify healthy and diseased plants using image classification techniques. Transfer learning based models are continuously evolving to identify the presence of disease in plant leaves accurately, adding efficiency to the detection process and increasing the chances of identifying diseases at the right stage. The author recommends the use of Convolutional Neural Network, ResNet-50, Efficient-B2, and VGG-16 to detect and validate the presence of plant diseases in leaves. The dataset used in this paper includes 87,000 plant images from Kaggle repository, consisting of healthy and diseased plant images from 38 different categories. However, the final implementation of the models is tested on 250 healthy and 250 diseased plant images. The dataset is trained, tested, and validated using performance metrics such as accuracy and recall factors. Efficient-B2 was found to be the most accurate model, generating an accuracy of 94%
Key Words: CNN, Efficient-B2, machine learning, deep learning,ResNet-50,VGG-16
1.INTRODUCTION
Theagriculturalsectorhasalwaysbeentheprimarysource andoriginoffoodandservesthepurposeofprovidingbasic necessitiesforhumans.Therefore,ithasbeenrecognizedas thesurvivalcenteroftheworldresponsibleforhumanlives [1].Asaresult,theagriculturalsectorcanbedeclaredasthe most important and central pillar of any economy. About 70% of the world's population depends on this sector for theirlivelihood,sothelivesandhealthofindividualsarea reflection of the agricultural sector [2]. Hence, this sector mustbegivendueattentionandnotneglected.Theforests andplantsthattheyproduceareanimportantaspectofthe agricultural sector. The quality of such plants must be checkedandmonitoredregularlytoavoiddecay.Detecting the presence of diseases in plants on time becomes a significant challenge in the agricultural sector to maintain the health of the plants and crops. Diseases in plants may occurduetovarious factors,suchasimproperorinfertile land,inadequatewaterandsunlight,oranexcessivenumber ofpesticides[3].Allsuchfactorsareresponsibleforaffecting the growth of the plant and creating a hurdle in its
development and seedling growth, leading to diseases in plantgrowth.Whenadiseaseoccursinaplant,itsgrowthis significantly impacted, and it may result in morphological andbiological changes.The overall diseases in plantsthat cause such changes are mainly caused due to biotic and abioticstress.Bioticstressiscausedbylivingcreaturesin the soil, such as bacteria and viruses, that come in direct contactwiththeplantandnegativelyaffectitsgrowth[4].On the other hand, abiotic stress is caused by non-living creatures,suchasman-madeorenvironmentalfactors[5]. Figure 1 below shows a diagrammatic representation of bioticandabioticstress.
Thetraditionalmethodusedbyfarmerstodetectdiseasesin plantsinvolvesmanualinspection,whichisatime-consuming process due to the large fields of crops. Therefore, it is feasible to use machine learning techniques such as deep learning,transferlearning,andartificialintelligenceformore preciseandefficientdetection.Thesealgorithmscanfocuson specificfeaturesoftheplantleaf,suchasitssaturationcolor, gradientorientation,andRGBfeatures,toclassifytheplant leaf as healthy or diseased. The proposed research paper aimstoautomatethediseasedetectionprocessusingCNN anddeeplearningmodelslikeEfficient-B2,ResNet-50,and VGG-16.Thestudyinvolvescollectingadatasetof250images ofhealthyanddiseasedplantleavesfromKagglerepository and comparing the results obtained from the different
algorithmstoidentifytheonewiththehighestaccuracy.The contributionsofthestudyincludeuploadingtheplantdisease dataset, implementing CNN and deep learning algorithms, and comparing the results to identify the most accurate algorithm.
2. LITERATURE SURVE
Numerousresearchershaveworkedontheconceptualtheory ofusingmachinelearningalgorithmstodetectplantdiseases throughtheirleaves.Thissectionofthethesisdiscussesthe researchworkconductedbyvariousauthorsinthisdomain.
In one study, Ashwin et al. [10] proposed a method for detecting Soybean plant diseases by incorporating physiological and morphological features of leaves. The authorusedadatasetof2500imagesandimplementedthe modelusingsixmachinelearningalgorithms.Thegradient boostingmodelyieldedthehighestaccuracyof92.56percent.
Pushkara Sharma; Pankaj Hans; Subhash Chand Gupta, et al.[11]”ClassificationOfPlantLeafDiseasesUsingMachine LearningAndImagePreprocessingTechniques,”Theauthors developedamodelusingSupportVectorMachine(SVM)and RandomForest(RF)algorithmstoclassifythediseasesbased ontheirsymptoms.TheresultsshowedthattheRFalgorithm performed better than the SVM algorithm in terms of accuracy.Thestudyonlyevaluatedtheperformanceoftwo machine learning algorithms, SVM and RF, without comparing them to other existing models or methods for diseasepredictioninsoybean.
Chohan,Murk,etal.[12]'Plantdiseasedetectionusingdeep learning.'proposesanewmethodfordetectingplantdiseases usingdeeplearningtechniques.However,theauthorsalso notethatfurtherresearchisneededtoimprovetheefficiency andaccuracyoftheirproposedmethodandtoextendittoa widerrangeofplantdiseasesandcroptypes.
Finally, Shrivastava,Vimal K., etal.[13]"Rice plantdisease classification using transfer learning of deep convolution neuralnetwork.".Theproposedmodelisabletoclassifyrice diseaseswithclassificationaccuracyof91.37%for80%-20% training-testing partition. One potential limitation of the proposedmethodisthatitrequiresalargedatasetoflabeled naturalimagesforpre-trainingtheCNNmodel.
The literature review shows that many researchers have focusedondetectingplantdiseasesthroughleaves.However, fewdrawbackofthesestudiesarethattheyonlyclassifyone typeofdiseaseinonetypeofplantleafandaccuracyoftheir methodsarenotsohigh.Thismakesitdifficultforfarmers who grow multiple crops to adapt to these methods. Therefore,theproposedresearchaimstodevelopamodel that can be used by farmers who grow various crops and tried to achieve maximum accuracy. To achieve this, the researchwillfocusontrainingmodelsonvariousplantsfor diseasedetection.Thenextstepwillbetoimplementdeep
learning-based models, including VGG-16, ResNet-50, and Efficient-B2,alongwithCNN.
3. METHODOLOGY USED
Thispartoftheresearchpaperfocusesonthemethodsand techniques employed to execute the identification of plant leafdiseases.ThecentralideabehindDListhatitinvolves addingamulti-layernetworkforfeatureextractiontotheML framework.Theterm"deep"inDLarchitecturereferstothe thickness of the layers. The classification process in DL involvessplittingamanuallylabelleddatasetintotestingand training samples, normalizing the dataset for quality improvement using image pre-processing techniques, and feeding the pre-processed images into the DL design for feature extraction and classification. Each layer in DL architectureoperatesontheoutputofthelayerbelowasits input,passesittothelayerabove,andrepeatsthisprocess. Transferlearningreferstotheprocessofapplyingthedata gatheredandusedononedatasettoanotherdatasetwitha smaller population to train, provided that both datasets function on a similar CNN architecture objective. This approach is typically used to offset the computational expense associated with creating a neural network from scratch.Themethodologiesusedfortheimplementationof the proposed thesis include choosing a specific model for deep learning based on a CNN's ability to extract features, whichistermedasfeatureextraction.Thisprocessinvolves training the initial parameters on large datasets in a traditional CNN. The second tactic involves choosing from amongseveraltransferlearning-basedvariationmodelssuch asAlexnet,Densenet,Mobilenet,Inception,andVGG-16,and modifyingthemodel'sparameterstoachievethebestresults.
CNN:TheCNNimplementationworksbytakinginputimages, extracting features, and classifying them based on predeterminedcriteria.CNNsareatypeofneuralnetwork andhaveallthecharacteristicsthatdefineneuralnetworks. The implementation is divided into two blocks: feature extractionandclassification,andemploystwooperationsconvolutionandpooling-acrossmultiplelayerstoperform these blocks [14]. The first two layers of the network architectureperformfeatureextraction,andthefinaloutput is generated by the fully connected layer by mapping the extracted features from the earlier layers. This output is typically used for the second block, or classification. The convolutionallayer,whichisthefirstlayerinthenetwork,is criticaltotheentireimplementationoftheworkasitcarries out all the mathematical operations in the network. Furthermore, the CNN procedure is conducted in a grid pattern. In the parameters of this grid pattern, twodimensional arrays known as kernels store the pixels of images.Thesekernelsperformtheactualfeatureextraction, which is what gives CNNs their high image processing effectiveness.Sincetheoutputfromonelayerissuppliedas theinputtothenextlayer,alllevelsinthisnetworkhavea tendencytograduallyincreasetheirlevelofcomplexity.The
processofparameteroptimizationusedinkernelstoreduce the difference between output values and input labels is referredtoastraining.Theback-propagationoptimization algorithmisemployedinthisprocess.
ResNet-50:ResNet50isaCNNmodelthatiscommonlyused in deep learning. It consists of 50 convolutional layers stacked on top of each other. One of the key features of ResNet50isitsabilitytoovercometheproblemofvanishing gradients. The architecture also includes "short links" or "skips" that often bypass certain execution steps while traversing the model through important and necessary executionstages.
Efficient-B2:The deep learning architecture includes an improvedandexpandedversionofEfficientB2.Thismodel utilizesascalingtechniquethatmaintainsconsistencyinits dimensionalcomponents,suchasdepthandwidth,acrossall sizes. Additionally, a compound coefficient is employed in conjunction with dimensional variables to adjust the resolutionoftheinputdimensionalimage.Unlikeastandard CNNthatusesscalingfactorstoavoiddistortioninthefinal resolution of an image, EfficientB2's implementation uses scaling coefficients. For example, if the computational resource to be used is increased by 2N times, the overall depthofthenetworkincreasesbyN,andthewidthincreases byN.
VGG-16:isanopen-sourcedeeplearningmodelthatconsists of13levelsgroupedintofivesetsfollowedbyamax-pooling layer.Thefeaturevectorobtainedfromthisispassedonto threefullyconnectedlayersthathavethesameconfiguration. The informationisthen generated and classified usingthe Softmaxlayer.
4. IMPLEMENTATION OF THE MODEL
Theprimaryobjectiveofthestudyistoidentifydiseasein plant leaves by gathering a dataset from the Kaggle repository. The implementation procedure includes collecting and pre-processing the dataset through labeling andresizing.Datavisualizationisperformedtorepresentall the chosen classes from the repository, which totals to 38 classes.Thedatasetisthensplitintothreephases,namely training,testing,andvalidation,inwhich60%,20%,and20% ofthedataareused,respectively.Fouralgorithms,including CNN,Efficient-B2,ResNet-50,andVGG-16,areusedtotest the dataset. After testing, the models undergo evaluation based on parameters such as accuracy and precision to determine the optimal model. The models are compared basedonthegeneratedaccuracy,andtheentireworkflowis depictedinFigure4.1.TheproposedmodelutilizesCNNand three deep learning-basedalgorithms to detect featuresin plantleaves.
4.1 Dataset Used
Thesystemmodelisdevelopedbycollectingdatafromthe Kaggle repository, which includes pictures of plant leaves from38distinctcategories,eachrepresentingadisease,and atotalof87,000RGBimages.Theplantleafcategoriesand imagesaredistinctanddonotoverlap.Thedatasetcontains 250 images of various plants, including both healthy and diseased ones, which are utilized by several algorithms duringthetrainingandtestingstages.ThediagraminFigure 4.2illustratesthis.
4.2 Data Preprocessing
The stage of preparing the dataset is crucial in the system modelasitinvolvesfilteringoutredundantdatatoensure that the final implementation operates on relevant data, resulting in higher efficiency, less time consumption, and greater accuracy. The data pre-processing stage involves labeling the data and resizing the images to increase their resolution, which is necessary for efficient image classification.Inthecontextofimplementingtheproposed thesis,theimagesofplantleavesinthedatasetarereducedto
a pixel size of 128*128 to maintain the resolution of all images.
4.3 Data Visualization
The technique of data visualization is useful in identifying patterns by excluding past data from the dataset. It often involves using bar graphs, pie charts, and other visual representationstoprovidefurtherinsightintoeachattribute ofthedata.Intheproposedresearch,imagesofplantleaves from 38 different types of plants are utilized as a visual representationofthedata.
Thedatavisualizationprocesscanalsoberepresentedbya countplot,whichdisplaysall38categoriesofclassesinabar graph.Thisimplementationhelpsinidentifyingthevarious categoriesbydepictingthemvisually.ThebargraphinFigure 4.4showsthe38classesofplantleavesobtainedfromthe dataset.
Figure 4.4: DataVisualizationof38classesusingcount plot
Confusion matrix: It is a graphical representation of the obtained values and can be depicted by comparing the predictedvalueswiththeactualvalues.
Classification Table: A classification table contains informationabouttheaccuracyachieved,aswellasvalues obtained from precision, recall, and F1-score. The various termsassociatedwithaclassificationtablecanbecalculated usingthefollowingmethods.
4.4 Data Split
Aftercompletingthedatavisualizationprocess,thesystem modelproceedstothedatasplitstage,wherethedatasetis divided into separate portions for training, testing, and validation.Intheproposedthesis,thesplitratioissetat60 percent,20percent,and20percent,respectively.Oncethe data is split, the system model is tested on four predetermined algorithms: CNN, Efficient-B2, ResNet-50, and VGG-16.
5. EXPERIMENTAL ANALYSIS AND RESULTS
Toevaluatetheperformanceofthesystemmodel,several parameterssuchastheconfusionmatrix,classificationtable, sensitivity,andspecificityareused. Theseparametersare applied to the four deep learning-based algorithms being employed.
Sensitivity:Sensitivityisaratiothatinformstheuserofthe positive values that have been obtained in relation to all instancesofnegativeoccurrenceinthefractionathand. It canbecalculatedusingtheformulabelow:
Specificity:Aratiocalledspecificitytellsushowoftenthere are negative values compared to positive values in the fractionthatisnowpresent.Itcanbecalculatedusingthe formulabelow:
5.1 Results of algorithms using Confusion Matrix
The confusion matrix generated by all four algorithms is depictedinfigure5.1below
Step 1: Model Deployment
Step 2: Image Classification
Asevidentfromtheclassificationtablepresentedearlier,it can be concluded that Efficient-B2 algorithm achieves the highest accuracy of 94 percent as compared to other algorithms that were tested. The table also provides information on the validation accuracy and loss error obtained from different algorithms. Additionally, the precisionvaluesgiveninthetableareusedtodeterminethe finalaccuracyofthemodel.
6. CONCLUSIONS
Step 3: Healthy Leaf detection
Step 4: Diseased Leaf Detection
The main objective of this research is to identify the presenceofdiseasesinplantleaves.Toachievethisgoal,a datasetofplantimageswasobtainedfromKagglerepository and pre-processing techniques were applied to label and resizetheimages.Thedatasetwasthensplitintoatraining, testing,andvalidationratioof60:20:20.Fourdeeplearning based algorithms, including CNN, VGG-16, ResNet-50, and Efficient-B2wereusedforimplementation,withEfficient-B2 generatingthehighestaccuracyof94%.Theresearchwas divided into two parts, comparing the models and determiningwhichmodelproducedthehighestefficiency. Evaluationparameterssuchasconfusionmatrix,accuracyvs loss graph, sensitivity, specificity, precision, F1 score, and recallwereusedforanalysis.Theresearchconcludedthat Efficient-B2wasthemostoptimizedmodelforidentifying andcategorizingplantinfectionsasnormalorinfected.
REFERENCES
[1] S. Sankaran, A. Mishra, R. Ehsani, and C. Davis, “A reviewofadvancedtechniquesfordetectingplant diseases,”ComputersandElectronicsinAgriculture, vol.72,no.1,pp.1–13,2010
[2] J.Wäldchen,P.Mäder,“PlantSpeciesIdentification Using Computer Vision Techniques: A Systematic Literature Review,” Archives of Computational Methods in Engineering, Vol. 25, Issue 2, pp 507–543,April2018
[3] E.Fujita,Y.Kawasaki,H.Uga,S. Kagiwada, andH. Iyatomi, “Basic investigation on a robust and practical plant diagnostic system,” 15th IEEE InternationalConferenceonMachineLearningand Applications(ICMLA2016),December2016.
[4] P.Pawara,E.Okafor,O.Surinta,L.Schomaker,and M.Wiering,“ComparingLocalDescriptorsandBags of Visual Words to Deep Convolutional Neural NetworksforPlantRecognition,”6thInternational ConferenceonPatternRecognitionApplicationsand Methods(ICPRAM2017),pages479-486,2017
[5] P.Chaudhary,A.K.Chaudhari,A.N.Cheeran,andS. Godara, “Color transform based approach for diseasespotdetectiononplantleaf,”International Journal of Computer Science and Telecommunications,vol.3,no.6,pp.65–69,2012
[6] J. K. Patil and R. Kumar, “Feature extraction of diseased leaf images,” Journal of Signal & Image Processing,vol.3,no.1,p.60,2012
[7] S. D. Khirade, A.B. Patil, “Plant Disease Detection Using Image Processing,” 2015 International ConferenceonComputingCommunicationControl andAutomation,Feb.2015
[8] D.A.Bashish,M.Braik,S.B.Ahmad,“Aframework for detection and classification of plant leaf and stemdiseases,”InternationalConferenceonSignal andImageProcessing,Dec.201
[9] M.Sardogan,A.Tuncer,Y.Ozen,“PlantLeafDisease DetectionandClassificationBasedonCNNwithLVQ Algorithm,” 3rd International Conference on Computer Science and Engineering (UBMK), Sept. 2018
[10] N.Ashwin,U.K.Adusumilli,N.Kemparaju, and L. Kurra, "A machine learning approach to prediction of soybean disease," International Journal of Scientific Research in Science, EngineeringandTechnology,vol.9,pp.78-88,2021
[11] Pushkara Sharma; Pankaj Hans; Subhash ChandGupta,”ClassificationOfPlantLeafDiseases UsingMachineLearningAndImagePreprocessing Techniques,”202010thInternationalConferenceon Cloud Computing, Data Science & Engineering (Confluence).29-31Jan.2020
[12] Chohan, Murk, et al. "Plant disease detection using deep learning." International JournalofRecentTechnologyandEngineering9.1 (2020):909-914
[13] Shrivastava,Vimal K., et al. "Rice plant diseaseclassificationusingtransferlearningofdeep convolutionneuralnetwork."Internationalarchives of the photogrammetry, remote sensing & spatial informationsciences3.6(2019):631-635
[14] S. Roy, R. Ray, S. R. Dash, and M. K. Giri, "Plant disease detection using machine learning tools with an overview on dimensionality reduction," in Data Analytics in Bioinformatics, R. Satpathy,T.Choudhury,S.Satpathy,S.N.Mohanty, andX.Zhang,Eds.Beverly,MA:ScrivenerPublishing LLC,2021,pp.109-144