STUDY OF PUSHOVER ANALYSIS OF G+10 RCC BUILDING WITH SHEAR WALL

Page 1

STUDY OF PUSHOVER ANALYSIS OF G+10 RCC BUILDING WITH SHEAR WALL

Abstract - The structure in high seismal areas could also be prone to serve damage. conjointly the high rise structures, it becomes vital to adopt each linear & non-Linear analysis procedure for style of structures. thus considering effects of building during this article used pushover analysis toestimate demand of symmetrical buildings.

Seismic loads takenIS 1893 (part I) victimization ETABS software package is employed model & analyz10 floor, Building with completely different Position of shear wall. this text also highlights best positioning system of shear wall. conjointly the parameters base shear, storey drift & Story displacements are been evaluated.

1.INTRODUCTION

Design of civil engineering structures is usually based mostly on prescriptive strategies of building codes. Normally, loads on the ones structures are low and result in elastic structural behavior. However, below a sturdy seismic event, a form may additionally clearly be subjectedtoforces beyond its elastic limit. Although building codes can provide reliable indication of actual average overall performance of man or woman structural elements, it's miles out of their scopetogive an explanation for the anticipated average overall performance of a designed form as a whole, belowlargeforces. Several industries consisting of vehicle and aviation, mechanically assemble full-scale prototypes and perform big testing, in advance than manufacturing plenty of identical structures, that have beenanalyzedand designed with interest of test results. Unfortunately, this option is not available to building corporation as due to the distinctiveness of conventional man or woman buildings, financial device of large-scale production is unachievable. Withthedeliver offast computers, so-known as average overall performance based completely seismic engineering (PBSE), in which inelastic structural assessment is mixedwithseismichazardassessment to calculate anticipated seismic average overall performance of a form, has emerge as increasingly greater feasible. With the help of this tool, structural engineers too, no matter the truth that on a laptop and now now not in a lab, may have a examine anticipated average overall performanceofanyform beneathneath large forces and regulate format accordingly. Nonlinear response statistics assessment is a likely method to calculate structural response beneathneath a strong seismic event. However, due to the large amount of statistics generated in such assessment, it is not considered practical

and PBSE generally consists of nonlinear static assessment, moreover referred to as pushover assessment. From research viewpoint, whilst PBSE staysindevelopmentaldegree in which advanced assessment techniques are being researched.

1.1 Importance of Shear Wall

Shear Wall must give lateral shear strength to the structure to resist the horizontal earthquake forces, wind forces, and transfer these forces to the foundation. Shear Wallsgivelargestiffnesstostructureinthedirectionoftheir exposure,whichreducesthelateralswayofthestructureand thereforereducesdamagetothestructure.

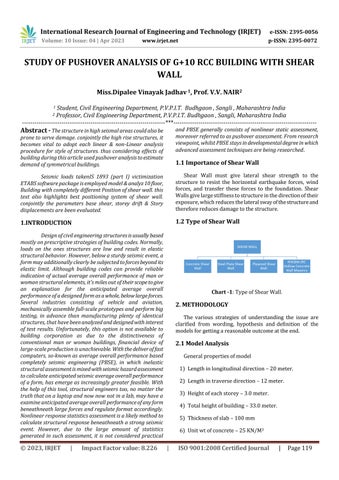
1.2 Type of Shear Wall

Chart -1:TypeofShearWall

2. METHODOLOGY

The various strategies of understanding the issue are clarified from wording, hypothesis and definition of the modelsforgettingareasonableoutcomeattheend.

2.1 Model Analysis

Generalpropertiesofmodel

1) Lengthinlongitudinaldirection–20meter.

2) Lengthintraversedirection–12meter.

3) Heightofeachstorey–3.0meter.

4) Totalheightofbuilding–33.0meter.

5) Thicknessofslab–100mm

6) Unitwtofconcrete–25KN/M3

International Research Journal of Engineering and Technology (IRJET) e-ISSN: 2395-0056 Volume: 10 Issue: 04 | Apr 2023 www.irjet.net p-ISSN: 2395-0072 © 2023, IRJET | Impact Factor value: 8.226 | ISO 9001:2008 Certified Journal | Page119
Miss.Dipalee Vinayak Jadhav 1, Prof. V.V. NAIR2 1 Student, Civil Engineering Department, P.V.P.I.T. Budhgaon , Sangli , Maharashtra India 2 Professor, Civil Engineering Department, P.V.P.I.T Budhgaon , Sangli, Maharashtra India
***

7) Deadload–1.5KN/M3

8) Liveloadintensity–3KN/M2

9) Liveloadconsideredinseismicweightcalculationin 50%

Section Sizes

Slab 100mm

Beam 300mmX400

Column 500mmX500mm

ShearWall 250mm

Table -1: sectionproperties

Hereweare4typeofmodelisprepareasfollowingbelow:

Model No. 1

Model No. 3

Model

Model No. 2

3. RESULTS

The investigation did with and without shear wall are appeared. The outcomes got from the investigation are thought about dependent on the point of the examination. Subsequenttogettingtheoutcomesthesearecontrastedwith reachtheinferencefromit

International Research Journal of Engineering and Technology (IRJET) e-ISSN: 2395-0056 Volume: 10 Issue: 04 | Apr 2023 www.irjet.net p-ISSN: 2395-0072 © 2023, IRJET | Impact Factor value: 8.226 | ISO 9001:2008 Certified Journal | Page120
Fig -1:planviewofwithoutshearwallR.C.C.Building Fig -2:planviewofwithcoreshearwallR.C.C.Building Fig -3:planviewofwithcornershearwallR.C.C.Building No. 4 Fig -4:planviewofwithadjacentshearwallR.C.C. Building

A. Pushover Curve Analysis Graph

Chart -2:pushovercurvewithoutshearwall

Chart -5:pushovercurvewithadjacentshearwall

B. Storey Displacement Table

Chart -3:pushovercurvewithcoreshearwall

Table -2: StoreyDisplacementcurvewithoutshearwall

Chart -3:pushovercurvewithcornershearwall

International Research Journal of Engineering and Technology (IRJET) e-ISSN: 2395-0056 Volume: 10 Issue: 04 | Apr 2023 www.irjet.net p-ISSN: 2395-0072 © 2023, IRJET | Impact Factor value: 8.226 | ISO 9001:2008 Certified Journal | Page121
Story Elevation Location X-Dir Y-Dir m mm mm Story11 33 Top 13.196 0.014 Story10 30 Top 12.857 0.013 Story9 27 Top 12.297 0.011 Story8 24 Top 11.491 0.01 Story7 21 Top 10.446 0.009 Story6 18 Top 9.182 0.007 Story5 15 Top 7.727 0.006 Story4 12 Top 6.115 0.005 Story3 9 Top 4.387 0.003 Story2 6 Top 2.612 0.002 Story1 3 Top 0.953 0.001 Base 0 Top 0 0
Story Elevation Location X-Dir Y-Dir m mm mm Story11 33 Top 13.193 0.008 Story10 30 Top 12.49 0.008 Story9 27 Top 11.667 0.007 Story8 24 Top 10.71 0.006 Story7 21 Top 9.617 0.005 Story6 18 Top 8.399 0.004

C. Storey Drift Graph Graph -1:comparativeGraphofStoreyDrift

3. CONCLUSIONS

Basedontheresultsand discussiongiveninchapter5the followingconclusionsaredrawn.

1.Fromthestoreyresponsewealsoconcludeddisplacement of building without shear wall is more than 57.14% as comparetocoreofshearwall.

2.Storydriftis70%greaterwhenprovidingshearwallas comparetowithoutshearwallbuilding.

3. Base shear is greater when providing shear wall as comparetowithoutshearwallbuilding.

International Research Journal of Engineering and Technology (IRJET) e-ISSN: 2395-0056 Volume: 10 Issue: 04 | Apr 2023 www.irjet.net p-ISSN: 2395-0072 © 2023, IRJET | Impact Factor value: 8.226 | ISO 9001:2008 Certified Journal | Page122 Story Elevation Location X-Dir Y-Dir m mm mm Story5 15 Top 7.07 0.004 Story4 12 Top 5.654 0.003 Story3 9 Top 4.185 0.002 Story2 6 Top 2.707 0.001 Story1 3 Top 1.256 0.001 Base 0 Top 0 0
Story Elevation Location X-Dir Y-Dir m mm mm Story11 33 Top 13.199 0.041 Story10 30 Top 12.144 0.037 Story9 27 Top 10.979 0.033 Story8 24 Top 9.707 0.029 Story7 21 Top 8.339 0.025 Story6 18 Top 6.899 0.02 Story5 15 Top 5.424 0.016 Story4 12 Top 3.963 0.011 Story3 9 Top 2.585 0.007 Story2 6 Top 1.374 0.004 Story1 3 Top 0.445 0.001 Base 0 Top 0 0
Table -3: StoreyDisplacementcurvewithcoreshearwall
Story Elevation Location X-Dir Y-Dir m mm mm Story11 33 Top 13.302 0.101 Story10 30 Top 12.194 0.094 Story9 27 Top 10.985 0.087 Story8 24 Top 9.677 0.078 Story7 21 Top 8.283 0.068 Story6 18 Top 6.824 0.057 Story5 15 Top 5.338 0.046 Story4 12 Top 3.879 0.035 Story3 9 Top 2.514 0.023 Story2 6 Top 1.324 0.013 Story Elevation Location X-Dir Y-Dir m mm mm Story1 3 Top 0.426 0.004 Base 0 Top 0 0
Table -4: StoreyDisplacementcurvewithcornershear wall Table -4: StoryDisplacementcurvewithadjacentshear wall

4. Providing Core shear wall has less displacement as comparedtoprovidingotherpositionofshearwall.

5 Coreplacementofshearwallismoreeffectivethanother provisionofshearwall.

FUTURE SCOPE

Thefollowingarethelimitationshavebeenconsideredwhile arrivingtotheconclusions.

1.Theinclusionoftheshearwallsandeffectofsoil-structure interactioncanbeusedforfurtherstudytoshowtheireffects ontheRCbuildingsfragilityassessment.

2. For better comparison of seismic performance in a probabilistic way, it is highly recommended to use more groundmotionstoobtainmoredependablefragilitycurves.

REFERENCES

[1] BoriaAnya1,TamalGhosh2“AStudyonEffectofShear Wall in Seismic Analysis of Building”, Sikkim Manipal Institute of Technology, Sikkim Manipal University, Sikkim–737136(june-2022)

[2] VidhyaKandSivakumarC.G.“PushoverAnalysisofRC Frame with Shear wall and Openings”. Department of CivilEngineeringPSGcollegeofTechnology,Coimbatore 641004 India, October-December, 2021 ISSN 09745823October-December,2021.

[3] Kulkarni Aniruddha Shailesh1, Dr. M. R. Shiyekar2 “PUSHOVER ANALYSIS OF HIGH RISE RC BUILDING WITHVARIOUSASPECTRATIOSOFSHEARWAL”,Dept. of Applied Mechanics, Government College of EngineeringKarad,Maharashtra,India(oct2021)

[4] PatraVenkataNagaJyothi1,Dr.DumpaVenkateswarlu2 Jami Lakshmi Sudha3 “Pushover Analysis of MultiStoreyed Concrete Building with and Without Shear Wall Using Etabs Software”. M.Tech (student) in structuralEngineering,departmentofcivilengineering, Godavari Institute of Engineering and Technology (Autonomous),Rajahmundry, Velugubanda Village, Rajanagaram (mandal) East Godavari, A.P, India, pin code:533296.(Apr.2018)

[5] NarayanaMaddela1,PrasadBollini2,VenkataNiranjan. Dindi3, “PUSHOVER ANALYSIS FOR 5 X 5 BAYS CONCRETE BUILDING WITH AND WITHOUT SHEAR WALL”, Volume 8, Issue 10, October 2017, pp.1792–1801,ArticleID:IJCIET_08_10_180Availableonlineat http://http://www.iaeme.com/ijciet/issues.asp?JType= IJCIET&VType=8&IType=10ISSNPrint:0976-6308and

ISSNOnline:0976-6316(oct-2017)

[6] J.Parishith1V.Preetha2“PushoverAnalysisofRCFrame Buildings with Shear Wall: A Review” Department of

StructuralEngineering1,2BannariAmmanInstituteof Technology – Sathyamangalam , India IJSRDInternational Journal for Scientific Research & Development| Vol. 4, Issue 12, 2017 | ISSN (online): 2321-0613. Abbashaghollahi, Mohsen B. Ferdous And MehdiKasiri2012“OptimizationOfOutriggerLocation InSteelTallBuildingsSubjectedToEarthquakeLoads.” WorldConferenceOfEarthquakeEngineering2012

[7] Hanafiah1, Saloma2, Yakni Idris3, Julius Yahya4 “The BehaviourStudyofShearWallonConcreteStructureby Pushover Analysis”. #Civil Engineering Department, Faculty of Engineering, Sriwijaya University, Jl.Raya Palembang-Inderalaya KM.32 Inderalaya, OganIlir, SumateraSelatan,30662,Indonesia.ISSN:2088-5334, Vol.7(2017)No.4.

[8] Ashish Daga and Dr. A.S.Santhi and Dr. G Mohan Ganesh“StudyofEffectivePositioningSystemofShear WallsinRCBuildingsusingPushpowerAnalysis”.School of civil and Chemical engineering,VIT University. ISSN:2319-1058,April2016.

[9] N.M.Nikam1, L.G.Kalurkar2 “Pushover Analysis of BuildingwithShearWall.”CivilEngineeringDepartment Jawaharlal Nehru Engineering College, Aurangabad Maharashtra,India.InternationalJournalofEngineering ScienceandComputing,August2016.

[10] Masoumeh Gholipour1, Mohammad Mehadi Alinia2“Considerations on the Pushover Analysis of Multi-Story steel Plate Shear wall Structures.”08/06/2015.

BIOGRAPHIES

Miss.DipaleeVinayakJadhav.

Student, Civil Engineering Department,P.V.P.I.T. Budhgaon, Sangli,MaharashtraIndia

Prof.V.V.Nair.

Professor, Civil Engineering Department, P.V.P.I.T.Budhgaon, Sangli,MaharashtraIndia

International Research Journal of Engineering and Technology (IRJET) e-ISSN: 2395-0056 Volume: 10 Issue: 04 | Apr 2023 www.irjet.net p-ISSN: 2395-0072 © 2023, IRJET | Impact Factor value: 8.226 | ISO 9001:2008 Certified Journal | Page123

Turn static files into dynamic content formats.

Create a flipbook