Nonlinear power law modeling for test vehicle structural response
Jai Singh1
1Biomechanical Engineering Analysis & Research, Inc. 2060-D Avenida de los Arboles, No. 487, Thousand Oaks, California 91362, USA ***
Abstract - The full width engagement impact between the front of a test vehicle and a fixed, rigid, massive barrier represents a common, if not the most common, collision configuration within the context of controlled testing conducted for safety standard compliance or assessment purposes. In cases in which the barrier is instrumented and with the instrumentation specifically including a load cell arraycomprisedofasufficientnumberofindividualloadcells aligned along the principle test direction, the structural response of the test vehicle during the impact can be characterizedwithinthecontextofasingledegreeoffreedom, ubiquitously collinear modeling approach without reliance upon any test vehicle affixed instrumentation. This characterization, based upon the time-parametric force deflectionresponse,isgenerallynonlinearforboththeclosure and separation phases of the collision. Investigated in the subject work, for the totality of each phase, is the use of nonlinear power law formulations for modeling the forcedeflection response. A criterion is developed, based upon the peak deflection, peak collision force and internal work absorbed in regards to a set of closure phase responses for which such a modeling approach is appropriate. Three distinct power law models are developed and presented in regardstothemodelingofseparationphaseresponses. These models are compared to extant, linear, phasic response models.
Key Words: Collision testing, nonlinear modeling, power lawmodels
1.INTRODUCTION
Onemaydefineacollisionasthephysicalphenomenonthat occurswhentwoormoredistinctobjects(ortwoormore distinct aspects of the same object) attempt to simultaneously occupy the same region of physical space. The kinematic and kinetic responses that arise from the physicalphenomenoninquestiondefineasetofmetricsthat are the most objective when it comes to representing the severityoftheevent. Theaccuratequantificationofthese metrics is a typical and common component of the engineeringendeavorofvehicularcollisionreconstruction. The phrase vehicular collision reconstruction, rather than accidentreconstruction,isusedhereinduetothebasicfact that that the physical phenomenon in question and the framework utilized for understanding and modeling the physical phenomenon in question (i.e. the episteme) is entirelyintransienttolegalpreceptsofhumanintention.
Within the context of vehicular collision reconstruction, advances in the composite field of vehicle electronics coupled with their broad adaptation has resulted in the establishmentofanewparadigm. Thisparadigmisoneof quantifying certain collision severity metrics based upon retrievalofdata,fromthevehicularcollisionpartneritself, which in turn was generated during the collision and subsequentlystored. Certainsituations, includingbut not limitedto,casesinvolvingcollisionpartnersforwhichsuch system(s)werenotincludedatthetimeofmanufacture,the lack of coverage for data extraction using aftermarket, commerciallyavailablehardwareandsoftwaresystems,data loss, lack of vehicle availability or any combination of the aforementioned results in the necessity for relying upon other methods for estimating the salient quantifiable collision severity metrics. One class of such methods involvestheanalysisofevidencegeneratedduringacollision event,therelativelyimmediatetemporalperiodsurrounding acollisioneventorboth. Anexampleisthedepositionoftire markevidence,onaroadway,secondarytovehicleoperator mediated braking, steering or both. Cases in which such evidence is present, antecedent to a collision event, specifically due to operator mediated brake application, however,hasbecomeanincreasingraritysecondarytothe nearubiquitousinclusionofanti-lockbrakesasastandard vehicle feature. In most cases, the salient evidence generated is that which occurred during a collision and consists of the residual damage present to the vehicular collisionpartners.
Theimportanceofresidualdamageanalysisbasedmethods for quantifying collision severity metrics cannot be understated. In the United States, the National Center for Statistics and Analysis (NCSA), of the National Highway TrafficSafetyAdministration(NHTSA),hasbeeninvolvedin thecollectionofmotorvehicletrafficcollisiondatathrough theNationalAutomotiveSamplingSystem/Crashworthiness DataSystem(NASS/CDS)foroverfortyyears. Foranygiven traffic collision subject to such an investigation, inclusion withintheNASS/CDSrequiresthedeterminationandcoding of the collision phase velocity change for the salient vehicular collision partners. In this regard, the collision phasevelocitychange(v)isthemetricbywhichcollision severity is quantified and with such determinations predicateduponreconstructionofthecollisionevent. Asof 2007,thevastmajorityofcodedvelocitychangeswithinthe NASS/CDSwerebaseduponresidualdamageanalysis[1].
The phrase, residual damage, which was used in the two preceding paragraphs, requires a working definition. As used in this work, the phrase refers to the quantifiable dimensions of the permanent deformation present to a vehicular collision partner and with such deformation arisingfromacollisionevent. Thereasoningbehindusing residualdamageasthestartingpointinquantifyingcollision severity, is elementary. As the collective independent variable,inareconstructiveanalysis,residualdamagedoes not require any measurements during the collision itself. Furthermore,thedimensionsofavehicularcollisionpartner, in the post-collision configuration, can readily be ascertained,evenwellaftertheincipientcollisionevent,and through a number of different means. Dimensional data regardinganundeformedreferenceconfigurationisreadily availableforvirtuallyeverysingleproductionvehicle. The dimensional differences between the reference and postcollisionconfigurationsdefinetheresidualdamageprofile.
Theprocessofusingagivenresidualdamageprofile,fora givenvehicularcollisionpartner,toquantifytheseverityof the collision that produced the residual damage profile, clearlyrequiresmathematicalmodeling. Inageneralsense, a mathematical model converts a set of inputs (the independent variables) into a set of desired outputs (the dependent variables) by means of its form and generally with the use of model specific parameters. These parameters, furthermore, generally require a priori quantificationpriortomodelutilizationforagivencaseof interest. Advancingfromthisgeneral statementto one of specificity in regards to the residual damage analysis for vehicularcollisionreconstruction,therearetwoempiricallybased and interrelated mathematical models that have enjoyed long-standing utilization. Both models are intrinsicallyuniaxialandnottimeparametric. Basedupon controlled collision testing, in a collinear configuration, in whichafixed,rigid,massivebarrier(FRMB)wasimpacted, in each test, by the front of a test vehicle, in a full frontal width engagement impact, Campbell [2-3] postulated a linear relationship between the speed of impact and the uniaxialdepthofresidualdeformation(i.e.crush)presentto the test vehicle. Campbell generalized this finding by defining the equivalent barrier speed (EBS) as ‘a vehicle velocity at which the kinetic energy of the vehicle would equal the energy absorbed in plastic deformation’ and by indicatingthattheEBSwasalinearfunctionoftheuniaxial residualdamagedepth.
(1)
Inequation(1),themodelparametersb0andb1aretypically referredtoastheCampbellmodelcoefficients. Thetermb0 representsthemaximumEBSthatresultsinazerovalued residualdamagedepth(c)andthetermb1istheslopeofthe linear relationship. The second empirical relationship, postulatedbyCampbell[3]butmostcommonlyassociated withMcHenry[4]wasofalinearresponseinthecollision
forcemagnitude,normalizedperunitlengthofdirectcontact damage,andtheuniaxialdepthofresidualdamage.
F ABc L (2)
Inequation(2),|F|isthemagnitudeofthecollisionforce,L is the length of direct contact damage, A is the maximum normalized collision force that results in a zero valued residual damage depth and B is the slope of the linear relationship. Thelengthofdirectcontactdamageistakenas being time invariant with respect to the collision (i.e., the valueforListakenasbeingthesameinthereferenceand residualdamageconfigurations). ThemodelparametersA and B are commonly referred to as the CRASH3 (the acronym deriving from the third iteration of the Calspan ReconstructionofAccidentSpeedsontheHighwaymodel) coefficients. The parameters from both models are collectivelyreferredtoasstiffnesscoefficients.
Itis relevant,at this point inthe presentation,to notethe factthatcollisionsarenotinstantaneousevents (thisdoes not preclude the ability to accurately model collisions as such). For the vast majority of collisions of the type of interest, excluding certain sideswipe type collisions, the finitecollisiondurationcanbedividedintotwophases. The closure phase initiates at the first point in time that the collisionpartnersseektooccupythesameregionofphysical space and terminates at the point in time in which the collisionpartnersachieveacommonvelocity. Thesecond phase, the separation phase, initiates contemporaneously withtheterminusoftheclosurephaseandterminatesatthe first point in time at which the collision force magnitude reacheszero. Thecollisionforceisinternaltothecollision partner system. During closure, the work done by the collisionforceisabsorbed(IWA)andduringseparation,the work done by the collision force is recovered (IWR). The differencebetweentheIWAandtheIWRistheinternalwork dissipated(IWD).
These definitions are of import to the subject work. Equations(1)and(2)both relateanindependentvariable that is a terminus of separation variable to a dependent variablethatisaterminusofclosurevariable(onemaywrite thesecondrelationshiponanaveragebasis,however,such would not be correct in regards to the work-energy relationshipdiscussedsubsequently). TheCRASH3model wasexplicitlydevelopedfortheclosurephase. Thelackof inclusionofaseparationphaseisfunctionallyequivalentto treatingtheIWR,thecoefficientofrestitution(theratioof the separation velocity to the closing velocity) and the separationvelocityasbeingzerovalued. Thekineticenergy associatedwiththeEBSfromequation(1)canbeobtained simplyas:
Equation (2) has been traditionally treated as if it were a time parametric force-deflection response. Double integrationofthisequationoverLandchasbeentakenas producing an energy that is equal to that of equation (3). Theintegratedresultisaquadraticinc,whichmeansthat theequalityholdswhenthepolynomialcoefficientsforeach orderofc(i.e.,c0,c1 andc2)areequal. Thisapproachallows forasetofequationsthatrelatetheparametersofthetwo modelsandforwhichoneneedonlyestimateavalueforb0, for a given value of c, L and EBS, in order to quantify the remainingthreeparameters.
The modeling of collisions in which the collision partners ‘sticktogether’withnorecoveryofIWAmaybeappropriate forcertainimpactsituations. However,evenfortheFRMB impactcasedescribedpreviously,thecaseofatestvehicle comingtorestagainstthebarrierfaceisnotonethatisseen empirically. Fromthemathematicalmodelingperspective, fortheclosurephaseofacollinearimpact,themodelingof each deformable collision partner as a single degree of freedom(SDOF)modelcomprisedofasinglelumpedmass coupledtoasingle,linear,relativedisplacementelement(i.e. linearspring)canreadilybefoundintheearlyliterature[5] and as part of the formative basis of the CRASH3 damage analysisalgorithm[4].
Thequestionofwhetherornotadynamicmodelcontaining boththeclosureandseparationphasescouldbedeveloped that (a) could account for the ordinate offsets of the empirical models and (b) maintain the linearity of the empiricalmodelsforcollisionsresultinginnon-zerovalued residual damage depths was previously addressed by the subjectauthor[6]. Threefindingsfromthecitedwork,for an affirmative response, are salient. The first finding was thattheclosurephaseforce-deflectionresponsehadtobe uniformlyandubiquitouslylinear. Thesecondfindingwas thatanelasticlimit,definedasaspecificvalueof|F|,EBSor IWAwasneeded. Collisionsataseverityuptoandincluding the elasticlimitvalues resulted ina non-linearseparation phase response that terminated at the origin of the forcedeflectioncurve. Forsuchcollisions,theseparationphase responsecouldnot belinearastheonlylinearpathwasa reverse traversal of the linear closure phase response, therebyproducingfullrecoveryoftheIWA(equivalently,a separation velocity magnitude being equal to the closing velocity magnitude and a unity valued coefficient of restitution). The non-linear response allowed for both a zero valued residual damage depth and a coefficient of restitutionwithlessthanunityvaluation. Thethirdfinding was that for collisions exceeding the elastic limit, the separationphasehadtobeuniformlyandubiquitouslylinear withaforce-deflectionresponseslopeofgreatermagnitude than the closure phase response. Any nonlinearity or multilinearity in the response for collisions exceeding the elastic limit were patently manifest in the relationship betweenanyterminusofclosurephaseparametersandthe depthofresidualdamage.
The linear model for the separation phase, as described above,however,tendstobeproblematicwhenitcomesto theFRMBimpactcaseunderconsiderationduetothefact thatitresultsinanoverestimationoftheIWR. Oneapproach todealwiththisissue,asfoundintheliterature,hasbeento interposeamodeledpath,fortheforce-deflectionresponse, fromthestartoftheseparationphase,havinginfiniteslope, and terminating at a normalized force value such that the subsequent finite slope response produces an IWR that matches the value determined from testing [7-10]. In the viewofthesubjectauthor,thisapproachisunjustified,even as a modeled response. While it produces linearity in regardstotheresidualdamagerelationshipsandmatches theIWR,themodelingapproachrequiresatimeparametric drop in force magnitude, from peak value, while the time parametric deflection remains at peak value. There is no physical phenomenon that would serve as basis for this requirement
Returningtothescopeofresidualdamagebasedmodels,it should be noted that other models have been proposed. Other,linear,modelsincludeaconstantforcemodel[7],a saturationforcemodel(finitelinearslopefollowedbyzero sloperegion)[7]andabilinearmodel[7,11]. Anon-linear power law model has also been proposed [12]. It is important to note that these models retain the non-time parametric nature of the original residual damage based models.
Thenon-linearpowerlawmodel,asadynamicmodel,has been explored previously,bythe author, for modeling the closurephase[13]aswellastheseparationphase[14],for theFRMBimpactsofinterest. Theobjectiveofthesubject work isthefurtherexplorationofthismodelingapproach withintheFRMBimpactcontext. Twopointsregardingthe choice of this context are worthy of note. The first, being ratherobvious,isthatcontrolledcollisiontestingprovides one of the most comprehensive sources of data when it comes to quantifying model parameters. Secondly, the subject FRMB impact context is one that is incumbent in testing conducted for United States (US) Federal Motor Vehicle Safety Standard (FMVSS) 208D frontal impact compliancerequirements,UShigh-speedfrontalimpactNew Car Assessment Program (NCAP) testing and for testing conductedforresearchpurposes. Collectively,testingofthis type represents a significant component of all testing conducted by various contracted groups, on behalf of NHTSA.
2.THEORY
Within the context of understanding a given physical phenomenon of interest, it can readily be stated that a purposeofemployingmathematicalmodelingistoengender tractability This, in turn, consists of (a) defining a set of variablesthatserveasinputs,(b)definingasetofvariables that serve as outputs and (c) defining the operative
relationshipsbetweenthesevariables. Thereisgenerallya correlationbetweenincreasinglevelsofmodelcomplexity and the ability for modeling more aspects of the phenomenon,modelingagivenaspecttoagreaterlevelof detailorboth. Thedownsideisthatmorecomplexmodels typically involve additional parameters and require additionaldatawhencomparedtosimplermodels. Finally,it should also be noted that great care must be taken in employing models for situations that are beyond the stricturesofthemodel.
Withthiscaveatestablished,wecanconsiderthegraphical depiction of a collinear collision between two collision partners as shown in Figure 1. Because the problem is formulatedasacollinearimpactinR1 fortheentiretyofthe collision event, the single axis of the inertial frame of reference, X,isalignedwiththesingleaxis, x1and x2,ofeach collisionpartnerforalltimesofinterest. Thisformulation,in andofitself,properlyreferencesvectorsineachbodyframe totheinertialframeofreference. Equivalently,thiscanalso be stated as the direction cosine matrix (DCM) that transformsvectorcomponentsfromeachbodyframetothe inertialframeofreferenceistimeinvariantastheidentity matrix(thisalsoholdsfortheinversetransform).
We define the deflection for each collision partner as the relative displacement between the center of mass of the same and the common collision interface. This is a direct measure of the dimensional change experienced by the masslesselementforeachcollisionpartner.
Thisrathersimplemodelmaybereducedevenfurtherdue tothemodelednatureoftheFRMB. BecausetheFRMBis fixed, it experiences no displacement during the collision event. Because the FRMB is rigid, it experiences no deflection during the collision event. Finally, because the barrier face is the common collision interface, the displacementofthesameiszero. Thetwoequationsunder (5)reducetoonesingularoperativeequationforthiscase.
Thisdoesnotholdforthecaseofgeneralplanarmotionor generalspatialmotion.
Eachcollisionpartnerismodeledasasinglelumpedmass coupled to a massless force carrying member. The latter represents the modeled structural properties, for the impacted region, for each collision partner. Because the spatial dimension of the problem is one, each collision partnerhasasingledegreeoffreedom,whichistranslational along the X-axis. This single degree of freedom is parameterizedbytranslationaldisplacementandisdenoted as u1(t)forthefirstcollisionpartnerand u2(t)forthesecond collisionpartner. Weseektodefinethemodeledstructural response characteristics of each collision partner, independently, rather than in the effective sense. This resultsinuseofamasslessnode,representingthecommon collisioninterface,withdisplacement uIV(t).
Forthiscase,thedisplacementexperiencedbythevehicle’s center of mass, during the collision, equals the structural deflectionexperiencedbythevehicle. Thisdoesnotholdif theopposingcollisionpartnerisdeformable. Referencesin the literature and elsewhere to phrases such as ‘forcedisplacement response,’ when referencing the forcedeflection response, are only correct when equation (6) holds.
Thereareanumberofstatementsthatcanreadilybemade withoutcrystalizingtheformoftheforce-deflectionmodel. The application of Newton’s second law of motion to the vehicleyieldsthegeneralformoftheequationofmotionfor thetestvehicle.
Where m1 is the mass of the test vehicle, F(t) is the time varyingcollisionforce(thesoleforceconsideredduringthe collision and internal to the two collision partner system) and the standard overdot notation is employed for representingsimpletimederivatives. WhentheFRMBisa load-cell barrier in which each load cell measures force axially, the collision force can be directly obtained by summing,ateachpointintime,theforcemeasuredbyeach load cell. This holds for the model because of the time invariantorientationnotedpreviouslyandthetreatmentof thebarrierasbeingrigid. Thetimevaryingforceonthetest vehicle is equal in magnitude but opposite in direction by Newton’s third law. The second statement is that the equations for the IWA and the IWR for the two collision partnersystem[15]reducebyconsideringthemassofthe FRMBinthelimit.
Where vc is the closing velocity and vs is the separation velocity,whicharedefinedas:
In equation (10), the time value t = to denotes the time at which the closure phase initiates. The closure phase terminates at t = tc For this collision configuration, a commonvelocityisreached,forthecollisionpartners,atthe terminusofclosure. Clearly,thiscommonvelocity, vcom,is equaltozeroduetotheaforementionedmodeledproperties oftheFRMB. Inequation(11),thetimevaluet=ts denotes thetimeatwhichtheseparationphaseterminates. Inboth equationsthevelocitytheFRMBiszero,therebyleadingto thereductionshowntotherightofthelastequalityineach equation. Therelationshipsshowninequations (7)-(11) arederivedwithoutanypresumptionregardingthenature orformoftheforce-deflectionresponseofthetestvehicle and hold regardless of the nature or form of the forcedeflectionresponseofthetestvehicle.
We now proceed with the consideration of specific forcedeflectionmodels. Thelinearmodel,servingascomparison, forthesubjectnonlinearpowerlawmodel,requiresreview.
2.1 Linear closure phase force-deflection model
Thelinearmodelderivesitsnameasaresultofthecollision forcebeingmodelledasalinearfunctionofthedeflection.
Theformtotherightofthefinalequalityinthisequationis baseduponequation(6). Substitutionofequation(12)into equation(7)followedbyalgebraicrearrangementleadsto the operative second order linear differential equation of motionforthelinearclosurephasemodel.
Forthismodel,thelengthofthemasslesselement,atto=0is takenasbeingequaltothereferencelengthoftheelement (i.e.thelengthatwhichtheelementcarrieszeroforce). This allowsforaninitialconditionof u1(0)= u1o = 0. Theother initialconditionisofafinite,non-zero,initialvelocity, v1(0) = v1o, for the test vehicle. The time domain kinematic solutionsfortheclosurephase,forthismodel,are[14]:
Wheretheclosurephasecircularfrequency, , isequal to the real root of (k/m1)0.5 . The time at which closure terminates is determinable from equation (15) and by knowingthatthevelocityofthetestvehicle,atthatpoint,is the common velocity, which is zero. Because the initial velocityisknowntobenon-zerovalued,theequationholds when the cosine term is zero valued. Because the cosine functionisperiodic,itisthefirstsolutionthatisused. This leadstoasolutionoftc = /(2). Substitutionofthisresult into equation (14) leads to a terminus of closure displacement and deflection of u1(tc) = u1c = 1(tc) = 1c = v1o-1. Similarly, the terminus of closure acceleration is determinableas-v1o Wemayalsoshowthatthemodelis linearbymultiplyingtheaccelerationbythemassofthetest vehicleanddividingbythedeflection.
The modeled IWA during closure can be determined by integrating the dot product of the collision force and the differentialofthedeflection.
Foranygivencollisiontest,thetermsm1, v1oandtheIWA,as per equation (8) are known. The value of tc can be determined from equation (7) by using the total barrier forcetofirstsolveforthediscreteacceleration-timehistory, followedbynumericalintegrationtodeterminethediscrete velocity-timehistoryandthendeterminingthetimeatwhich zero velocity is reached. The discrete displacement-time historycanbedeterminedbynumericalintegrationofthe discrete velocity-time history. The terminus of closure displacement (here equal to deflection), acceleration and forcevaluescanthenbedeterminedbysimplythenotingthe valueatt=tc.Thusfar,noneofthevaluesnotedrelyupona modelfortheforcedeflectionresponse. Whenweconsider thelinearclosurephasemodel,wecanreadilynotethatthe systemisoverdeterminedoncethepreviouslylistedterms areknown. Thereareanumberofsolutionapproachesthat canbeemployed.
1. Usethemeasuredvalueof 1c andsolvefor using = v1o/1c. Thensolveforkusingk=m1/2. Solveforthe modeled value of Fc using Fc = k1c. Solve for the modeledvalueoftc usingtc = /(2).
2. Usethemeasuredvalueoftheforce Fc tosolveforthe acceleration at the terminus of closure. Solve for the circularfrequencybydividingtheterminusofclosure accelerationby-v1o. Solveforkusingk=m1/2. Solve forthemodeledvalueoftc usingtc = /(2).
3. Usethemeasureddatapoint{1c, Fc}tosolveforkusing k=(Fc – Fo)/(1c– 1o)= Fc/1c. Solvefor asaboveand solveforthemodeledvalueoftc asabove.
4. Use the measured value of tc to solve for using = /(2tc). Solve for k using k = m1/2. Solve for the modeledvaluesof 1c as v1o-1,theterminusofclosure accelerationas-v1o andtheterminusofclosureforce as-m1v1o
2.2Powerlawclosure phase force-deflection model
The power law models for both phases are expressed as force as a function of deflection. Both the force and the deflectionaretimeparametric. Thistimeparametricnature, denoted as (t), is not shown, in certain situations, in the followingderivation,simplyforthepurposesofclarity. It shouldnotbeforgottenthatthistimedependenceispatent. Withthisnoted,theclosurephasepowerlawmodelis:
11 aa 0101aa Fu (19)
Theformtotherightofthelastequalityagainderivesfrom equation (6) Equation (19) correctly produces an initial zero valuedforce at an initial zerodeflection (atan initial zero displacement). It should also be apparent that this equationislog-linear. Fortwooperandsxandy,apower p, andalogarithmofbaseb,thefollowingproduct,quotient, powerandrootidentitieshold.
equation (7), it can readily be seen that the resultant equationofmotionisnon-linear.
Aclosedformsolutionforequation(27)isnotdeterminable using the methods that are appropriate for solving linear differential equations. We further note that the closure phase model has two parameters (a0 and a1), unlike the linear model, which has a single parameter, and thus requires two equations in order to solve for both parameters. Oneapproachwouldbetowriteequation(19) attheterminusandatthestartoftheclosurephase. This, however, is insufficient, due to the fact that the latter reducesto 0 = 0 Asecondapproachwouldbetowritethis equation at any two points, t = ta and t = tb, for which the deflection and force are not zero valued. One could then solveforthemodelparametersas:
The logarithm and exponentiation are related by the following,wherebisapositive,realnumber:
Forthesubjectwork,thebase,b,forallevaluationsissetto Euler’s number, e, and the logarithms are noted as the naturallogarithm. Thischoiceismadeduetocommonusage and does not reduce the generality of the derivation secondary to the fact that one may readily convert a logarithmfromonebasistoanotherusingthefollowing:
Finally,andonemayusethemodeledIWAtodeterminea secondequation. Forthismodelandcase,theIWAis:
Wemayrewritetheformontherightofthelastequalityby separatingtheexponentiatedterm.
Equation(30)isthepreferredinitiatingpowerlawmodeling equation for the closure phase. The IWA is known as per equation(8)and 1cand F1caredeterminablefromthedata. Furthermore, the equation has only one unknown, the power,a1 Clearly,a1≥0inordertoavoidasingularityat = 0. Wefurthernotethata1 >0ismoreaptsecondarytothe fact that the deflection raised to a zero power produces a solution of unity for all relevant deflection values. This constraint, in turn, as per equation (30), requires that Fc1c/IWA > 1. When this holds and when the power is known, the coefficient, a0, can be solved for by writing equation(19)attheterminusofclosureandsolvingdirectly.
Withthesepreliminariesestablished,takingthenaturallog ofequation(19)leadstothefollowing:
Theslope-interceptappearanceofthisequationispatent. A pointofimportancetonoteisthefactthatln(0)isequalto negativeinfinity. Now,ifequation(19)issubstitutedinto
Finally, if one considers two points during the closure response{1, F1}and{2, F2},whereneitherthedeflection northeforceiszero-valued,thecorrespondingIWA is:
2.3 Linear separation phase force-deflection model
Theseparationphaseterminatesatthefirstpointintime, aftertheterminusoftheclosurephase,atwhichthecollision forcereturnstozero. Sincethetotalbarrierforceisknown, thevalueoftscanbedirectlydeterminedfromthedata. The terminus of separation acceleration, velocity and displacementcanthenbedeterminedinthesamemanneras was discussed for the terminus of closure. With the terminus of separation velocity known, the IWR can be determined using equation (9). Again,noforce-deflection modelisneededtomakethesedeterminations.
Forthelinearmodelfortheseparationphase,amodelfor which closed form analytic solutions for the kinematic responsesaredeterminable,thesolutionprocessisaidedby implementinganewtemporalvariable, ,where =t–tc. As aresult, 0 =tc -tc =0and s =ts –tc Onemaywishtouse equation (13) with a replacement of t by and using the terminusofclosuredisplacementandvelocityastheinitial conditions. Suchanapproach,however,doesnotresultina correct,completeset,ofkinematicequations. Instead,the correctequationofmotionis[14]:
Inthisequation,thetermsontherightsideareevaluatedat 0 =0(i.e.theyaretheterminusofclosureaccelerationand displacement). Model parameters with an overbar specificallydenoteseparationphasemodelparameters. The kinematicsolutionsarereadilydeterminableas[14]:
accelerationtobezeroattheterminusofseparation. This occursat:
The modeled terminus of separation displacement and velocity are obtained by substitution of this solution into equations(33)and(34)respectively.
Fortheforce-deflectionresponse,wefirstconsideralinear functiony=f(x)thathasavalueya =f(xa)andwherex≥xa. Thedefinitionoftheslopeofthelinearfunctionallowsthe equationtobewritteninthefollowingmanner:
Onemaytakeasimilarapproachforthecasewhereyb=f(xb) andwherexb ≥x.
The boundary points for the linearly modeled forcedeflectionresponseare(1c, Fc)at =0and(1s, 0)at = s.
Inlookingatthetwopreviousequations,wenotethatyis analogousto F(()),xisanalogousto (),thevalueswith thesubscriptofaareanalogoustothevaluesat =0andthe valueswiththesubscriptofbareanalogoustothevaluesat = s Asaresult:
The modeled IWR can be obtained by multiplying the collision force by the differential of the deflection and integratingoverthedomain.
Intheseequations,theseparationphasecircularfrequency isthepositiverealrootofthefollowing:
The modeled value for s is based upon the acceleration response. Becausetheterminus ofclosureacceleration is notzerovalued,thecosinetermmustbezero-valuedforthe
The linear separation phase model is defined by a single parameter. Just as with the linear closure phase, the problemisoverdetermined. Anumberofapproachesmay againbeutilized. Forallapproaches,itistakenasagiven thattheterminusofclosurevaluesareknown,irrespective ofhowtheyweredetermined.
1. Determine 1s= u1sfromthedata(atts)andcalculatethe modeledseparationphasestiffness,circularfrequency, timeofseparationandIWR.
2. UsetheknownIWRtocalculatethemodeledvalueof 1s from equation (43) followed by calculation of the modeledseparationphasestiffness,circularfrequency andtimeofseparation.
3. Use the data to determine s, calculate the separation phase modeled circular frequency, stiffness, terminus deflection(residual)andIWR.
Withthelinearmodel fortheseparationphasecovered,we proceed with considering the power law model for the separationphase.
2.4 Power separation phase force-deflection model
Forthepowerlawmodelfortheseparationphase,wefirst note that the form of the relationship shown by equation (19)isinadequate. Asafirstoption,weconsidertheformof equation(39)andreplacethetermswiththecorresponding termsfromthepowerlawformulation.
Rearranging this equation using equations (21) and (22) leadstothefollowingresult.
Forthismodel,whentheIWR, Fc, 1c and 1s areknown,the solutionfortheseparationphasepowermustbedetermined numerically.
A second option for the form of a power law separation phasemodelisahorizontallyshiftedmodel:
Thisformcorrectlypredictsavalueofforceof Fs= 0 when 1 = 1s. When 1 = 1c, F = Fc,whichallowsforthefollowing solution:
Substitution of this result into equation (48) leads to the followingresult:
TheIWR,baseduponthisformulation,is:
Exponentiating both sides of the equality leads to the followingresult.
Forthismodel,whentheIWR, Fc, 1c and 1s areknown,the solution for the separation phase power can readily be determinedinclosedformas:
Theformshowninequation(46),ratherthanthatshownin equation (44), may aid in showing the problem with this formulationwhen 1= 1s. Thecorrespondingforcevalueis Fs= 0. Thisvalue,whenusedinequation(44),resultsinthe termontheleftoftheequalitybecomingnegativeinfinity. When used in equation (46), the term on the left of the equality reduces to zero. However, neither the residual deflectionnorthepeakdeflectionarezerovalued,thereby makingtheequationincorrect. Settingthisissueasidefor themoment,ifoneweretouseequation(46)todetermine theIWR:
Athirdoptionfortheformofapowerlawseparationphase modelisahorizontallyandverticallyshiftedmodel.
Substitutionoftheresultsfromequations(54)and(55)into equation(53)leadstothefollowingresult:
TheIWRforthisformulationis:
The results of each of the last three equations can be substitutedintoequation(19) writtenat{1c, Fc}. Forthe firstmodel:
Forthismodel,whentheIWR, Fc, 1c and 1s areknown,the solutionfortheseparationphasepowercanbedetermined as:
For the first formulation, substitution of {1c, Fc} into equation (46) leads to the result of 1 = 1. For the second formulation, substitution of the same data point into equation(50)leadstotheresultof Fc= Fc. Thesameresultis obtainedbysubstitutionofthesamedatapointintoequation (56)inregardstothethirdformulation. Thusly,ifapower lawmodelisusedfortheclosurephasefollowedbytheuse ofanotherpowerlawmodelfortheseparationphase,one mustfindadifferentmethodofrelatingthemodelsoutside of the force balance that must be present at the contemporaneous terminus of closure and start of separation. Theapproachtakenhereinistousethesquare ofthecoefficientofrestitution,which,forthesubjectFRMB impactcase,istheratiooftheIWRtotheIWA. Forthefirst model,theratioofequation(47)toequation(29)resultsin thefollowingrelationshipbetweentheterminusofclosure andterminusofseparationdeflectionvalues:
Foreachofthesethreerelationships,itcanreadilybeseen thattheformisofaconstantmultipliedbytheterminusof separationdeflectionraisedtothea1 power. Thusly,these relationshipsarelog-linearaswastherelationshipgivenby equation(19)
2.5 Power law kinematic response
It was previously noted that the differential equation of motionforthismodel,givenbyequation(27),isnonlinear and not amenable to being solved for in closed form. We may,however,determineanapproximatesolutionusing a numericalmethod. Directtimeintegration,usingtheexplicit centraldifferencemethod,isusedherein. Westartwiththe Taylorseriesexpansionofafunctionf(x)atx=a,whichcan bewrittenas:
Wheref(n)(a)isthenth derivativeoff(x)evaluatedatx=a. Expandingthesummationleadstothefollowing:
Forthesecondmodel,theratioofequation(51)toequation (29)leadstothefollowing:
Replacing x with the displacement u, replacing a with ti, whichdenotesthetimeattheith timestepandreplacingx withtleadstothefollowingform:
Forthethirdmodel,theratioofequation(57)toequationto equation(29)leadstothefollowing:
Whent=ti + t,equation(67)becomes:
Whent=ti – t,equation(67)becomes:
Switchingtotheoverdotnotation,truncatingequations(68) and(69)tothefirsttwotermsfollowedbythesubtractionof theformerfromthelatterleadstothefollowing:
Itshouldbereadilyapparentthatonlythefirstmodeldoes notrequire apriori knowledgeoftheterminusofseparation deflection.
3.METHODS AND MATERIALS
Truncatingthesametwoequationstotheirfirstthreeterms followedbyadditionleadstothefollowing:
Substitutionofequation(71)intoequation(27)followedby rearrangementleadstothefollowingsolution:
Forthefirsttimestep,thesolutionforthedisplacementat thesecondtimestep,requiresthesolutionfortheprevious timestep. Thiscanbedeterminedbysolvingequation(70) forthedisplacement u(ti + t),substitutingtheresultinto equation(71)andrearranging(forthis,i=1,t=to =0).
The models developed above were evaluated, on a preliminary basis, using data generated from a pair of controlled collision tests. The first test was NHTSA test number v03196, conducted as a baseline test, involving a frontal impact between a 1995 Chevrolet Lumina LS APV minivan(VIN:2G1WN52XS9243954,transverse3.4litersix cylinder engine, four speed automatic front wheel drive, mass=1781kg)andaninstrumentedFRMB(36loadcells arrangedinfourrowsandninecolumns). Thesecondtest wasNHTSAtestnumberv01990,conductedasaNCAPtest, involving a frontal impact between a 1994 Pontiac Trans Sportminivan(VIN:1GMDU06D5RT202095,transverse3.1 litersixcylinderengine,threespeedautomaticfrontwheel drive, mass = 1962 kg) and an instrumented FRMB (configurationaspertheprevious). Thispairoftestswas chosensecondarytotheformerbeingalowerspeedimpact test(impactspeedof24.0KPH)andthelatterbeingahigher speedimpacttest(impactspeedof56.5KPH)forthesame vehicleplatform.
Foreachtimestep,wefirstsolveforthedisplacementatthe next time step using equation (72) and then solve for the velocity and acceleration at the current time step using equations(70)and(71),respectively. Equation(72)isthe correctequationfortheclosurephase. Oncethevelocityof the vehicle becomes negative, the form of this equation changesbasedupontheseparationphasemodelofchoice. For the first separation phase model, the displacement solutionbecomes:
For the second separation phase model, the displacement solutionbecomes:
Theplatformdeterminationwasbaseduponanexamination ofthecomponentsofthesalientsubsystemsasdocumented by the parts catalog information produced by Mitchell International, Inc. (San Diego, California, USA). The structuralcomponents,fortheplatformyearrangeof19941996, were the same for the front inner structure, side structure (including the rails) and subframe. The components comprising the front suspension were substantiallysimilar. Differenceswerenotedwithrespectto thefrontbumpersystem. Thepartnumbersdifferedforthe impactabsorber(referencedassuchfortheChevroletand referenced as a reinforcement for the Pontiac) and the impact bar. The part numbers for the front bumper mountingbracketswerethesame(referencedasimpactbar reinforcementsfortheChevroletandasimpactbarplatesfor thePontiac).
For the third separation phase model, the displacement solutionbecomes:
Foreachtest,theinstrumentationdatainNHTSAEV5ASCII X-Yformat,wasimporteddirectlyfromtheNHTSAwebsite. For each test, the EV5 file was imported into a symbolic mathematics software package (Mathematica v. 12.0; WolframResearch,Inc.;Champaign,Illinois,USA). Thesame softwarepackagewasusedforalldatareductions. TheEV5 filewasparsedusingacustomwrittenprogramthatutilized thestandardizedEV5dataelementdesignations. Theload
cellbarrierinstrumentationfilenameswereextractedusing stringpatternmatching. Eachfilewasindividuallyimported andfilteredusinga custom writtenSocietyofAutomotive Engineers(SAE)channelfrequencyclass(CFC)60filter. The data prior to time t = to = 0 was discarded followed by transposing100millisecondsofdata,atthestartandendof the signal, about (0, 0), for signal padding. This padded signalwaspassedthroughthedigitalfilterforwardandthen inreversefollowedbydiscardingofthepadding.
Thefilteredloadcelldatawassummed,ateachtimepoint,to generatethetotalbarrierforcetimehistory. Thediscrete time-deceleration history for the test vehicle was determinedbydividingthetotalbarrierforce,ateachtime point, by the mass of the test vehicle. The discrete timevelocity and displacement of the test vehicle, with the displacementequatingtothedeflectionfortheFRMBimpact case,wasdeterminedbynumericallyintegratingthetimedecelerationhistory. Asexpected,thevelocitydidnotreach azerovalueatasampleddatapointbutinsteadreachedthat valuebetweena pairofimmediatelyadjacent data points. This was also case for the acceleration in regards to the separation phase analysis. For both the velocity and the acceleration, the data points that bounded the zero value were used to generate a linear interpolation function and determinethetimeatwhichtheabscissawascrossed. The sameindicesfortheotherkinematicresponseswerethen linearlyinterpolatedandsolvedatthetimevaluesatwhich theabscissawascrossedfromthepreviousstep.
The linear model for the closure phase was evaluated in accordancewiththefourmethodsdescribedinSection2.1. Thelinearmodelfortheseparationphasewasevaluatedin accordancewiththethreemethodsdescribedinSection2.3. The power law model for the closure phase consisted of usingequation(30)todeterminethepowervalueandusing equation(28)todeterminethecoefficientvalue. Thepower law model for the separation phase was implemented for eachofthethreemethodsdetailedinSection2.4. Finally,the numerically integrated kinematic response, for the power law model, was determined using equation (72) for the closure phase displacement and equation (74) for the separationphasedisplacement.
4.RESULTS
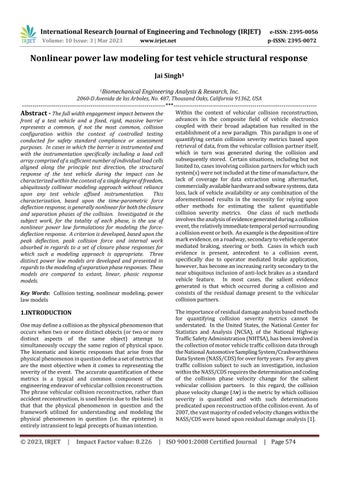
The data reduction for both collision tests, as expected, produced total barrier force time histories that were indicative, even under the modeling constraints of uniaxiality,ofamultipledegreeoffreedom(MDOF)system response. This is clearly evidenced by multiple, interval, substantive,extremaratherthanasingularextremum. The total barrier force time history for both tests is shown in Figure2. Forthelowerspeedtest(i.e.v03196),theclosure phaseparametersweredeterminedtobethefollowing:tc = 85.83msec, u1c = 1c =0.3732m, a1c =-122.1m/sec2 , Fc = 2.174 105 N and IWA = 3.958 104 J. The closure phase
parameters for the higher speed test (i.e. v01990) were determinedtobethefollowing:tc =99.90msec, u1c = 1c = 0.8244m, a1c =-96.40m/sec2 , Fc =1.891105 NandIWA= 2.416105 J.
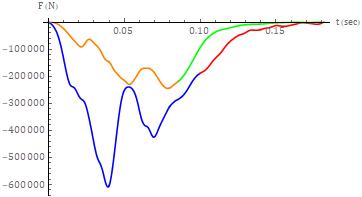
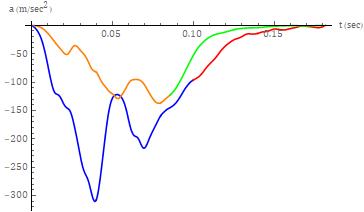
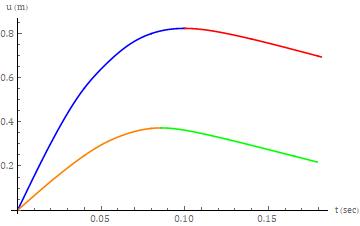
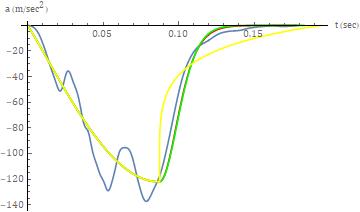
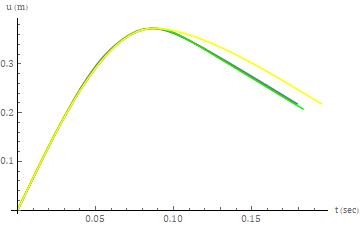
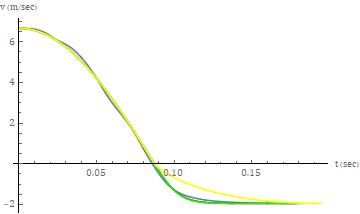
The separation phase parameters for the lower severity collisiontestweredeterminedtobethefollowing:ts=179.2 msec (s = 93.34 msec), u1s = 1s = 0.2186 m, v1s = -1.943 m/sec and IWR = 3.361 103 J. The separation phase parameters for the higher severity collision test were determinedtobethefollowing:ts =181.6msec(s =81.71 msec), u1s = 1s =0.6952m, v1s =-2.024m/secandIWR = 4.018 103 J. The coefficient of restitution for the lower severitytestwas-0.2914andforthehigherseveritytestwas -0.1290. The acceleration, velocity and displacement (deflection) time histories, for both tests, are shown in Figures3-5,respectively.
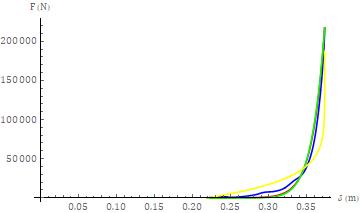
Theaccelerationtimehistoriesmirrorthetotalbarrierforce timehistories,asexpected,giventhattheformeraremerely the latter scaled, along the ordinate, by the inverse of the massofthecorrespondingtestvehicle. Theresponsesfor bothcollisionseveritiesweresimilar. Theinitialincreasein theresponsemagnitudewasfollowedbyaslightdropinthe lower severity test and a region of reduced slope in the higher severity test. This was then followed by a double peakresponse,withaninterposedlocalminimum,followed by a relatively lengthy tail response. The peak force magnitude, for both cases, occurred during closure rather than at the terminus of closure. The smoothing effect of integrationcanreadilybeseeninthevelocitytimehistories shown in Figure 4 and the displacement (deflection) responses shown in Figure 5. For both tests, the peak deflection occurredattheterminus ofclosure. TheforcedeflectionresponseforthetwotestsisshowninFigure6.
Fig -6:Force-deflectionresponsesfortestv01990(bluefor closure,redforseparation)andtestv03196(orangefor closure,greenforseparation)
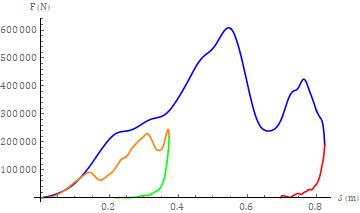
Theforce-deflectionresponseforbothtestsisquitesimilar, butnotanexactoverlay,overapproximatelythefirst0.130 meters of deflection. The local minimum seen in the acceleration response for the lower severity test and the regionofreducedslopeseeninthehigherseveritytestare both manifested in the force-deflection response. For the lowerseveritytest,thepeakforcemagnitudeoccurswiththe second peak of the double peak response. For the higher severitytest,thepeakforcemagnitudeoccurswiththefirst peakofthedoublepeakresponse. Thepeakdeflection,for the lower severity case, occurs much closer to the peak collisionforce,whencomparedtothehigherseveritytest.
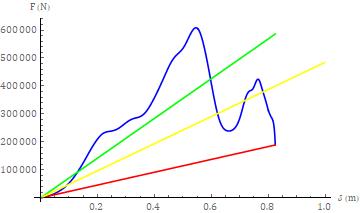
Thelinearmodelfitsfortheclosurephaseforce-deflection responseforthehigherseveritycollisiontestareshownin Figure7. Thefirstmodel,basedupontheknownvaluesfor 1cand Fc,resultedinvaluesfork, ,tcandtheIWAof2.294 105 N/m, 10.81 sec-1, 145.3 msec and 7.796 104 J, respectively. The second model, based upon the known valuesfor 1c andtheIWAresultedinvaluesfork, ,tc and Fcof7.110105N/m,19.04sec-1,82.52msecand5.862105 J. Thethirdmodel,basedupontheknowntimeatwhichthe closurephaseterminates,resultedinvaluesfork, , 1c, Fc andIWAof4.851105 N/m,15.72sec-1,9.98110-1 m,4.842 105 Nand2.416105 J,respectively.
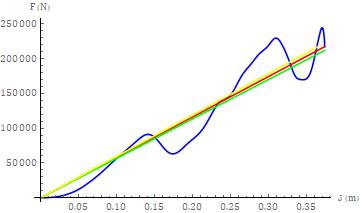
Thelinearmodelfitsfortheclosurephaseforce-deflection responseforthelowerseveritycollisiontestareshownin Figure8. Thefirstmodel,basedupontheknownvaluesfor 1cand Fc,resultedinvaluesfork, ,tcandtheIWAof5.827 105 N/m, 18.09 sec-1, 86.84 msec and 4.0571 104 J, respectively. The second model, based upon the known valuesfor 1c andtheIWAresultedinvaluesfork, ,tc and Fcof5.684105N/m,17.87sec-1,87.92msecand2.121105 J. Thethirdmodel,basedupontheknowntimeatwhichthe closurephaseterminates,resultedinvaluesfork, , 1c, Fc andIWAof5.965105 N/m,18.30sec-1,3.64310-1m,2.173 105 Nand3.958104 J,respectively
Fortheseparationphaseofthelowerseveritytest,thethree linearmodelsconsistedof(1)using 1sfromts,(2)usingthe IWRand(3)using s. Forthefirstcase,themodeledvalues forthestiffness,circularfrequency, sandIWRare1.407106 N/m,28.10sec-1,55.90msecand3.360104 J,respectively. For the second case, the modeled values for the stiffness, circularfrequency, 1sand s are7.033106N/m,62.84sec-1 , 3.422 10-1 m and 25.00 msec, respectively. For the third case,themodeledvaluesforthestiffness,circularfrequency, 1s andIWR are 5.043105 N/m,16.83sec-1 ,-5.796 10-2 m and 4.687 104 J, respectively. These results are shown in Figure9.
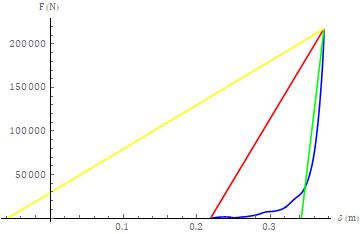
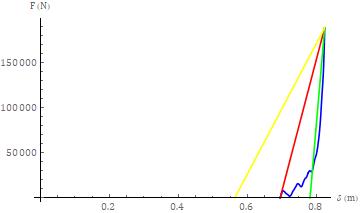
Forthehigherseveritytest,themodeledvaluesgeneratedby thefirstcase,forthestiffness,circularfrequency, sandIWR are1.463106 N/m,27.31sec-1,57.52msecand3.536105 J, respectively. Forthesecondcase,themodeledvaluesforthe stiffness,circularfrequency, 1s and s are 4.451106 N/m, 47.63sec-1,7.82010-1 mand32.98msec,respectively. For thethirdcase,themodeledvaluesforthestiffness,circular frequency, 1sandIWRare7.251105N/m,19.22sec-1,5.636 10-1 m and 2.467 104 J, respectively. These results are showninFigure10.
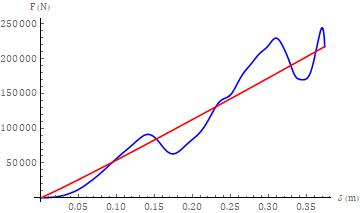
The power law model, as a singular model for the closure phase of the higher severity collision test, based upon the data,failedtomeettherequiredcriterionof(Fc1c)/IWA>1. Thevalueoftheevaluatedtermontheleftoftheinequality was determined to be 0.6453. For the lower severity collisiontest, thevalue ofthisterm wasdeterminedto be 2.050,whichresultedinavalueofa0 =6.123105 (unitsofN permeterraisedtothea1 power)andana1 valueof1.050. The overlay of this model, upon the closure phase data, is showngraphicallyinFigure11.
test v03196(blue)withthefirst,secondandthirdmodels,as perthetext,shownbythered,greenandyellowcurves, respectively.
Forthehigherseveritycollisiontest,theseparationphase powerlawmodelexemplifiedbyequation(46)resultedina powertermof37.75andwitharesidualforcemagnitude,at theterminusofseparation,of302.5N. Thesecondmodel, for this test, exemplified by equation (50) resulted in a power term of 5.084. The third model, for this test, exemplified by equation (56) resulted in a power term of 1.967 10-1 . The three model fits to the separation phase force-deflectionresponseareshowninFigure12.
models are referenced as before. For the first model, the values of ts, 1s, velocity at separation and acceleration at separationare177.8msec,2.18210-1m,-1.943m/secand4.93510-4 m/sec2,respectively. Thevaluesforthesecond model are 182.9 msec, 2.078 10-1 m, -1.943 m/sec and 0 m/sec2,respectively. Finally,forthethirdmodel,thevalues are194.6msec,2.186 10-1 m,-1.943 m/sec and 0m/sec2 The results are shown, graphically, for the acceleration, velocityanddisplacement,inFigures14-16,respectively.
Fig -12
Separationphaseforce-deflectionresponsefor testv01990(blue)withthefirst,secondandthirdmodels, asperthetext,shownbythered,greenandyellowcurves, respectively.
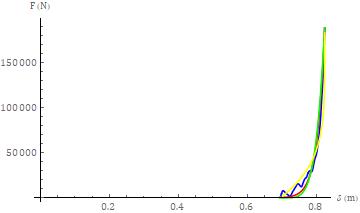
Forthelowerseveritytest,thefirstmodelproducedapower termof23.14andwitharesidualforcemagnitudeof9.147 10-1 N. Thesecondmodelproducedapowertermof9.001. Thethirdmodelproducedapowertermof1.11110-1. The three model fits to the separation phase force-deflection responseareshowninFigure13.
first,
Forthelowerseveritycollisiontest,themodeledkinematic response,baseduponthepowerlawmodelfortheclosure phase followed by a power law model for the separation phase, was evaluated by means of numerical integration. Becausetherewasonlyonemodelfortheclosurephase,the differencesinthemodeledkinematicswereduetothethree differentpowerlawmodelsfortheseparationphase. The
5.DISCUSSION
Residual damagebasedmethodscanreadily beviewed as oneofthesimplestapproachesfordeterminingquantitative estimates for motor vehicle collision severity. For model parameterquantificationfromcontrolledcollisiontestdata, thedatareductionprocessdoesnotrequiretheevaluationof anyofthedynamicinstrumentationdatathatisgenerated during the collision test. In contrast, even the simplest dynamic modeling approaches require significant, albeit readily implementable, data reduction. The SDOF models presented in this work fall within this classification. This statement is made because of the use of ubiquitous uniaxialitycoupledwitha singlelumpedmassforthetest vehicle. The first condition, as noted previously, greatly simplifies the analysis by removing the necessity for determiningthetime-varyingDCMfor eachlocal frameof reference that is salient to the analysis. The second conditionreducesthenumberofsecondorderdifferential equationsofmotiontounity.
The MDOF nature of the system response during closure, evenfortheuniaxialapproximation,canreadilybeseenby simpleexaminationofFigure6. Thisisexemplifiedbythe localextremaandlackofaubiquitousmonotonicresponse. Theselocalresponsesareduetofrontalsubsystemssuchas thefrontbumpersystem,frontframe,engineandthefront wheels and suspension. The impact of these subsystems, withinthecontextofaSDOFmodelingapproach,isvariable. Forthelowerseveritycollisiontest,asshowninFigure8, the deviation of the response from the case of a purely monotonicallyincreasingfunctionislimitedandtheforceat theterminusoftheclosurephaseiscloseinmagnitudeto the peak force. Thusly, the three linear fits are closely approximatedtoeachotheraswelltotheactualresponse (when compared with the higher collision severity test). This was clearly not the case for the closure phase of the higherseveritycollisiontest. VisualinspectionofFigures2 and 3 shows that the peak force and acceleration occur relatively early during the closure phase. This is then manifestedwithapeakforcethatoccurspriortothepeak deflectionasseeninFigures6and7. Fromthelatter,itcan readilybeseenthatthethreelinearclosurephasemodels diverge. Furthermore,noneofthemodelsprovidesagood fitforthedata.
One of the findings of the subject work, which is a novel finding with respect to the application context, is that the powerlawmodel,asasinglemodelfortheentiretyofthe closure phase, has a limitation based upon the inequality Fcc/IWA > 1. This inequality did not hold for the higher severitycollisiontestconsideredinthesubjectwork. One may readily make the statement that collision tests with closurephaseforce-deflectionresponsesthataresimilarto theresponseofthesubjecthigherseveritycollisiontest,in regardstoanearlypeakforcemagnitudeandrelativelylow forcemagnitudeattheterminusofclosure,wouldalsoresult
intheinequalitynotholding. Thisstatementisbasedupon deterministicconsiderations. Onemayfurtherstatethatthe setofcharacteristicsfoundintheclosurephaseresponseof thehigherseveritycollisiontestrepresentoneclass,butnot necessarily the only class, of response for which the inequalitywouldnothold. Thelowerseveritycollisiontest, on the other hand, provided data for which the inequality held. Theclosurephasepowerlawfit,however,wasvery closetobeinglinear. Itisunclearifthisapproximatelinear fitrepresentsalimitationontheuseofasinglepowerlaw functionformodelingtheclosurephase.
Twoadditionalpointsregardingtheclosurephaseresponse areworthyofdiscussion. Thefirstpointisthattheforcedeflectionresponsefortheapproximatefirst0.130metersof deflection is quite similar between the higher and lower severity collision tests. That such similitude exists over a non-trivialdeflectionmagnitudeismoregermanethanthe magnitudeitself. Thefindingshowsthattheinitialportion of the response follows a very similar path for the two collisionseveritiesinquestion. Theslightdifferencescanbe attributed to differences between the test vehicles, variationsassociatedwiththeimplementationofthetesting protocols and response contributions, albeit minor, from other load paths or a combination The contributions of these other load paths become more substantial in the higherseveritycollisiontest,followingtheinitialportionof similitude. Thesecondpointisthatitishighlyunlikelythat therewouldbeasubstantiallydifferentresponseforalower severitycollision,forthedeflectionregimestartingatzero and terminating at the appropriate value before 0.130 metersofdeflection. Thisstatementholdsduetothefactthe subjectlowerseveritycollisiontesthasto‘passthrough’the same response regime, engaging the same vehicle frontal systems, in the same manner, for impacts with a lower severity.
For both tests, the linear modeling approach faired quite poorly,asexpected,fortheseparationphase. Thiswasmost apparentforthethirdmodel,forthehigherseveritycollision test, as shown in Figure 9. Qualitatively, the separation phaseresponseforbothtestscanbecharacterizedasbeing biphasic. Thefirstphaseoftheresponseconsistsofasteep drop in the force magnitude with a minimum but finite decrement in the deflection. The second phase of the responseconsistsofasteepdecreaseinthedeflectionwitha minimum but finite decrement in the collision force. The transition between the two phases is relatively smooth (ratherthanabrupt). Forbothtests,thepowerlawmodeling approachprovidedasubstantiallybetterfittotheseparation responsewhencomparedwiththelinearmodelfits. Forthe higherseveritycollisiontest,asevidencedbyFigure12,the firstandsecondseparationphasepowerlawmodelswere essentiallyoverlayedandprovidedabetterfittotheactual datathanthethirdmodel. Again,itshouldbenotedthatthe firstmodel,byitsdesign,doesnotpredictazerovaluation fortheforceattheterminusoftheseparationphase.These
findingsarealsoaptforthelowerseveritycollisiontest,as perFigure13.
Forthelowerseveritycollisiontest,thefirsttwomodelsfor the separation phase, again, were virtually overlayed in regardstokinematicresponsesshowninFigure14-16. Both ofthesemodelsprovideabetterfittotheactualdatawhen compared to the fit provided by the third model. With respecttotheterminusoftheclosurephaseforthecollision test, the modeled responses lag the actual response secondarytotheformerfallingbetweenthetimestepsofthe latter. The impact of this is most apparent on the acceleration response as shown in Figure 14. The differencesbetweentheactualdataandthefirsttwomodels, in regards to the acceleration response, as expected, are minimizedforboththevelocityanddisplacementresponses (asperFigures15and16respectively).
Whileonlytwotestswereconsideredinthesubjectwork, thereareanumberoffindingsthatareofutilitywhenone considersfuturedevelopment. Thefirst,whichretainsboth the SDOF approach and ubiquitous uniaxiality, is the considerationofamultisteppowerlawformulationforthe separationphase. Thisconsiderationderivesfromthefact thatthemodelcoefficients,foreachpowerlawformulation, forthetwotests,differed. Ideally,foragivenplatformanda given model, the model parameters should be the same acrossallsalientcollisionsthattraversethesameseverity domain. Thesecondconsiderationforfuturedevelopmentis the development of a MDOF model while retaining ubiquitous uniaxiality. Such an approach would be most usefulforcollisiontestswithaclosurephasesimilartothe higher severity test considered in the subject work. This consideration requires evaluation of test vehicle fixed accelerometer data. The third consideration for future developmentistherelaxationofubiquitousuniaxiality. This consideration requires one or both of the following two approaches. The first is the use of vehicle fixed accelerometerdata. Foratypicaltest,theconfigurationof the vehicle fixed accelerometer array allows for the determination of biaxial motion, in the x-z plane, for the body of the test vehicle. The second approach for determiningthekinematicresponseofthetestvehicleisby means of videogrammetry. In theory, the process can be undertakenusingvideofromasinglefixedpositioncamera. However, it is likely that the analysis of video data from multiplecameralocationswouldbethemostappropriatefor accuratelyquantifyingtheresponseinthreedimensions.
REFERENCES
[1] D Sharma, S Stern, J Brophy, E-H Choi (2007) An overview of NHTSA’s crash reconstruction software WinSMASH. Proceedings:20th InternationalTechnical Conference on the Enhanced Safety of Vehicles, Lyon, France(June18-21,2007). Papernumber07-0211.
[2] KL Campbell (1972) Energy as a basis for accident severity– Apreliminarystudy. Doctoral dissertation: AutomotiveEngineering,UniversityofWisconsin.
[3] KLCampbell(1974)Energybasisforcollisionseverity. Society of Automotive Engineers technical paper number740565.
[4] RRMcHenry(1975)Acomparisonofresultsobtained withdifferentanalyticaltechniquesforreconstructionof highway accidents. Society of Automotive Engineers technicalpapernumber750893.
[5] RI Emori (1968) Analytical approach to automobile collisions. Society of Automotive Engineers technical papernumber680016.
[6] J Singh (2013) A fundamental reconsideration of the CRASH3 damage analysis algorithm: the case against uniform ubiquitous linearity between BEV, peak collision force magnitude and residual damage depth. TrafficInjuryPrevention14(7):18-24.
[7] CE Strother, RL Woolley, MB James and CY Warner (1986)Crushenergyinaccidentreconstruction. Society of Automotive Engineers technical paper number 860371.
[8] RRMcHenryandBGMcHenry(1986)Areviseddamage analysisprocedurefortheCRASHcomputerprogram. Society of Automotive Engineers technical paper number861894.
[9] RR McHenry and BG McHenry (1997) Effects of restitution in the application of crush coefficients. Society of Automotive Engineers technical paper number970960.
[10] JA Neptune (1998) Crush stiffness coefficients, restitution constants and a revision of CRASH3 and SMAC. SocietyofAutomotiveEngineerstechnicalpaper number980029.
[11] JF Kerkhoff, SE Husher, MS Varat, AM Busenga and K Hamilton (1993) An investigation into vehicle frontal impact stiffness, BEV and repeated testing for reconstruction. Society of Automotive Engineers technicalpapernumber930899.
[12] RL Woolley (2001) Non-linear damage analysis in accident reconstruction. Society of Automotive Engineerstechnicalpapernumber2001-01-0504.
[13] J Singh and J Perry (2008) Multilinear and nonlinear powerlowmodelingofmotorvehicleforce-deflection response for uniaxial front impacts. Accident ReconstructionJournal18(6):30-38,62.
[14] J Singh (2013) Further developments regarding the dynamicmodelingofmotorvehiclecollisionresponse usingtheSDOFapproach. Collision8(1):10-31
[15] NJCarpenterandJBWelcher(2001)Stiffnessandcrush energyanalysisforvehiclecollisionanditsrelationship to barrier equivalent velocity (BEV). Society of AutomotiveEngineerstechnicalpapernumber2001-010500
BIOGRAPHY
Mr. Singh is a private practice engineer with specialties in the fields of motor vehicle accident reconstructionandbiomechanical engineering. He holds a BS in mechanical engineering from the University of Illinois at UrbanaChampaignandaMSinbiomedical engineeringfromtheUniversityof Southern California. He has authorednumerouspeerreviewed conference proceeding papers, technical papers and scientific papers