Assessment of Air Quality in and Around Raichur Thermal Power Station, Raichur
Ashwini G1, Santosh Kumar2 , Nagesh Sugandhi3 Megha Yadav4Abstract- Thermal power plant has led to significant degradation of ambient air quality due to the release of air pollutants from the combustion of fuel.
Raichur Thermal Power Station uses coal as a fuel to produce electricity. The present study was carried out to assess the ambient air quality levels in respect of suspended particulate matter (SPM), SO2 and NOx in certain areas of Raichur Thermal Power Station, Raichur. The study was carried out for a period 45 days. The ambient air quality was monitored at three places in and around RTPS to give the representative data. Themonitoring was donefor 24hours for every 10days. Similarly stack monitoring was carried out for all the 8 units of RTPS with an interval of 10 days. The pollution control equipment used at RTPS was Electrostatic Precipitator. The performance study of this equipment was carried out. It was found to operating well with an efficiency of 99.8% and more. The dispersion of particulate matter follows the annual predominant wind direction of an area. Therefore, to identify any possible cause and effect relationship between pollutant levels and climate changes, meteorological parameters, such as temperature, relative humidity, wind speed and direction were also monitored simultaneously during the sampling period of air pollutants.
Maximal concentration of SPM are found in the sensitive area i.e., Hospital region due to the wind patterns and the concentration gradually diminished with increase in distance due to transportation, deposition and dispersion of particles. Also the concentrations of the sulphur dioxide and oxides of nitrogen were not meeting the standards for any of the stacks.
Key Words: Suspendedparticulatematter(SPM),SO2,NOx, stack,ElectrostaticPrecipitator,meteorologicalparameters, samplingperiod,etc.,
1. INTRODUCTION
UrbanizationinIndiaismorerapidaroundthemajorcities in India. Increase in industrial activities, population both endemicandfloatingandvehicularpopulationetc,haveled toanumberofenvironmentalproblems,oneofthembeing airpollution.Variouscontaminantscontinuouslyenterthe atmospherethroughnaturalandman-madeprocessesand thesecontaminantsinteractwiththeenvironmenttocause disease,toxicity,environmentaldecayandarelabelledas
pollutant.AirPollutantsmeansanysolid,liquidorgaseous substance(includingnoise) presentintheatmospherein such concentration as may be or tend to be injurious to human beings or other living creatures, plants, property, andenvironment.Airpollutionisbasicallythepresenceof air pollutants in the atmosphere. The air has a relative constantcompositionofgasesandisutilizedbymostofthe livingorganismsinrespirationtoliberatechemicalenergy fortheirsurvival.Thiscompositiondeterminesitsquality andisbeingchangedintherecentpastduetoemissionof largeamountofun-naturalmaterialsintheatmosphereby industriesandautomobiles.Thischangedqualitybecamea great threat to survival of life, properties, materials and ecosystemasawhole.
In India, Industrial developments of urban centres have posed severe threat to air pollution due to uncontrolled emissionsofpollutantsintotheenvironment.Inthecourse ofenergyproduction,coal-firedpowerplantsdirectlyemit particulatematter(PM,sometimescalled“soot”)aswellas gasesthatundergochemicalreactionstoformfineparticles intheatmosphere,suchasSO2andNOx.Theseemissionsof PM,SO2 andNOx increasetheambientconcentrationofPM lessthan2.5micronsindiameter(PM2.5)overhundredsto thousandsofkilometersdownwindoftheplants.Exposure to PM2.5 has been consistently linked with increased mortalityfromcardiopulmonarydiseases,lungcancer,and numerous other respiratory illnesses and associated morbidity.

1.1 OBJECTIVES OF THE PRESENT STUDY
1. Todeterminetheconcentrationofmajorpollutants viz., SO2, NO2 and SPM in the ambient air in and aroundRTPS.
2. TomonitorthestackatdifferentunitsofRTPS.
3. To study the performance of Electrostatic precipitator.
4. Tocomparethequalityofthecollectedairsample withrespecttotheNAAQstandards.
2. INDUSTRY AND ITS DESCRIPTION
2.1
Introduction:
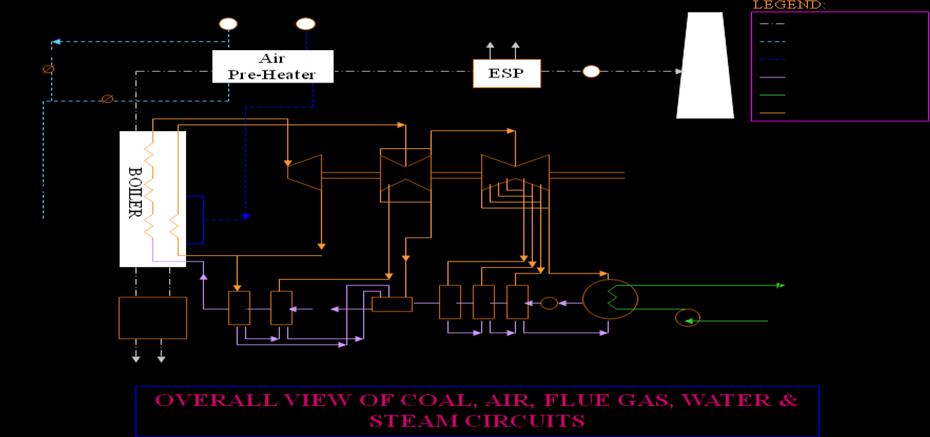
Raichur Thermal Power Station (RTPS) is a coal-fired electric power station located at 16°21′18″N 77°20′31″E 16.355°N77.34194°EintheRaichurdistrictofthestateof Karnataka, India. It is operated by the Karnataka Power CorporationLimited(KPCL)anditaccountsforabout40% of the total electricity generated in Karnataka. RTPS has eightunitsof210MWeachforunits1-7and250MWfor8th unit and it is generating around 35-40 million units of energy/day TheprocessflowdiagramofRTPSisgivenin figure3.1.
2.4 Ash Handling System:
RTPSgeneratesabout1.5milliontonnesofflyashannually which causes environmental problems. 20% of the ash producediswetbottomashwhichisletintotheashbund. Ashremovalisdonebyhydro-pneumatic/jetpumps. The bottom ash resulting from the combustion of coal in the steam generator is collected in the water impounded bottom ash hopper. The ash so collected is fed once in a shiftof8hourstoclinkergrinderwhereitisground.Flyash is extracted sequentially from the hoppers located in the fluegaspathbycreatingvacuumintheextractioncircuit using high-pressure water pumped by vertical ash water pumps through ejectors or alternatively using vacuum pumps. The fly ash thus extracted is disposed of in wet form bymixingwithwaterinwettingunits andpumping theresultantslurrybyashslurrypumpstotheashdisposal area.
An efficient electrostatic precipitator (collection in efficiencyofabout99.89%)alongwithaproperlydesigned boilerwouldkeepthestackemissionofparticulatewithin acceptablelimits.
Asthesulphurcontentincoalislow(<0.4%),SO2generated duringcombustionwouldbenominal. Moreover,a stack heightof220mwouldlimitgroundlevelconcentrationof SO2 withinacceptablelimitsbyproperdispersion.Witha properlydesignedfurnaceandburnersystem,generationof COandNOx wouldbeminimized.
2.2 Coal Handling System:
The total quantity of coal required is around 8.0 million tonnes per annum. The coal is received at RTPS by conventional box ‘N” wagons. The present coal yard is capable of storing the coal for a period of 25 days comfortablyaspertheguide-linesoftheCentralElectricity Authority.
2.3 Raw Water & Water Treatment System:
Waterrequiredforthestationisaround160-180m3/day. Raw water supply to the plant as well for the colony is presentlydrawnfrom Krishna River throughthe existing intakepumphousewouldbeadequate.Toensureadequacy, and MOEF/KSPCB stipulations, treatment of waste water and recycling at the plant has been implemented. The stationdeploysre-circulatingcoolingwatersystemtomeet the cooling water requirement by adopting natural draft cooling towers. Make-up water supplied from raw water system is provided for condenser cooling. Eight natural draft cooling towers designed for a flow rate of 32,000m3/hr per unit with a design cold water outlet temperatureof36 Careprovided.
Thestationhasbeenaccreditedwith ISO 14001 - 2004 for environmental protection management. To minimize emissionofSuspendedParticulateMatter(SPM)alongwith boilerfluegasesElectrostaticPrecipitatorsofadequatesize withanefficiencyofmorethan99.93%isprovidedatexit endoftheboilertobringdownSPMemissionlevelunder 100mg/Nm3Alltheunitcontainssingle-flueRCCstack.The stackheightdetailsareasbelow.
Flyashproductionisoftheorderof15lakhtonsperannum with 7 units in operation. A sizeable portion of fly ash is alreadybeingconsumedbylocalcementindustries,namely ACCPlant,RajashreeCementandVasavadattaCementand localSSIunitsformanufactureofflyashbricks.
3. MATERIALS AND METHODS
3.1 General
Theschemeofexperimentalmethodologywasformulatedto investigatethepotentialconcentrationofcriteriapollutants i.e.,SPM,SOx,NOxforaperiodof45daysfrom20/10/2011 to5/12/2011inandaroundRTPS,Raichur.
3.2 Ambient Air Quality Monitoring
Theambientairqualitymonitoringwascarriedoutatthree placesMainplantstationbuilding(Industrialarea),RTPS Hospital (Sensitive area), River water intake point (Restricted area) considering different criteria’s for selectingthesamplingstations.Thesamplingwasdonefor threetrials.
For the analysis of SPM and RSPM Aero Vironment’s “RespirableDustSamplerModelRDS9000”instrumentwas andsamplingwascarriedoutfor24hrs.
Fortheanalysisofsulphurdioxideambientairisinjected intoimpingeroftheinstrument“RespirableDustSampler Model RDS9000” having absorbent which is taken for chemicalanalysisaftersampling After30minsofreaction, absorbance is measured at 548nm. SOx concentration is determined using standard graph of absorbance against concentration
Analysis of oxides of nitrogen is same as SO2. Here the solution is kept for 15min for reaction to complete and absorbance is measured at 540nm. NOx concentration is determined using standard graph of absorbance against concentration.
3.3 Stack Monitoring
ThesamplingfortheanalysisofSPMiscarriedoutusingthe stack monitoring kit of Aero Vironment. The sample is drawnatthecalculatedflowratefor20mins.Theinitialand final weight of thimble is taken and the weight of dust collectedisfound.
The SOx and NOx in the stack are measured using the “QuintoxFlueGasAnalyser”.Theprobewhich sensesthe fluegasesinthestackisconnectedtotheinstrument.
Thesamplingwasdoneforallthe8unitsofRTPSanditwas carried out for three trials during the study period 20/10/2011to5/12/2011.
Table -2: TestingProcedure
4.
Theresultsofanalysisoftheairpollutantsatanintervalof 10 days duration has been tabulated in the following differenttablesforaperiodof45days(from20/10/2011to 5/12/2011).
4.1
Table -4: Stackemissionsforunit1-7
ThetableshowsthatUnit-6hasamaximumSPMvalueof 162.2mg/Nm3 during second trial which is exceeding the limit,150mg/Nm3.Thereasonforhigherconcentrationof SPMinthestackmaybeduetoincompletecombustionof coalorlesserresidencetime(<34seconds)offluegasesin theESPwhichcausedthegasestomoveoutofESPbefore treating them. The table also clearly shows that all other unitsarewithinthelimitrange.
TheconcentrationofSOxandNOxarecrossingthelimitsfor alltheunits.Thereasonforthesehighconcentrationsmay beduetousageofunwashedcoal,highsulphurcontentof coalandcombustionprocesspresentlyimplementedsuch ashighexcessair.
4.2 Results of Ambient Air Quality Monitoring:
Table -6: AmbientAirQualityMonitoring


*theunitwasshutdownduringthatdayoftrial.
Table -5: StackEmissionvaluesminimumandmaximum forthestudyperiod
Hospital
AAQM-2 Stationbuilding
AAQM-3 Intake
Table -7: AmbientAirQualityMonitoringvaluesminand maxforthestudyperiod
Thetableshowsthatduring1sttrialTSPMvaluesforAAQM1i.e.,Hospitalregion(Sensitivearea)isexceedingthelimit due to dispersion patterns and all other pollutants are withintherangeforallregions.
4.3 Results of Performance Study of Electrostatic Precipitator:
The performance study of the Electrostatic Precipitator clearlyshowsthatthealltheESP’sofalltheunitsaremore than99.37%efficient.
Table -9: DetailsofCollectingElectrode(CE)
Table -10:
5. Conclusions and Recommendations
5.1 Conclusion
Basedontheanalysiscarriedoutduringthestudyperiod thefollowingconclusionscanbedrawn:
1. The concentrations of Suspended Particulate Matter(SPM)areallwithintheprescribedNAAQ limitsexceptattheHospitalregion.
2. The concentrations of Sulphur Dioxide (SO2), Oxides of Nitrogen (NOx), Respirable Particulate Matter (RSPM) at all the locations is within the prescribed limits when ambient air quality monitoringwasdone.
3. It can also be concluded that the SPM concentrationsforall7unitsarewithinthe NAAQ standards.
4. TheSOxconcentrationandNOxconcentrationsare allexceedingthelimitsforalltheunits.
5. It can be concluded that the Electrostatic Precipitator (ESP) of all the units is performing wellwithanefficiencyofmorethan99.78%.
5.2 Recommendations to Reduce the Air Pollution
1. Equally stringent emission norms for industries needtobeenforcedformitigationofairpollution.
2. It is advocated to develop a green belt in the pollutedregionofthecitiesasoneofthecontrol measures.
3. The SOx emissions can be controlled by coal washing/beneficiation and by providing sulphur removalplantatthepre-combustionstage.
4. During the combustion stage by adding the limestonetheproductionofSOx canbelimited.
5. AndalsobyprovidingFlueGasDesulphurization (FGD)plantattheemissionends,theemissionof SOx intotheaircanbereduced.
6. NOx emissions can be controlled by combustion modification: low-NOx burners with or without overfireairorre-burning,water/steaminjection, and selective catalytic or non-catalytic reduction (SCR/SNCR).
6. REFERENCES
[1] A.ChandraandIson.V.Vanchipurackal,Performance upgradation of ESPs using difficult coal, Proc. Of 8th InternationalConferenceonElectrostaticPrecipitation, vol.2,pp.B3-1,May,14-17,2001.
[2] A. Chandra, Some Investigation on ESP Unit: Determination Improvemnet of Collection Efficiency, Proc. Of 7th International Conference on Electrostatic Precipitation,pp.499-507,September,20-25,1998.
[3] Air Pollution Sampling and Analysis (Laboratory Manual) Dr. Sharad Gokhale Department of Civil Engineering Indian Institute of Technology Guwahati Date:May2009.
[4] EmissionestimationtechniquesforFossilFuelElectric Power Genration, Environment Australia, National PollutantInventory,1999.
[5] EPA Methods 6010, 6020, 7000, 7041, 7060, 7131, 7421, 7470, 7740, and 7841, Test Methods for Evaluating Solid Waste: Physical/Chemical Methods. SW-846,ThirdEdition,November1986,withupdatesI, II, IIA and IIB. Office of Solid Waste and Emergency Response, U. S. Environmental Protection Agency, Washington,D.C.20460.
[6] H. J. White, Industrial Electrostatic Precipitation, International Society for Electrostatic Precipitation, 1988.
[7] NTPCLimited,2006. Environmental Assessment Report, India: Sipat Super Thermal Power Project (StageI andII) and Kahalgaon Super Thermal Power Project (Stage II) Prepared for the Asian Development Bank (ADB) Available at adb.org/Documents/Environment/Ind/39916-INDSEIA.pdf.
[8] Tavoulareas, E. Stratos, and Jean-Pierre Charpentier. 1995. Clean Coal Technologies for Developing Countries. World Bank Technical Paper 286, Energy Series. Washington,D.C.
[9] Techincal EIA Guidance Manual for Themal Power Plants,IL&FSEnvironment,GovernmentofIndia.
[10] World Bank Group, July 1998 “Thermal Power: Guidelines for New Plants”, Pollution Prevention and AbatementHandbook.