RELIABILITY EVALUATION OF A WIND POWER PLANT IN THE MID REGION OF KARNATAKA STATE USING MATLAB
Basawaraj Hebbale1 , Tejaswini C. Kamble21Assistant Professor, Dept. of Electrical Engineering YSPM’s YTC Satara, Maharashtra, India
2 Assistant Professor, Dept. of Electrical Engineering YSPM’s YTC Satara, Maharashtra, India ***
Abstract - The goal of this study is to create a more straightforward technique to assess the dependability of electric power output from a system that combines conventional and wind energy conversion (WECS). As wind doesn't hurt the environment, it is a cleansource ofelectricity. Yet, the results fromusingwindresourcesarenotassured.The WECS produces a variable amount of power. So, the primary goal of this research is to create a method for assessing the dependability of the output power from a wind electric conversion system. The method employed the streamlined dependability model for the wind energy conversion system is in play here. Four variables are calculated using this methodology:the windavailability factor, the constantpower output factor, the variable power output factor, and the mechanical failure factors. The heightofthetowerandstation which is shape factor (β), the scale factor (α), and other turbine designelements must betakenintoaccountinorderto determine these variables. MATLAB is used to plot sensitivity graphs for the various important parameters.
Key Words: windenergyconversion,ForcedOutageRate,
1. INTRODUCTION
The use of renewable energy sources is increasing popularityasaresultofworriesaboutglobalwarming,the security of energy supply, and the resulting effects on the economyand environment(1).This isparticularlyclear in thecaseofconvertingwindpowertoelectricityduetorapid technological advancements and large reductions in productioncosts.Globally,moreandmoremulti-megawatt sizeunits bothon-shoreandoff-shore arebeingerected, andtheriseinpenetrationlevelsthathasfollowedhasmade numerous technical andfinancial issuespublicforserious thoughtandinvestigation.

An essential infrastructure for a country's general growth and development is provided by electricity. Hence, it is envisagedthatthe powersystemwill continuallyproduce and supply electricity in the required quantities, at competitivecosts,andwithapproximately100%reliability. Yet,theinconsistenciesinthesupplyofelectricpowerare causedbythemismatchbetweenpowergenerationandload characteristics(2).Fromaneconomicstandpoint,achieving highreliabilitywithextragenerationcapacitycomparedto load is not the best course of action. Because of this, probabilisticanalysesareperformedforthepowersystems
throughouttheearlyplanningandoperatingphasesinorder toobtainthehighestlevelofreliabilitywhilestayingwithin budgetaryrestrictions.
Duetoalackofdata,anabsenceofpracticaldependability approaches,andmisconceptionsregardingtheimportance andrelevanceofsuchevaluations,probabilisticevaluations ofpowersystemswerenotconducteduntilthemiddleofthe 1960s.SincethesignificantUSNortheastblackoutof1965, much has altered. On November 9, 1965, the loss of electricityaffectedover80,000squaremilesandnearly25 millionpeopleforalmost12hours.OntarioinCanadaand Massachusetts, Connecticut, New England, Rhode Island, Vermont, New York, and New Jersey in the United States were among the states without access to electricity. Reliability Councils were established in the US to define standards, communicate information, and improve power coordination in order to prevent the recurrence of such disastersinthefuture.
The building of new power plants using coal, natural gas, nuclear,etc.waspromptedbythehighenergyneedsbrought on by the usage of sophisticated electrical equipment and changes in human lifestyle brought about by technical advancements.Issuesincludinggreenhousegases,acidrain, an increase in the amount of CO2 in the atmosphere, and globalwarmingwerecausedbytheincreaseduseofharmful resourcestogeneratepower(3).Theneedtodelivergridfriendly electricity utilising renewable energy sources resulted from this. Power has been generated since a few decadesagoutilisingbothconventionalenergysourcesand green energy sources like wind and solar. The amount of electricity produced by wind has significantly increased duringthelast20years.Thecostof generating electricity fromwindhasdroppedfrom38centsperkWhto4centsper kWhsince1980.
2. RELIABILITY OF WIND POWER
The success of wind-electric conversion system projects depends critically on the general stability of the electric power supply due to the increased penetration of windgenerated electricity into power systems. Low WECS unit dependability increases O&M costs, reduces system availability,andhasadirectimpactonprojectrevenue.Loss of load probability, often known asLOLP, is a widelyused metric to assess the dependability of the electric power
supply(6).SincetheavailabilityofelectricityfromWECSis lowerthanthatfromtraditionalunits,LOLPwillriseaswind energy becomes more integrated into conventional power systems.Thischapterdiscussessomeofthesignificantcauses ofthedecreasedavailabilityofelectricpowerfromWECS.By takingintoaccountalloftheprimaryelementsaffectingthe availability of wind turbine electric power, a simplified techniquetoassesstheforcedoutagerateisoffered.
2.1. Forced Outage Rate (FOR)
One of the most crucial factors in the estimation of component reliability is the forced outage rate. When a component is forced out of service due to emergency circumstances,thisisknownasaforcedoutage(4).Theterm "forcedoutagerate"(FOR)referstothecomponent'slongtermprobabilityofbeingfoundinthedownstate.
2.1.1. Rate of Forced Outages for Conventional Generators
The"unavailability"ofageneratingunitisacommonterm used to describe FOR. According to its definition, it is the likelihoodthattheunitwillexperienceaforcedoutagewhile runningundercertainconditionsatsomeunspecifiedpoint inthefuture(6).Emergencysituationsmaydevelopinthe caseofconventionalgeneratingunitsasaresultofstochastic weatherconditions,systembehavior,customerdemand,or componentbreakdowns.
Ifageneratingunithasconstantfailure(λ)andrepair(μ) rates of and, respectively, and its forced outage rate is establishedbyreliabilitystudies,then
2.2. WECS Output Characteristics- Factors Influencing Electric Output Availability
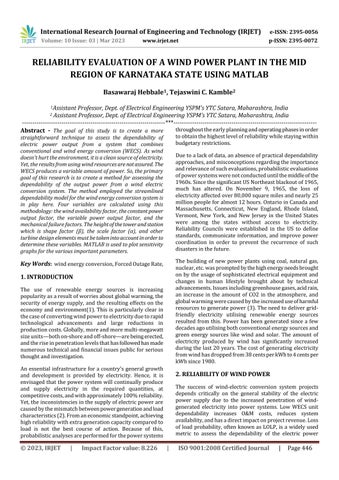
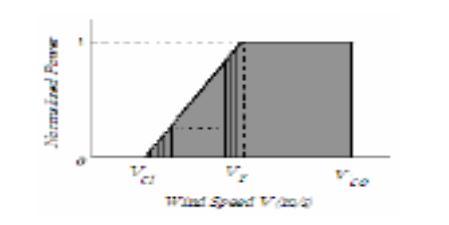
AtypicalcurveforpoweroutputfromaWECSisshownin Figure1.Awind-electricsystembeginsproducingelectricity atwhatisreferredtoasthe"cut-inspeed"(Vci).Asseenin Chart 1, it generates rated power (Pr) output over "rated windspeed"(Vr)(7).Windturbineskeepproducingattheir maximumcapacityuntilthewindspeedreachesthe"cut-out" mark (Vco). The turbine is totally turned off after Vco to preventanyharmtoitsparts(6).
Thefollowingisalistofthemainvariablesinfluencingthe availabilityofWECSand,consequently,theavailabilityofits poweroutput:
1. A WECS can produce electricity only at wind speeds betweenVciandVco.
2. Only wind speeds between Vr and Vco are capable of producingtherequiredamountofelectricity.
3. A fluctuating power output that is less than the rated outputiscausedbythepowercurve'snon-linearityfromVci toVr.
4.Extremeweathercausesmechanicalfailuresbyplacingan excessiveamountofelectricalandmechanicalstressonthe system's components. Moreover, some components will malfunctionduetoregularwearandtearandstrain.Severe mechanical failures cause the turbine toshutdown,which preventspoweroutputuntiltheproblemisfixed.
5. Beyond Vco,the grid is cut off from the wind turbineto prevent undue electrical and mechanical strain on system components.
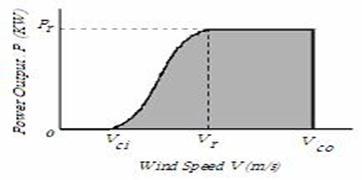
2.3. WECS Power Output Curve Approximation
The approximate power output curve of a wind-electric system is shown in Chart 2. A straight line can be used to roughly represent the non-linear portion of the curve betweenVciandVr.Thepoweroutputequationsobecomes.
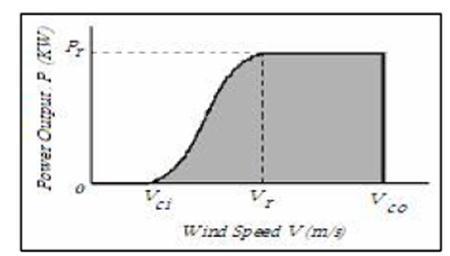
Chart
-3:ExpectedPowerOutputCalculationforVariable Portion
2.4. WECS Power Output Curve Approximation
ToaccountfortheireffectsontheFORvalueforWECS,every aspect that influences the availability of wind-powered systemsmustbeassessed.
(1) Wind Availability Factor (PWA): Itisexplainedasthe likelihoodthatthewindspeedwillfallbetweenthecut-inand cut-outnumbers.
The region from Vci to Vr's expected normalised power outputcanbecomputedbyaddingtheexpectednormalised poweroutputsthatwerepreviouslyestimatedinthismanner foreachbriefintervalinthevariablesection.Thus,
(4) Factor for mechanical failures (PMech): Given a mechanicalcomponentwithaconstantfailurerateof"λ"per hourandameanrepairtimeof"r"hours,theforcedoutage rateiscalculatedasfollows:
The mechanical components that make up a wind turbine have varying rates of failure and repair. The wind turbine stopsworkingwhenoneofitsmajorcomponentsfails.Hence, all of the components can be viewed to be logically in sequencefromtheperspectiveofreliability.TheFORofthe mechanicalsystemwillthenbethetotaloftheFORsofeach component.
(2) Constant Power Output Factor (PConst): Theprojected normalised power output in this speed range will be the likelihoodofthewindspeedlyinginthisspeedrangesince ratedpoweroutputoccursforwindspeedsbetweenVrand Vco.Hence,
ThedependabilityRforaWECScanbewrittenasthesumof allthefactorsmentionedabove.
(3) Variable Power Output Factor (PVar): Thefollowing equation can be used to compute the expected value of normalisedpoweroutputoverthespeedrangefromVcito Vr. As depicted in Chart 3, the region from Vci to Vr is separated into n discrete intervals. The likelihood that the windspeedwillbebetweenanytwonumbers,suchasV1and V2(Figure2),
( )
PVar =exp -exp 4
Next,forthespeedrangebetweenV1andV2,theanticipated normalizedpoweroutputwillbe,
RESEARCH EXAMPLES
Thechapterassessestheimpactofintegratingwindenergy intoaconventionalgenerationsystemusingtheideasofFOR and WECS' expected power production. The utilisation of publicly accessible failure data for wind power facilities owned by Suzlon Global Services Limited, Harappanahalli, Jajikalgudda,Chitradurga,Gadag,andHassanisusedinthe examplestudies.
3.1. FOR and WECS's Estimated Power Output
Threedistinctwindregimes low;moderate,andhigh with the appropriate Weibull parameters are selected for the investigationandarelistedinTable1.Cut-in,rated,andcutoutwindspeedvaluesarechosentobe3.6m/s,8m/s,and 21 m/s (1 mile/hr 2.24 m/s), respectively. Data on componentfailuresareshowninTable2andaredrawnfrom publishedliterature.Thepredictedpowerproduction,wind availabilityfactor,andWECSreliabilityvaluesareshownin Table 3 for three distinct wind regimes with the same component failure. As can be observed, depending on the wind regime, predicted power output ranges from 31%to 87%oftheratedpower(8).Higherpredictedpoweroutput values, greater unit reliability, and lower FOR values are produced by improved wind regimes. The FOR values in particular are a great deal higher than the corresponding valuesfortraditionalgenerators.
4. CONCLUSIONS
Repair times for mechanical components and approximations of output characteristics determine the forcedoutagerateforWECS.Keyfactorsareestablishedand mathematically stated using weibull parameters. These factors'sensitivitystudiestochangesinvariousparameters arelookedat.Dataonforcedoutageratesareusedtoassess thewindpowersystem'sdependability.Failureinformation
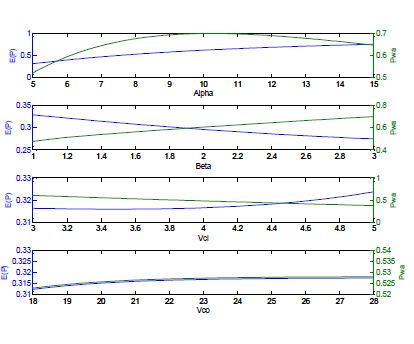
for wind energy conversion systems is gathered from a number of locations. Considered are elements including expected power output sensitivity, wind availability, and otherdesignparameterslikecut-outspeed,ratedspeed,and cut-inspeed.Findingsaredisplayedgraphically.Highwind regimes produce greater predicted output power values, lower forced outage rate values, and good reliability as expected.
REFERENCES
[1] R.Billinton and M.P.Bhavaraju,“Generating Capacity ReliabilityEvaluation”,TransactionsoftheEIC,Vol.10, No.C-5,October1967.
[2] WorldWindEnergyAssociation,NewWorldRecordin Wind Power Capacity: 14,9GW added in 2006 –Worldwide Capacity at 73,9 GW, Press Release, Bonn/BuenosAires/CapeTown/Melbourne/NewDelhi, 29thJanuary
[3] R.G.DeshmukhandR.Ramakumar,“ReliabilityAnalysis ofCombinedWind-ElectricandConventionalGeneration Systems”,SolarEnergy28(4),345-352,1982.
[4] Sami H. Karaki,Riad B. Chedid and Rania Ramadan, “ProbabilisticProductionCostingofDiesel-WindEnergy Conversion Systems”,IEEE Transactions on Energy Conversion,Vol.15,No.3,September2000.
[5] P.W.Carlin,A.S.Laxson,E.B.Muljadi,“TheHistoryand State of the Art of Variable-Speed Wind Turbine Technology”, Report, NREL/TP-500-28607, February2001.
[6] Ramakumar R., “Wind-Electric Conversion Utilizing Field Modulated Generator Systems”, Solar Energy, 20(1),pp.109-117,1978.
[7] Blaabjerg Frede, “Photovoltaic and Wind Energy in Distributed Power Systems”, PELINCEC tutorial, Warsaw,18thDecember2003.
[8] RyanWiserandMark Bolinger,“Annual ReportonUS WindPowerInstallation,Cost,andPerformanceTrends: 2006”, an Annual Report by U.S. Department of Energy,May,2007.
© 2023, IRJET | Impact Factor value: 8.226 |