A Review of _Urban Water Networks Management Using GIS
Dr.Roopa.D1, Dr.Satish K2, Dr.Harish.V31Professor Dept of Civil Engineering Sri Krishna Institute of Technology Chikkabanavara Bangalore Karnataka India
2 Associate professor Sri Krishna Institute of Technology Chikkabanavara Bangalore Karnataka India
3 professor Sri Krishna Institute of Technology Chikkabanavara Bangalore Karnataka India ***
Abstract - Useofcomputertechnologyiscommoninthe construction since the 90’s .Geographical Information System is a very useful technology in any data driven industry.Thepresentpaperreviewsontheapplicationand managementofwaterworksthroughGIS.
GISDatacanbecategorizedasspatialandnon-spatialdata, whichcanbestored,manipulated,analyzedanddisplayed with multiple users which can help in comprehensive solutions in a systematic way. GIS application is very commoninconstructionindustry,constructionsafety,flood studies,pipelinemanagementwhichincludeswaterworks andseverage.ProjectmanagementthroughGISisdifferent from GIS based projects, the review briefs about the differencebetweenthetwo.Thepipenetworkmanagement includes planning, designing, and management of the network, the planning is done using Remote sensing, photogrammetrydroneorfieldsurveymethoddependingon thebudgetandobjectivesoftheproject.Thedesigningofthe networkisdoneinGISorseparateapplicationenvironment. The final step is the operations and management of the networkwhichisin
Key Words - GIS, project, construction management, flood analysis, water works, spatial data, and non-spatial data, and spatial analysis, hydraulic simulation. Pipe network optimization
1. INTRODUCTION
Useofcomputertechnologyiscommonintheconstruction since the 90’s .Geographical Information System is a very usefultechnologyinanydatadrivenindustry.Thepresent world’seconomyisdrivenbydataanalyticsandinformation .Datavisualization,datastorageandmanipulationofdata, developmentofapplicationsarealltheimportantfeaturesof GIS,[Technol. Manag 2001] which otherwise becomes complicated by using different applications for different purposes, example, in the construction industry, different applicationslike CPMforscheduling,2DCADfordrawing. Watergemsfordesigning,Etc.
GISDatacanbecategorizedasspatialandNonspatialdata, whichcanbestored,manipulated,analyzedanddisplayed with multiple users which can help in comprehensive solutionsinasystematicway,
TheGIStechnologyhasbasically3datamodelstorepresent therealworldentitiesi.e.thepoint,lineandpolygon.These data are either collected from field survey / generated by using remote sensing satellite images by method of digitization.[Abdulla.2014]Thisdatacanberepresentedon projection system with suitable geographical references. Eachoftherealworldentitiesarestoredinseparatelayers calledshapefiles/Geodatabasesintheformofpoint,lineor polygon.Theinformationrelatedtotheselayersarestored intheattributetableofthe shapefile.Thetechnologycan conduct different analysis to obtain certain real world solution. These are called as spatial analysis. The inbuilt tools in the GIS application can modify different data into realworldinformation.
2. Applications of Gis in planning and Construction and management

ApplicationofGISiswideincity/campusplanning,flood modellingandconstructionmanagementetc.Especiallyin cityplanning,campusplanningandsafetymanagement.By adhering to 3D modelling of a city, it becomes easy to visualize the city / campus and understand the space constraintsinthearea.The3DtoolsintheGISsystemare used to simulate the functions of the buildings [Abdulla. 2014].Apart from automation technology and Radar, GIS technology finds application in safety management. Constructionactivitymanagement,watersupply,electrical andsewagemanagementetc.
Flood modelling is another important aspect where the runoff volumes are established using the rainfall data obtainedfromGPRSbasedtelemetricraingauges.Thetime series rainfall data is input into the hydraulic simulation model to obtain the flood hydrographs and the output is linkedtoGISforanalysisand visualizationpurpose.GISis veryusefultoolforfloodhazardmapping,Floodzonation, Floodindexingand3Danalysis[Dr.Roopa.D.2018]
Severalresearchhavebeendoneonsafetymanagementin construction industry. Sensor technology like GPS (Global positioning system), RFID, can give real time information whichcanpredictaccidents.ModellingtechnologylikeBIM, 3D,4D,virtualrealityareusedforsafetymanagement.[V.K. Bansal (2011)].GIS applied in construction safety management plays a key role in integrating the project
activitiesandidentificationofaccidental/emergencyspots during the construction activities geographically. The GIS basednavigationcanbevisualizedin3Dtodemonstratethe project planning, construction schedule and identify the accident zones and also the activities involving risks and accidents.
CPM method provides features of scheduling activities relatedtotimebasicallysplitsthedifferentactivitiesbased onstartandendtime.Thescheduleisbasicallyassociated with the drawings and its different components like the beam,column,walls,footingfoundationetc.theactualstart andendoftheexecutionofthesecomponentsiscalculatedin theCPM(Criticalpathmethod)sayV.KBansal
Following the design drawings and executing at the construction site leads to lot of gaps and improper monitoringofthewholeactivity.Severaladvancementsin thetechnologyhasgivenwayto4DCAD,whichisexcellent in visualizing the conflicts between scheduling, evaluate alternative construction methods. These methods though advanced,itisnotveryuserfriendlyandcustomizable
The application of the Gis technology in construction industryisinallcrucialphasesoftheprojecti.e.duringthe feasibility study, planning design phase and also the constructionPhase,shortlistingofthecontractors,suppliers prequalificationetc.[MohamedN.Jeljeli,etal1993.].Thesite suitabilitystudycanbedoneusinghighresolutionsatellite imageriestodecideonthesite.Thelocationofthesiteand the nearest path to reach the site, planning of the transportation of the materials, man power can be done usingGIStechnology.Theestimationoftheearthworkand project costing can be done using the 3D tools in GIS. Especiallyforthehighwayalignment,utilitynetwork,rail network etc. It finds its application in the construction managementwheretheprogressmonitoring,materialand manpowermovementneedstobeplanned
3. GIS project management.
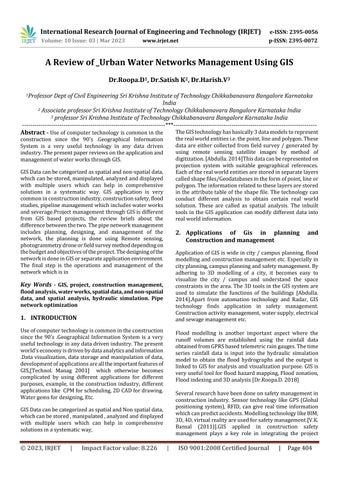
Fig: 1 ComponentsofGISProject
GISbasedprojectmanagementisaboutmanagingcomputer application,implementation,client/stakeholder,andalso theprojectteams[Dr.ZakariaYehiaetal2021].Projectcan be defined as a continuous tasks being performed to find solution/ outcome to a problem identified by the client/ stakeholder.Itincludesdefiningaproblemorahypothesis, Planning and execution of several activities exclusively or parallelinagivenperiodoftimeinvolvingskilledmanpower andtechnology.Theresultsofprojectistangibleoutcometo helptheorganizationorsociety.
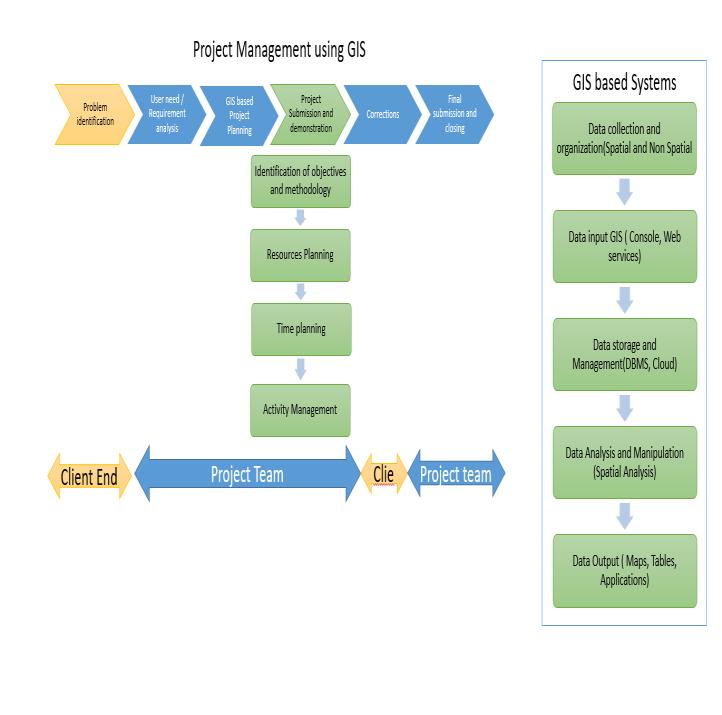
When a project is initiated by an organization it includes several departmentsliketechnical,HR,Qualityetc.Thisis mainly to divide the roles and achieve maximum optimizationoftheprojectworks.AGisprojectwillhavethe severalcomponentsasshownintheFig:1severalprojects can use GIS for Project management like monitoring and managementofUtilityservices,Constructionmanagement etc. A GIS based project is different from project management using GIS. A GIS project is about using the technology in the defined project in order to achieve a solutionoranoutcome.AGISbasedprojectmanagementis aboutincludingallthescheduleandactivitiesofaprojectin aGISsystemandusingspatialtoolstomanagetheproject. Example: using GIS tool to monitor the progress of pipe laying work at a project site. The following process is involvedinmanagingtheprojectFig:2
TheaboveprocessclearlyexplainshowGIScanbeusedfor managing a pipeline laying work process and helps in decisionmaking.Asuccessfulproject involvesincomplete understanding of the problem, and a good strategy to achieve the objectives of the project with required manpowerandtime.
4. GIS for Urban utility water management
TheapplicationsofGIStoolsinurbanwatermanagementis reviewedinthispaperItis themostuseful andupcoming applicationsofGISbasedsystems,TheGISbasedtoolsare widely used for Planning, operations and management of utilitynetwork..Urbanwaternetworksincludesbothwater supply and sewerage networks. Urban water networks managementincludes,theplanning,designing,executionat thesiteandoncepipenetworksarelayer,theoperationsand managementofthewholenetwork.Thecomplexityinurban water management is; it involves large networks running across the municipal boundaries and different teams are workingatdifferentphasesofthenetwork.TheusageofGIS shallprovideagoodvisualizationofthenetworkandhelps intheentirenetworkmanagement.TheGIStoolsaremainly used to plan the layout of the network, initially after the reconnaissancesurvey.Thelargenetworkhastobelaidon varyingtopography.Networklayoutcanbeplannedusing high resolution satellite images. Digital elevation model (DEM)isusedtoestablishthealignmentandcalculatethe earth work quantities using the 3D tools in GIS. Once the designofthealignmentiscompletedthehydraulicdesignof thepipenetworkiscarriedout.Variouscomputingmodels areusedtodesignthenetworktoarriveatthesuitablepipe size based on the availability and distance of the water availabilityatthesource.Themodelledpipenetworkisthen linkedtoGISwithallthedesignattributesofthepipelayout. The design parameters include the length, diameter,
directionofflow,numberofnodes,junctions,elevationetc. Thesearethecriticalinformationofwaterworkswhichcan beusedforfurtheroperationandmaintenanceofthewhole system during the laying and functioning of the water managementsystem.
5. GIS based network management system
5.1. GIS based Pipe network Data model
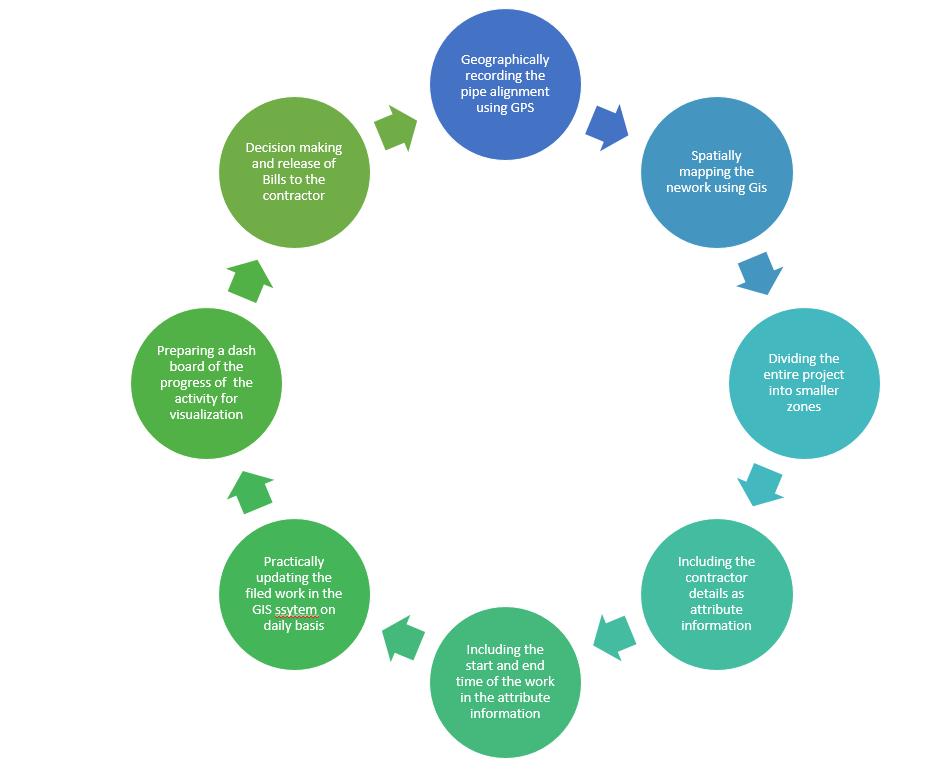
A typical pipe network system has the following feature entities 1) Reservoir (Source) 2) Pipe network 3) Pump system 4) Junction 5) Valve 6) Storage tank Fig:.3 These feature entities have their specific attribute information whichareverybasicforpipenetworkmodelling
5.2. Generation / creation of the Pipe network data
The network data is scientifically designed based on the watersupplysourceavailableandthequantityofwaterto be distributed. The alignment of the network depends on topographyoftheareaandthesourcetostorageandsupply distances. GIS helps in planning of the source and the distribution system. Then the alignment is planned using satelliteimageandthedesignentitiesareaddedduringthe designofthepipelinesduringthemodellingofthenetwork. Thedesigningofagooddatamodelinvolvesinhavingthe correctandthe necessaryinformationaboutthenetwork. Thedatamodelshouldbefinalizedbeforethepipenetwork analysis.[Pablo2020].Duringthesimulationofthenetwork theusefulinformationisretainedandanyinformationwhich doesaddvaluetothedecisionmakingtaskisremoved.
Fig: 3 Elementsofwatersupplynetwork
5.3. GIS data creation and topological Validation
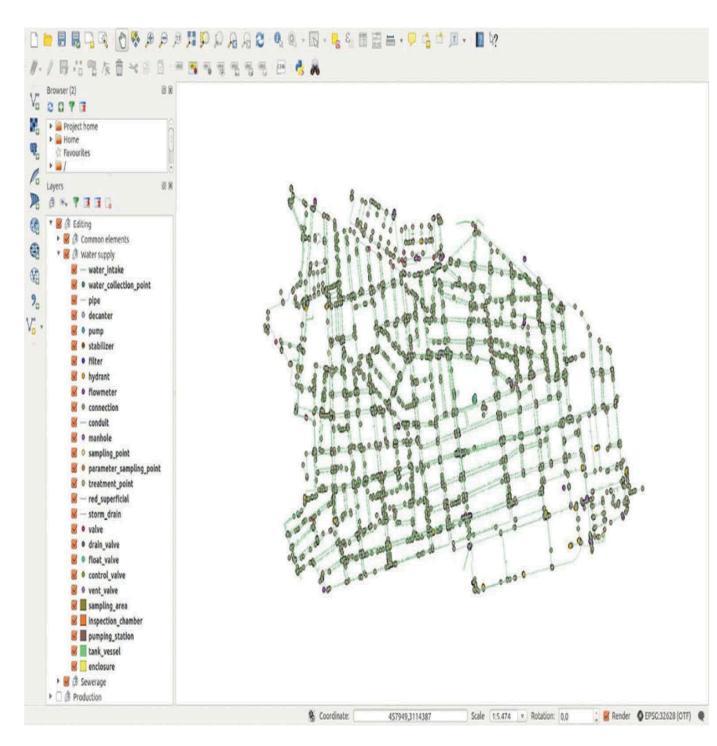
Pipe network data is created using GIS technology, either opensourceorproprietarysoftware’s. AccordingtoPablo FernándezMoniz.All,GISsoftware’sshouldincludesmart capabilities to ease the complex geoprocessing. The digitizationprocedureshouldhavesufficientflexibilitiesto makeusefulchanges.Asdatacreationisoneofthecrucial steps in the pipe network management. All edits should happenduringthedesignphase.Usuallytheeditdatabase doesallthechangesandtheproductiondatabaseshallnot be disturbed. The production database gets updated
frequently. The network design of a sample network is as shownintheFig:4
Source:AbdullaAl-RawabdehGIS-basedsolutionforurban water management GIS-based solution for urban water management
Theprocessofpipenetworkdatacreationisshownbelow Fig:5
Source:WaterInternationalAGIS-basedsolutionforurban watermanagement:PabloFernándezMoniz
6. Hydraulic modelling using GIS
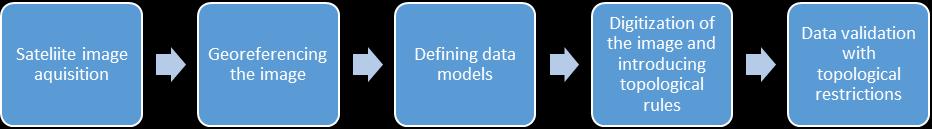
Topological validations are essential for pipe network modelling/simulations.Theinputintothedesignmodelhas tobeclearoferrors.Thisprocessbeginsaftertheeditingof thenetworkiscompletedwithalladditionalandisreadyto inputintothesimulationmodel.Thevalidationofnetwork data introduces robustness and integrity in the data. The processofvalidationinvolvesaddingsometopologicalrules tothenetworkdatawhiledigitization
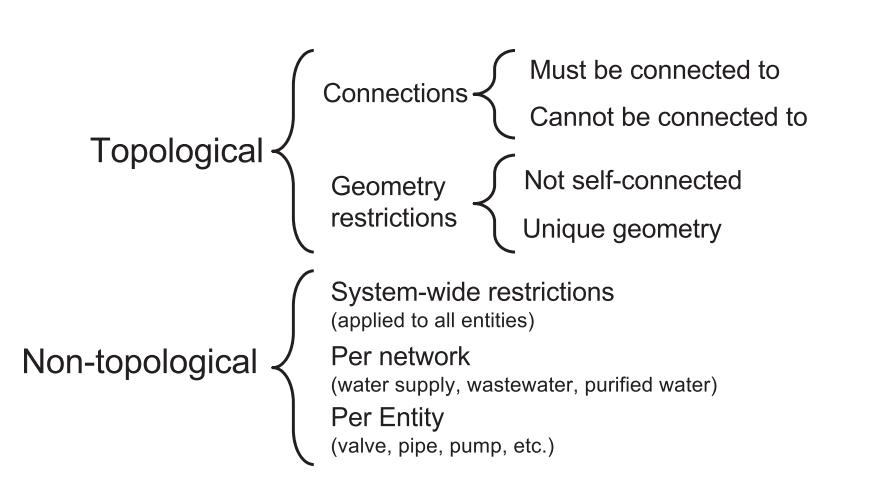
According to Pablo Fernández Moniz ET. Al some of the simpletopologicalvalidationforanetworkdataincludes1) 2 lines must not overlap 2) pipe ends must always be connected 3) no two polygons must overlap etc. Once the datadigitizationiscomplete,thevalidationprocessindone byrunningthroughtherestrictionwhicharepredefinedin thedatamodel.TherestrictionscanbeTopologicalornontopological. The details of restrictions for a pipe network dataisasshowninFig6[vijaylkanti,ETal.2004]
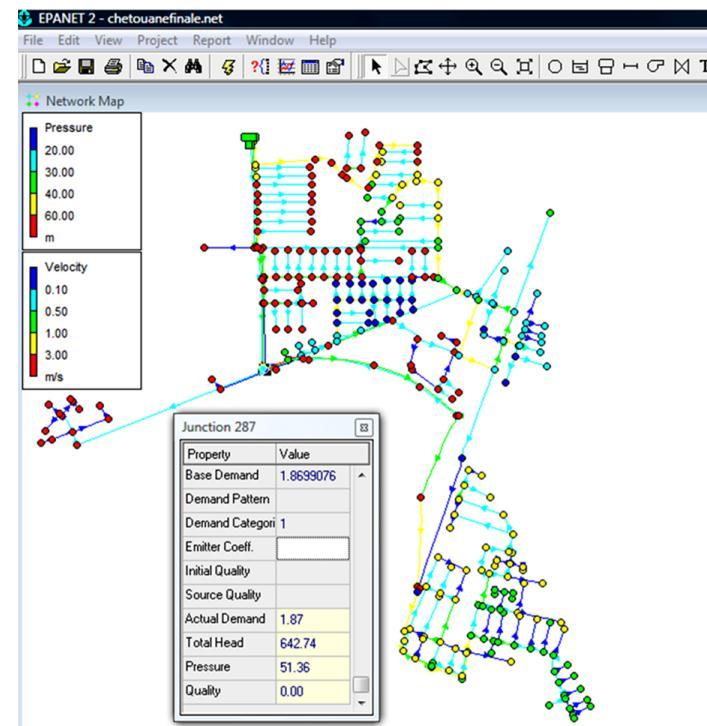
Many models are available in the market for hydraulic modelling,itcanbeopensourceorproprietarysoftwarefor eg:QGISbasedonPostgreSQLArcGisusingSQLetc.Pablo Fernándezetal.2020].hydraulicmodellingsoftware’slike EPA SWMM, EPANET, HEC RAS, HEC GeoRAS etc. can be integrated with GIS.[ J. YOO*,]March 2005] GIS software’s helpinstoringthecomplexspatialdataofthepipenetworks suchaspipediameter,numberofvalves,numberjunctions, manholes, direction of water/sewerage flow etc. The developmentofthehydraulicmodellingsoftwarehavebeen improvingtocopeupwiththecomplexissuespertainingto data quality, interoperability etc.[ Pablo Fernandez et al.2020].The Role of the network simulation model is to analyzethenetworkforitsflowparameterslikethepressure, velocity and direction. In a case study of Chetouane water distribution network in Algeria, EPANET was used for the hydraulic simulation where all the line networks in .DXF format were converted in the EPANET. Additional pipe networkparameterslikelocationofthetanks,pumps,valves nodes,junctions,manholesetc.weremanuallyaddedusing the features in the EPANET Fig:7.Simulations were performedtoarriveatconsumptionprofileateachnetwork. Pressure distribution, and the velocity distribution at the each of the networks. The advantage of such GIS based applicationsis,theAnalysisandthevisualizationhappensin thesameenvironment.Alsobackgroundimagedataofthe specificstudyareahelpsinunderstandingthesiteconditions inascientificway.Also3Dsimulationscanbeusedtoshow theprofileandtheflowvariationsofthenetwork.
Source:Che´rifaAbdelbaki:ApplwaterSci:Managementofa waterdistributionnetwork bycouplingGIS andhydraulic modeling:acasestudyofChetouaneinAlgeria
7. GIS integration with other applications
Foreffectivepipenetworkmanagementmanydraftingand designapplicationsarecoupledwithGIS.forexampleCAD with GIS, EPANET with GIS, SWMM with GIS etc. [Che´rifa Abdelbaki et al.2016]. These applications can be used for identification of the best network routing, shortest path, optimisednetworkalignmentetc.
The CAD applications are used generate pipe network drawings,thesefilesarein.DXFformatandnowthesecanbe migratedtoGISenvironmentintheformofshapefileformat. Once the details of the network are in GIS, the attribute information is added to it. Checked for topology and the processfollowsasshowninFig;6.
InApplicationslikeEPANETthedetailsofnetworkimporting along with its characteristics can be done by the inbuilt operationswithintheEPANET[s(Hoetal.2010)].Thereare different layers of the pipe network which are stored differently in the form of point, line and polygon. Several spatialanalysisandqueriescanperformedinGIS.Basicallyto identify the best route, identify the network which are malfunctioning.Toidentifytheageofthepipenetworketc.
[AhmadM.Salahetal.2011]8. GIS based pipe alignment optimization
The present paper has discussed several applications and usageofGISinwaternetworkmanagementsystem.Another important and challenging application is optimization of a network. Automated optimization is a better option than
manualrouteoptimizationandGISapplicationscanhandle thismoreeasily.[AhmadM.Salahetal.2011],howeverfor majorpipelines,thebestknowledgefromthefiledexpertand stakeholderscanvalueaddfordecisionmaking.Thenetwork AnalysttoolsinArcGISisthebestoption.AlsoHierarchical BestRoutealgorithmwhicharemodelbasedalgorithmsgives best identification of the optimized routes. Which helps decisionmakingsaysAhmadM.Salahetal.2011]
9. GIS based Operations and maintenance of the pipe networks
Once the pipe network is laid and fully functional with all connectionsbetweensourcestodistributioniscompletedby theexecutioncontractor.Thelastandcontinuousprocessis operationandmaintenanceofthewholesystem.Inreality thewholeofthisworkisoutsourcedbythemunicipalitiesin urbanareastocontractorswhobasicallyusetechnologyto maintaintheirworks.
GIStechnologyonceagainisaveryusefultoolwhichhelpsin thisprocess.Themaintasksofthemaintenanceteamisto continuously monitor the networks. Usually the entire network right from source to distribution is divided into severalzonesandthenhandedovertodifferentteamsforthe same.One ofthe well-known technologyin the operations and maintenance of the pipe network is SCADA system (SupervisorycontrolandDataacquisition).Whichisasensor basedsystemthiscanbelinkedtoGISformonitoringofthe network.Thepipenetworkisconnectedwithdifferenttypes of sensors which constantly give information about the networkparameterslikeflow,velocity,pressureandother variations. The SCADA system is linked to a GIS system, whereallthedetailsofthenetwork canbe visualized.The sensorsconstantlysendinformationwhichcanbevisualized in the GIS interface, this will indicate the problematic variations in pressure and velocity. It also indicates the breakdown of pipes. All these information’s are critical aspects of operation and maintenance. The SCADA technology thus saves time and energy to identify the defectivelines.
10. CONCLUSIONS
GIS based urban water works management has detailed about the concepts of GIS technology and use of this technologyforprojectmanagementforvariousapplications of GIS, The process of GIS base project management highlights about the different steps in the project .the differentsectorswhereGISiswidelyusedareconstruction management, flood studies, construction safety and water worksmanagement.Thepresentpaperwidelyreviewsthe GIS application in water works management. This mainly involves in planning, designing, construction and maintenance of the pipe networks. Remote sensing technologyisusedforplanninganddata generation ofthe pipenetwork.Duringthedatagenerationthreekindsofdata
model i.e. Line, Point and Polygon is used to create the networkwithsuitabletopologyvalidations.Oncethenetwork is generated the design parameters of the network are obtainedfromRSandotherhydraulicmodellingsoftware’s likeSWMMandEPANET.Hydraulicdesignofthenetworkis either done in separate environment or linked to GIS. The paper also discuss about the optimized routing using algorithmswhichwillresultinefficientnetworks.Lastlythe paperthrowslightonhowtheoperationsandmaintenanceof thenetworkisdoneduringthefunctioningofthenetwork. Several research has been carried out on the hydraulic modelling and application integration in GIS. The future scopeofthewaterworksmanagementisthequantificationof waterlossesinthepipenetwork.Itisverydifficulttoidentify theleakagesinthepipenetworkwhichisbelowtheground. Extensive research needs to be done in the pipe network managementrightfromlayingofthenetworktooperation andmanagement.Itisverychallengingtasktodeterminethe ageofthepipenetworks.Asmostofthenetworksarenot mapped and no data on the pipe network is available. GIS plays a very important role in the mapping and database managementofthenetworkdata.Thereneedstobelotof researchdoneonthesame.
REFERENCES
[1] AbdullaAl-Rawabdeh,NadhirAl-Ansari,HussainAttya and Sven Knutsson Jan. 2014 “GIS Applications for Building 3D Campus, Utilities and Implementation Mapping Aspects for University Planning Purposes” JournalofCivilEngineeringandArchitecture,,Volume 8,No.1(SerialNo.74),pp.19-28ISSN1934-7359,USA
[2] Ahmad M. Salah, P.E, Gisp, Denis Atwood, February 2011“PipelineAlignmentOptimization:AutomatedGISBased Approach” journal of pipeline systems engineeringandpractice.
[3] A.M. Shehata, N.A. Koshak, “Using 3D GIS to Assess EnvironmentalHazardsinBuiltEnvironmental”,Journal ofAlAlzharUniversity,EngineeringSector,Cairo,Egypt, 2006.
[4] Che´rifaAbdelbaki,MohamedMouaˆdBenchaib,Salim Benziada , Hace`ne Mahmoudi ,Mattheus Goosen” Management of a water distribution network by coupling GIS and hydraulic modelling: a case study of ChetouaneinAlgeria”Journalofwaterscience
[5] Dr. Zakaria Yehia Ahmed Thebes “GIS Project Management”
[6] Dr.Roopa.”Urban flooding feasible structural measure and solutions for Bangalore vrishabhavathi valley region”2018, InternationalJournalofCivilEngineering andTechnology, 9(10),pp.1473–1480
[7] Mohamed N. Jeljeli, ~ Jeffrey S. Russell, Associate Member,. Guy Meyer, Member, ASCE, and Alan P. Vonderohe, 2020 “Implementation of virtue campus “InternationalWaterResourcesAssociation
[8] Pablo Fernández Moniz , Jaisiel Santana Almeida , AgustínTrujilloPino&JoséPabloSuárezRivero“AGISbased solution for urban water management” Water InternationalISSN:(Print)(Online)Journalhomepage
[9] PostgreSQL.(2017).Continuousarchiving.PostgreSQL. https://www.postgresql.org/docs/9.6/sta tic/continuous-archiving.html
[10] J.YOO,“GIS-basedsimulationofurbansewerageflow” UrbanWaterJournal,Vol.2,No.1,March2005,1–12
[11] Y. Ma, J. Ruan, “The design and implementation of campusinformationsystemsbasedonGIS,”J.EastChina Inst.Technol.(NaturalScience)9(3)(2009)90-96.
[12] vijaylkanti,mohammedNajafi,Ahmmedhabiban2004 “RoleofGISinPipelineIndustry”CopyrightASCE
[13] V.K.BansalInternationalJournalofProjectManagement 29(2011)66–77],“PotentialApplicationAreasofGISin Preconstruction” Planning Associate Member, ASCE J. Constr.Eng.Manage.1993.119:72-86]