Rides Request Demand Forecast- OLA Bike
Abdul Khayyum FarooquiResearch Scholar, Department of Computer Science and Engineering
Sreenidhi Institute of Science and Technology, Hyderabad 501301, India

***
Abstract: - The market shares and significance of ridehailing or TransportationNetworkCompanies(TNCs)like Uber, Lyft, and Ola are growing in numerous transportation markets. Big data technology and algorithms should be utilized to analyze the huge amounts of information accessible to enhance service reliability, estimate the efficiency of these systems, and assist them in meeting thedemands of passengers.Inthis study, anovel model is developedusingdatafromOla,the leading ride-hailing service in Bangalore, toestimatethe gap between rider demands as well as driver supply in a particular time periodand specifiedgeographiclocation. Thedatasetusedin this study was ariderequestdataset. This dataset would have the following attributes: ride booking time, pickup location, and drop point latitudelongitude. The number of data points related to ride requests are, the columns of the data are Id of the customer, timestamp booking, pickup latitude, pickup longitude, drop latitude and drop longitude. On the phone-based Ola application, a passenger "calls a ride," (makes a request) by inputting the point of origin and destination and tapping the Request Pickup button. A driver answers the request by taking the order. Even while the training set is little in comparison to the whole Ola ride-hailing industry, it is large enough for patterns to be found and generalized.
Keywords: -BigData;Ride-Hailing,K-meansClustering; XGBoost; Root Mean Squared Error
1.INTRODUCTION
Theride-hailing(Ola)servicesectorhasbeenexpandingfor a fewyears,anditisanticipatedtocontinue expanding in near future. Ola drivers must decide where to wait for passengers since they may arrive rapidly. Additionally, passengers like an immediate bike service whenever required. People who have issues with booking Ola bikes, whichsometimescannotbefulfilledorthewaittimeforthe arrivalofthetripisparticularlylengthyowingtothelackof anearbyOlabike.IfyousuccessfullyreserveanOlabikein onego,consideryourselffortunate[1]
Olaisacquiringagreatermarketshareandsignificanceina varietyoftransportationmarkets.Bigdatatechnologiesand algorithms should be employed to handle the enormous amountsofinformationthatareavailabletoenhanceservice
efficiency[2].Thiswillallowformoreaccurateestimatesof efficiency as well as assistance in meeting the needs of riders[3].Thisworkdevelopsamodeltoforecastsupplyand demand mismatches using information from the leading ride-hailing company in Bangalore. The percentage of Indianswhotravelbytaxi,bus,orrailisamongthehighest intheworldandfewoftheIndians1.4millionresidentsown automobiles [4]. The leading ride-hailing business in Bangalore, Ola, handles more than 1 lakhrides daily and gathersmorethan5GBofdata.
It has become important for Ola (and other e-haling) companytoforecastthedemandfortheirOlabikessothat theymaybetterunderstandthatdemandandmaximizethe efficiencyoftheirfleetmanagement.
A novel model based on users' ride request dataset is proposed to address these problems; it would include characteristicssuchasridebookingtime,pickupplace,and drop point latitude-longitude. This model would predict demandforacertainperiodinvariouscityareas,assisting thebusinessinmaximizingthedensityofOlabikestomeet consumerdemand.
The rest of this paper is organized as follows. Section 2 discusses about the related work. In Section 3 the Background is presented. Methodology of the study is presentedinSection4.Section5showstheobtainedresults anddiscussion. ThepaperisconcludedintheSection6.
2.RELATED WORK
[5]Hadexaminedtheproblemofattemptingtoforecastthe supply-demandgapinride-sourcingservicesoverthenear term.Incontrasttothepreviousstudies,whichdividedacity areaintoanumberofsquarelattices,thisstudydividedthe city area into a number of regular hexagon lattices. This difference in approach was motivated by the fact that hexagonalsegmentationhasanunambiguousneighborhood definition, a smaller edge-to-area ratio, and isotropy. The studyproposedthreehexagon-basedconvolutionalneural networks (H-CNN), the input and output of which are multiple local hexagon maps, in order to capture the spatiotemporal properties in a hexagonal fashion. A hexagon-basedensembletechniqueisdevelopedtoenhance predictionperformance.TheH-CNNmodelsaredetermined to greatly beat the benchmark algorithms in terms of
accuracyandrobustnessafterbeingvalidatedwitha3-week realworldride-sourcingdatasetinGuangzhou,China.
[6] had developed a model for ride hailing demand forecastingthatwasbasedondeeplearninginaneffortto reachhighlevelsofaccuracywhendealingwithchallengesof a similar kind. This also addressed a constraint that is present in previous models for predicting ride hailing demand, which is that the region is organized into a rectangle grid, and all travel demand projections are performedwithinrectangularcells,ratherthaninsidecity neighborhood zones. The suggested model estimates demand for travel between city neighborhood zones. The proposedmodeloutperformstheCNNandLSTMmodelsup to18.41%inRMSEand22.65%inR2 values,according to trialsusingareal-worldrentalcardatasetinNewYorkCity.
[7] had provided several machine learning algorithms in order to characterize and forecast the demand for ondemandride-hailingservicesinthenearfuture.Thespatiotemporalestimateofdemand,whichisafunctionofvariable effectsrelatingtotraffic,price,andenvironmentalfactors, wasalsoproposed.Intermsofthemethods,asingledecision tree,bootstrap-aggregated(bagged)decisiontrees,random forest, boosted decision trees, and an artificial neural network for regression have all been adapted and systematically compared using a number of different statistics,suchasR-square,RootMeanSquareError(RMSE), andslope.Withanaggregated-timeintervaloftenminutes, 199,584time-slotsthatdescribethespatio-temporalridehailingdemandhavebeenextractedfromthedata.Onthe basis of two independent samples from this dataset, all techniquesaretrainedandvalidated.Thefindingsshowed that boosted decision trees, artificial neural networks, randomforests,baggeddecisiontrees,andsingledecision trees all provide the greatest prediction accuracy while minimizingthedangerofover-fitting.
3.BACKGROUND
3.1 Mini-batch k-means clustering
When clustering on enormous datasets, the Mini-batch KmeansclusteringtechniqueisanalternativetotheK-means algorithm. Because it does not cycle over the complete dataset,itsometimesoutperformsthetraditionalK-means method when dealing with large datasets. It generates random batches of data to be kept in memory, and then gathers a random batch of data during each iteration to update the clusters. The Mini-batch K-means algorithm's primary benefit is that it reduces the computing cost (time)offindingacluster.AlthoughtheK-meansmethodis also used,but when working on a huge dataset, the minibatchapproachisutilized.
3.2 Multi-step time series forecasting
Predictingasuccessionofvaluesinatimeseriesisknownas multistep-aheadprediction.Acommonstrategy,knownas multi-stageprediction,involvesapplyingapredictivemodel step-by-stepandusingtheanticipatedvalueofthecurrent timesteptocalculateitsvalueinthenexttimestep.Multistep forecasting is useful where the field of application requireslong-termdurationforecasting[8].
Predicting the subsequent H values
of a historical time series
madeupof obsN observationsisknownasa multi-step ahead (also known as long-term) time series forecasting problem. where H > 1 denotes the forecasting horizon.
Therearefivedifferenttypesofcomputationmethodsfor forecastingmultiplestepsinahead.Inthisstudy,recursive approachistakenintoconsideration.
3.2.1 Recursive strategy
The Recursive (also known as Iterated or Multi-Stage) technique is the most traditional and logical method of forecasting. In this method, a single model f is trained to carryoutaone-stepforecast[9]
WhenpredictingHstepsin advance,startbyapplyingthe modeltothefirststep.Usethevalueyoujustpredictedas oneoftheinputfactorsforpredictingthenextactionafter that(usingthesameone-stepaheadmodel).Continueinthis wayuntilthewholehorizonhasbeenforecasted.
Let ^ f represent the trained one-step-ahead model. The forecastsarethengivenby
Therecursivetechniquemayperformpoorlyinmulti-step forwardforecastingjobs,dependingontheamountofnoise inthetimeseriesandtheforecastinghorizon.Infact,thisis particularly true if the embedding dimension d is greater than the forecasting horizon h, since at that point all the inputs are predicted values rather than real observations (Equation 2). The Recursive method is sensitive to the accumulation of mistakes with the forecasting horizon,
which is the cause of the probable inaccuracy. As these projections are used to inform later forecasts, any errors existing in intermediate forecasts will be propagated forward.Despitethesedrawbacks,theRecursiveapproach hasbeensuccessfullyusedtopredictavarietyofreal-world timeseriesutilizingvariousmachinelearningmodels,such asnearest-neighborsandrecurrentneuralnetworks.
4.METHODOLOGY
Ridehailingcompanies(suchasOla)arelosingmoneyand market share to their competitors, due to their failure to satisfythetripdemandsofmanyconsumers.Tosolvethis issue,anovelmodelispresentedouttoforecastthedemand for rides in a particular area and during a certain time period.
Dataset: Thedatasetusedinthisstudywasariderequest dataset. This dataset would have the following attributes: ridebookingtime,pickuplocation,anddroppointlatitudelongitude.Thenumberofdatapointsrelatedtoriderequests are, the columns of the data are Id of the customer, timestampbooking,pickuplatitude,pickuplongitude,drop latitudeanddroplongitude.
Everyuserhasauniquecustomerid,thebookingtimestamp is the date and time of the ride booking (IST time), the pickuplatitudeistheriderequestpickuplatitude,thepickup longitude is the ride request pickup longitude, the drop latitude is the ride request drop latitude, and thedrop longitudeistheriderequestdroplongitude.
Data Preparation: Inordertocreateapredictionmodelfor thedemandfor ridesina certainarea ata giventime,the data must first be preprocessed to determine the actual estimateddemandbyconsumers.Ieliminatedrequestsfor rides that were very likely to be problematic in order to evaluatethegenuinedemand.
If multiple bookings are made from the same latitudeandlongitudewithin‘h’hoursofthemost recent booking, only count the first ride request madebytheuser.
Considerjustoneriderequestfromauserifthere aremorethanonewithin'm'minutesofthemost recentbookingtime(latitudeandlongitudemayor maynotbethesame)
If the geodesic distance between the pickup and drop-off points is less than 50 meters, the transportation request should be regarded as fraudulent.
Consider the following ride requests as a system error:["6.2325274","35.6745457","68.1113787",
"97.395561"] All requests where the pick-up or drop-offlocationisbeyondtheboundsofBangalore.
Wedon'twanttoprovideintercityridesorlengthy bike excursions; thus, we remove such services if the geodesic distance between the pick-up and drop-offpointsismorethan500km.
Clustering Regions (pickup latitude and longitude) with Mini-Batch K-means
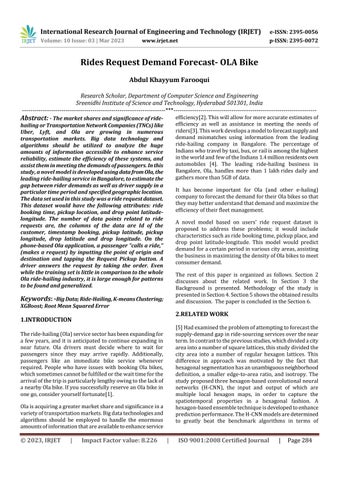
Due to the fact that geographical data cannot be used for demand forecasting activities, geospatial engineering was necessary. Given 4 million data points, using standard Kmeansforclusteringwouldtakehoursofcomputingtime. Consequently, via a technique known as "Mini Batch KMeans Clustering," we have subdivided the whole of Bangaloreinto50distinctzones.
Mini-Batch-K-Meansisa variationoftheK-Meansmethod thatstillaimstooptimizethesameobjectivefunctionwhile usingmini-batchestospeedupprocessing.Ineachtraining cycle,mini-batches,whicharesubsetsoftheinputdata,are randomlypicked.Byusingthesemini-batches,theamountof computationneededtogeta local solutionisdramatically reduced.Mini-batchk-means,incontrasttoothermethods thatspeedupk-meansconvergence,yieldsresultsthatare often only marginally inferior than those of the standard approach.
Data Features
TheresultantfeaturesarecustomerId(uniqueIdgivento eachuser),bookingtimestamp(bookingtimestampofride IST)andpickupclusterId(thisiscomputedbyclustering overpickuplatitudeandlongitude).
Todeterminethenumberofdemand/riderequestsfroma region:Inordertocollectthenumberofcustomeridsthat booked trips from those areas during that timeframe, we splittimeinto30minintervals,creatingatotalof24Hours* 2=48(30minintervals).
Multi-Step Time Series Forecasting
Thechallengeofanticipatingasuccessionofvaluesinatime seriesisknown asmultistep-aheadprediction.Applyinga predictive model step-by-step and using the anticipated value of the current time step to calculate its value in the nexttimestepisacommonstrategyknownasmulti-stage prediction.
Test the signal's self-similarity across a range of delay durationsbyperforminganauto-correlationtest.Knowing whethertouselatencyfeaturesishelpful.
On experimenting and modeling it was observed: For forecasting best set of features were:
pickup_cluster:region_idcomputedbyclusteringof pickuplat-long.
mins:Bookingtimebrokeninto30minsintervals
hour:thehourofbookingtheride
month:bookingmonth
dayoftheweek:dayoftheweekwhentheridewas booked;weekendsdemandislessthanweekdays
lag_featureof7steps:previousdemandsasinput(7 is used by analyzing autocorrelation and partial autocorrelationplots).
rollingmeanoflast7steps:slidingwindowmeanof last7ridedemands
Train test split:
Thetraintestsplitmethodisusedtosplitthedataintotrain andtestsets.First,weneedtodividethedataintofeatures (X)andlabels(y).Thedata-framegetsdividedintoX_train, X_test,y_trainandy_test.X_trainandy_trainsetsareused fortrainingandfittingthemodel.TheX_testandy_testsets are used for testing the model if it’s predicting the right outputs/labels.wecanexplicitlytestthesizeofthe train andtestsets.
Train set: The training dataset is a set of data that was utilizedtofitthemodel.Thedatasetonwhichthemodelis trained.Thisdataisseenandlearnedbythemodel.
Test set:Thetestdatasetisasubsetofthetrainingdataset thatisutilizedtogiveanaccurateevaluationofafinalmodel fit.
Validation set: Avalidationdatasetisasampleofdatafrom your model’s training set that is used to estimate model performancewhiletuningthemodel’shyper-parameters.
Extreme gradient boosting (XGBoost)
Extreme gradient boosting, also known as XGBoost, is an algorithmthatisbuiltontopofagradientboostingtreeand hasthepotentialtosignificantlycontributetotheprocessof gradient improvement. When it comes to solving issues involving regression and classification, XGBoost, which is based on the theory of classification and regression trees, isahighlyeffectivesolution.Inaddition,XGBoostalsostand forasoftcomputinglibrarythatintegratesGBDTtechniques together with the recently developed algorithm. After optimization,theobjectivefunctionofXGBoostiscomposed oftwodistinctelements,whichreflectthedeviationofthe modelandtheregulartermtoavoidover-fitting.Theseparts work together to achieve the goal of maximizing the predictive power of the algorithm. , iiDxy is a notationfor a data setthat hasnsamples and mfeatures,
andinwhichthepredictivevariableisanadditivemodelthat iscomposedofkbasicmodels.Thedatasethasnsamples andmfeatures.Theoutcomesofthesamplepredictionare asdetailedinthefollowing:
Where ^ iyy standsforthepredictionlabel, ixx foroneofthe samples, ki fxx fortheprojectedscore,and fortheset of the regression tree, which is a tree structure with the parameters s, fxx , and w representing the weight of leavesandthenumberofleaves,respectively.
InXGBoost,theobjectivefunctiontakesinto accountboth the conventional loss function and the complexity of the model. It is possible to utilize it to assess the algorithm's operating efficiency and effectiveness. The first term in Formula(5)reflectstheconventionallossfunction,whilethe secondterminthatformulaindicatesthecomplexityofthe model.
ofthesecalculations.Additionally,thecomplexityofthetree isadjustedusing and .Thefinallearningweightmaybe
Here i is the number of samples in the dataset and m denotesthetotalamountofdatafedintothe th k treeinboth smoothedusingregularizationtopreventover-fitting.
Model evaluation:
RMSE:
TheRootMeanSquaredError(RMSE)isoneofthetwomain performanceindicatorsforaregressionmodel.Itmeasures theaveragedifferencebetweenvaluespredictedbyamodel andtheactualvalues.Itprovidesanestimationofhowwell themodelisabletopredictthetargetvalue(accuracy).
where:
SSEw=WeightedSumofSquares
W=Totalweightofthepopulation
N=Numberofobservations
wi=Weightofthei-thobservation
ui=Errorassociatedwiththei-thobservation
5.RESULTS AND DISCUSSION
Fig-1: Clusteringwithminibatchk-means
Theabovefigureshowsthepostclusteringregiondivision forBangalore,theminibatchk-meansclusteringalgorithm isusedtodividetherequiredclusterheads.Theclusteringof latitudeandlongitudeiscompletedandtheclustersdivided into50pickupclusters.
Theabovefigures3and4showsthepartialautocorrelation, itisameasureofthecorrelationbetweentimeserieswitha lagged version of itself after eliminating the variations alreadyexplainedbytheinterveningcomparisons,fromthe figures it is observable that the partial autocorrelation functionshowsahighcorrelationwiththefirsttwolagand lessercorrelationwith3rd and4th lag.
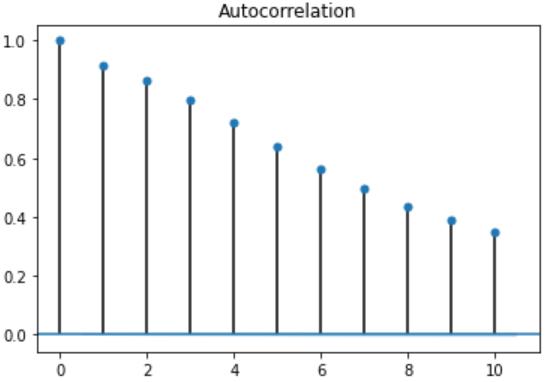
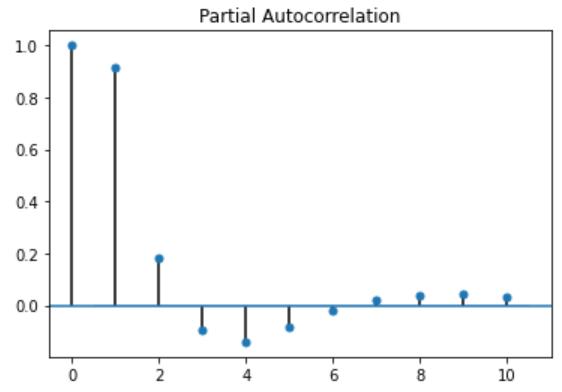
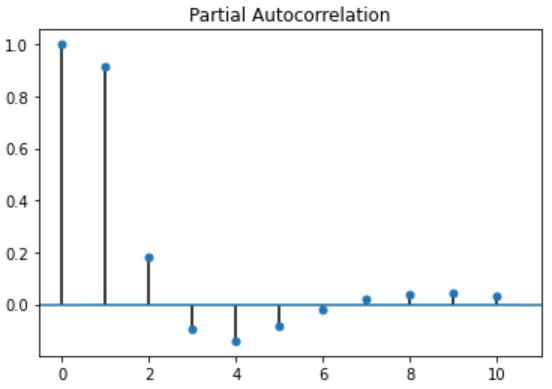
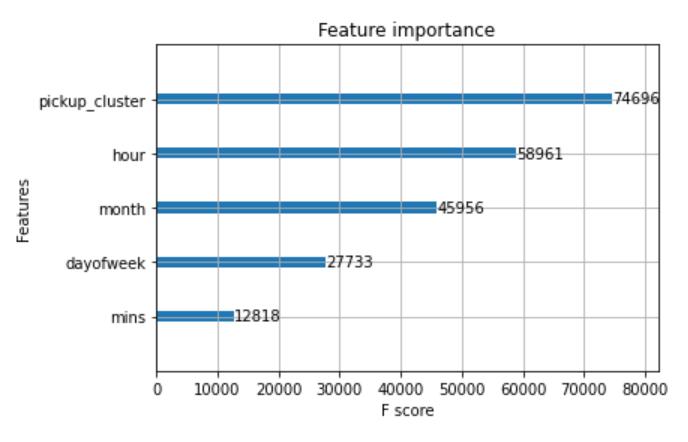
Fig-2: featureimportance
Theabovefigureshowstheimportanceofthefeatures,the pickupclusterfeaturescoreis74696,hourscoreis58961, month score is 45956, day of week score is 27733 and minutesscoreis12818.
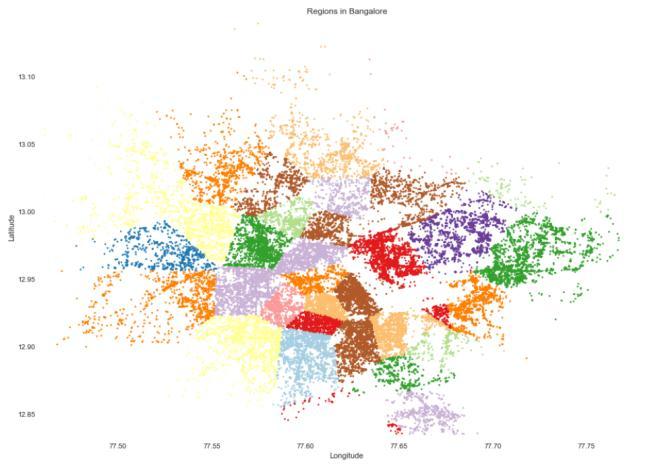
Theabovefigure5istheAutocorrelationfunctionplot,itisa measureofthecorrelationbetweenthetimeseriesandthe laggedversionofitself.Fromthefigureitisobservablethat the autocorrelation function shows a slow decay, which means that the future values have a very high correlation withitspastvalues.
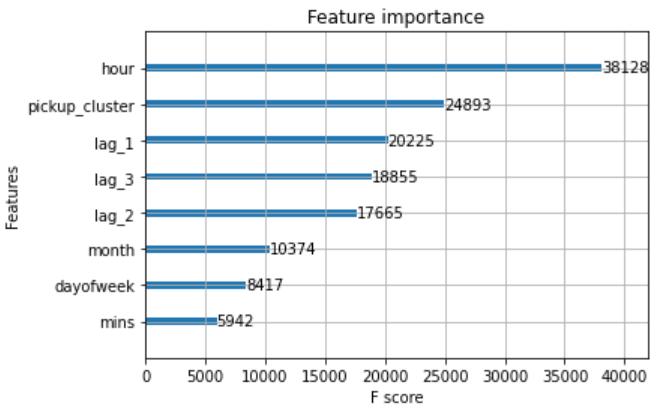
Fig-6:Featureimportance
Theabovefigureshowstheimportanceofthefeaturewith Random-Forest,fromthefigureitisobservablethatthehour featurescoreis38128,pickupclusterfeaturescoreis24893, lag1 score is 20225, lag 2 score is 17665, lag 3 score is 18855,monthscoreis10374,dayofweekscoreis8417,and minutesscoreis5942.
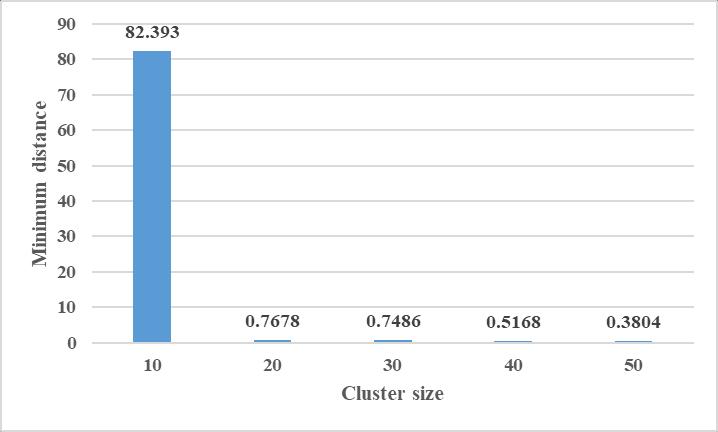
Fig-8:InterClusterDistance
Theabovefigure6showstheinterclusterdistancebetween twoclusters,theinterclusterdistancerequiredislessthan 0.5miles.Fromtheabovefigureitisobservablethattheinter clusterdistancefor50clustersis0.3804,sothenumberof clustersconsideredinthisworkare50.
6.CONCLUSIONS
In order to handle the issue of ride demand forecasting, a novel XGBoost regressormodel is proposedin this work. Thedatapreprocessing,geospatialengineeringmethodsare utilizedtoconvertlatitudeandlongitude,toclusterIdusing Mini-Batch Kmeans algorithm, and then multi-step forecastingisusedtoforecastthedemandforriderequests coming from an area at a certain time. The proposed XGBoost Regressor model score is 0.916, and the RMSE valuesfortrainandtestare2.287and2.456.
REFERENCES
[1] J. Ke, H. Zheng, H. Yang, and X. (Michael) Chen, “Short-termforecastingofpassengerdemandunder on-demand ride services: A spatio-temporal deep learning approach,” Transp. Res. Part C Emerg. Technol., vol. 85, pp. 591–608, 2017, doi: 10.1016/j.trc.2017.10.016.
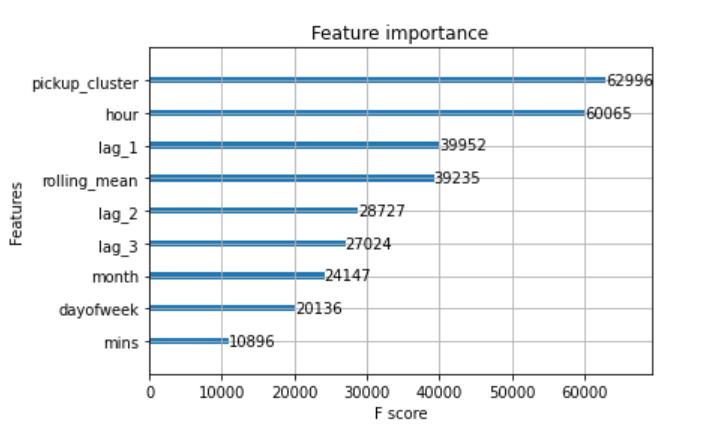
Fig-7:FeatureImportanceGraph
The above figure shows the importance of the feature in XGBoost, from the figure it is observable that the pickup clusterfeaturescoreis62996,hourfeaturescoreis60065, lag1scoreis39952,rollingmeanscoreis39235,lag2score is28727,lag3scoreis27024,monthscoreis24147,dayof weekscoreis20136,andminutesscoreis10896.
[2] X. Zhou, Y. Shen, Y. Zhu, and L. Huang, “Predicting multi-step citywide passenger demands using attention-based neural networks,” WSDM 2018Proc. 11th ACM Int. Conf. Web Search Data Min.,vol. 2018-Febuary,no.February,pp.736–744,2018,doi: 10.1145/3159652.3159682.
[3] G. Cantelmo, R. Kucharski, and C. Antoniou, “LowDimensional Model for Bike-Sharing Demand Forecasting that Explicitly Accounts for Weather Data,” Transp.Res.Rec.,vol.2674,no.8,pp.132–144, 2020,doi:10.1177/0361198120932160.
[4] C. Guido, K. Rafal, and A. Constantinos, “A low dimensional model for bike sharing demand forecasting,” MT-ITS 2019 - 6th Int. Conf. Model. Technol. Intell. Transp. Syst., 2019, doi: 10.1109/MTITS.2019.8883283.
[5] J. Ke et al., “Hexagon-Based Convolutional Neural Network for Supply-Demand Forecasting of RideSourcingServices,” IEEE Trans. Intell. Transp. Syst., vol. 20, no. 11, pp. 4160–4173, 2019, doi: 10.1109/TITS.2018.2882861.
[6] Z.AraandM.Hashemi,“Ridehailingservicedemand forecastbyintegratingconvolutionalandrecurrent neuralnetworks,” Proc. Int. Conf. Softw. Eng. Knowl. Eng.SEKE,vol.2021-July,no.Ml,pp.441–446,2021, doi:10.18293/SEKE2021-009.
[7] I.Saadi,M.Wong,B.Farooq,J.Teller,andM.Cools, “Aninvestigationintomachinelearningapproaches for forecasting spatio-temporal demand in ridehailing service,” 2017, [Online]. Available: http://arxiv.org/abs/1703.02433
[8] C.Wang, Y.Hou,andM.Barth,“Data-DrivenMultistep Demand Prediction for Ride-Hailing Services Using Convolutional Neural Network,” Adv. Intell. Syst. Comput., vol. 944, pp. 11–22, 2020, doi: 10.1007/978-3-030-17798-0_2.
[9] S. Ben Taieb, G. Bontempi, A. F. Atiya, and A. Sorjamaa,“Areviewandcomparisonofstrategiesfor multi-stepaheadtimeseriesforecastingbasedonthe NN5forecastingcompetition,” ExpertSyst.Appl.,vol. 39, no. 8, pp. 7067–7083, 2012, doi: 10.1016/j.eswa.2012.01.039.