Shipment Time Prediction for Maritime Industry using Machine Learning.
Aditya Deshpande1 , Harsh Gaglani21 Senior, Dept. of Mechanical Engineering, K.J. Somaiya College of Engineering, Mumbai, India.

2 Senior, Dept. of Mechanical Engineering, K.J. Somaiya College of Engineering, Mumbai, India ***
Abstract - Managing overseas supply chains efficiently requires accurate prediction of shipping time, as it is a critical aspect of operations and advanced information systems. However, while short-term travel time predictions can be made using real-time Global Positioning System and optimization methods, long-term shipping time prediction remains a persistent challenge.
To address this challenge, we have developed a machine learning model using the Pythonprogramming language and its extensive library collection. Our model utilizes various algorithms, including the Linear Regression model, and treebasedDecisionTree andRandomForestRegressoralgorithms, to predict shipment delivery time. We conducted extensive experiments to evaluate the model's performance under various usability scenarios.
Our results demonstrate that accurate shipment time prediction can significantly reduce delays in postal services. Furthermore, we show that the machine learning model used to predict shipping time for different shipment types has varying levels of accuracy based on the algorithm employed.
Our study has significant implications for the management of supply chains, as accurate shipping time prediction can help companies avoid costly delays and optimize their operations
We anticipate that our machine learningmodelwillbeusedas a valuable tool bysupply chainmanagers invariousindustries to improve the efficiency of their operations and enhance customer satisfaction. Moreover,ourresearchunderscoresthe importance of continued investment in machine learning and predictive analytics in supply chain management to address the challenges posed by an increasingly complex and globalized business landscape.
Key Words: Machine Learning, Decision Tree, Linear Regression, Random Forest Regression, Supply Chain Optimization, Predictive Analytics, ShipmentTime Prediction.
1. INTRODUCTION
Thefieldofsupplychainanalyticshasbeenstudiedforover acentury,butwithadvancementsinmathematicalmodels, data infrastructure, and supporting applications, it has undergonesignificantchanges.Mathematicalmodelshave
improved considerably with the use of better statistical techniques,predictivemodeling,andmachinelearning.Asa result, supply chain analytics is becoming increasingly important,asevidencedbyitspredictedCompoundAnnual Growth Rate of 17.3% from 2019 to 2024, more than doubling in size. This growth indicates that supply chain companies are recognizing the benefits of being able to predict future outcomes with a reasonable degree of certainty.
AsIndustry4.0 approaches, data collectionandtheuse of predictive analytics have become essential for companies that wish to remain at the forefront of their respective industries.Ourmodelcanserveasaninitialprototypefor developing a comprehensive predictive analytics tool that coverstheentireshipmentjourney.Byleveragingthepower of predictive analytics, supply chain companies can gain insights into their operations and make data-driven decisionsthatimproveefficiency,reducecosts,andenhance customersatisfaction.
Hence,thefieldofsupplychainanalyticsisevolvingrapidly, andcompaniesthatfailtoadaptriskbeingleftbehind.Our model representsa steptowardsharnessingthepowerof predictiveanalyticstoenhancesupplychainoperationsand maximize profitability. As the industry continues to grow and evolve, we anticipate that predictive analytics will become an increasingly essential tool for supply chain companies seeking to remain competitive in a rapidly changingbusinesslandscape.
1.1 Dataset
The Shipping Optimization Challenge dataset, which was obtained from the open-source dataset library website Kaggle,wasusedforthisproject.Thedatasetincludesacsv file called "shipping_data," which contains historical shipments with known shipping times and can be used to trainthemodel.Thefilecoversshipmentsovera16-month periodfromFebruary14,2019,toJune13,2020.Thecsvfile containsthefollowingelements:
[1] Shipmentid:(system-generatedshipmentidentity).
[2] Sendtimestamp:(exacttimewhentheorderwassent).
[3] pickuppoint:(abbreviationforthepick-uppoint).
[4] Dropoffpoint:(abbreviationforthedrop-offpoint).
[5] Sourcecountry:(thecountryfromwherethegoodsneed tobeshipped).
[6] Destination country: (the country to where the goods willbeshipped).
[7] Freightcost:(thetransportationcostperkilogram).
[8] Gross weight: (the gross weight in kilograms of the shipment).
[9] shipmentcharges:(thefixedcostpershipment)
[10] Shipmentmode:(themethodofshipment,suchasairor ocean).
[11] Shippingcompany:(thecandidateshippingcompany).
[12] Selected:(whetherthecompanywasselectedornot).
[13] shipping_time:(theamountoftimeittakesforgoodsto reachtheirdestination).
1.2 Data Cleaning, Analysis and Preprocessing
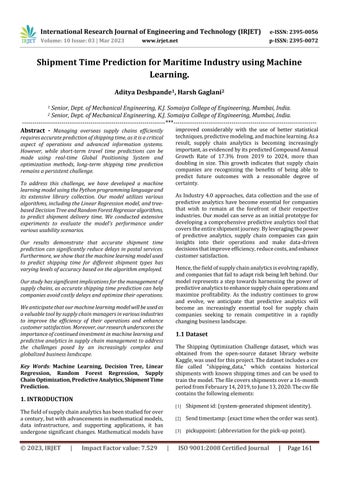
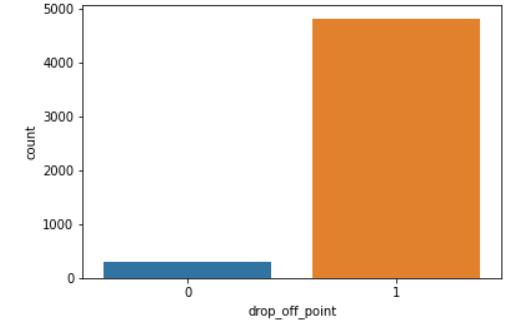
Upon obtaining the dataset, the initial step we undertook wastodetectmissingornullvaluesinthedata.Toachieve this,weutilizedthe.isna().sum()function,whichdisclosed that there were no null values present in the dataset (Table1). Thus, we inferred that the data was suitable for furtheranalysis.
However,ifthedatasethadcontainednullvalues,wewould have imputed the missing numerical values with the mean/medianandthecategoricalvalueswiththemode.As thiswasanacademicdataset,itcontainednogarbageornull values, obviating the need for any such data cleaning measures.
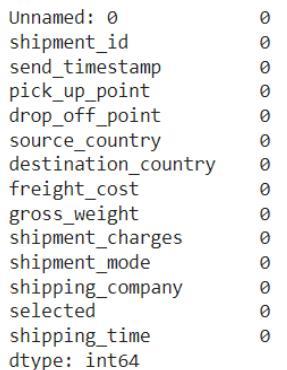
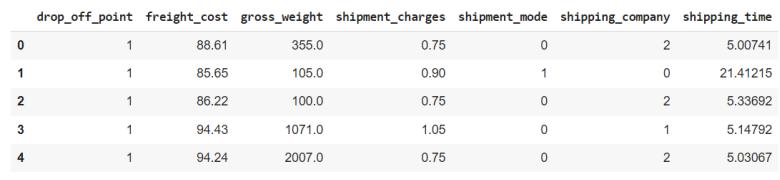
Followingdatapreprocessingandnullvaluedetection,we conductedFeatureEngineeringtoidentifythemostsalient featuresforanalysis.Ouranalysisrevealedthatoutofthe13 features available in the dataset, only 7 were relevant for furtheranalysis.Weutilizedthe'drop'functiontoremove the irrelevant feature columns, creating a new dataset (Table2) that consisted of only 7 features, of which 6 features were independent, and 1 was dependent, i.e., the shippingtimemeasuredindays.
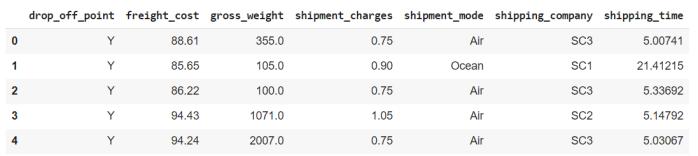
During our analysis, we found that the columns "drop_off_point,""shipping_mode,"and"shipment_company" contained categorical data. However, since our machine learningmodelcannotprocesscategoricaldata,weneeded toconvertitintonumericaldata.Toachievethis,weutilized the LabelEncoder method from the scikit-learn library to transformthecategoricaldataintonumericdata.
Weevaluateddifferentencodingmethods,includingOne-Hot Encoding, Label Encoding, among others, and determined thatLabelEncodingwasthemostsuitablemethodforour dataset. Label Encoding converts categorical data into integer labels, with each label representing a unique category.Thismethodenablesthemachinelearningmodel toprocessandanalyzethedataeffectively.
Ourapproachofconvertingcategoricaldataintonumerical datausingLabelEncodinghasseveraladvantages.Firstly,it isastraightforwardprocessandcanbeexecutedusingafew lines of code. Secondly, it preserves the ordering of the categoricaldata,whichcanbeessentialforsomedatasets. Finally,ithelpstoimprovetheoverallperformanceofthe machine learning model by enabling it to analyze the categoricaldataandmakeaccuratepredictionsbasedonthe inputdata.
In conclusion, our decision to use LabelEncoder for converting categorical data into numeric data was an effective strategy that helped us to process our data effectively and improve the performance of our machine learningmodel.
TheLabelEncoderfromthescikit-learnlibrarywasusedto convertthecategoricaldatatonumericaldata,resultingin the categorical data being represented as 0's and 1's (Table3). This process ensured that all the data was in a numericalformatandcouldbeutilizedforExploratoryData Analysis.
2. Exploratory Data Analysis
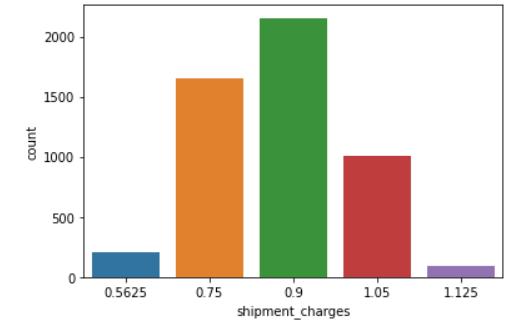
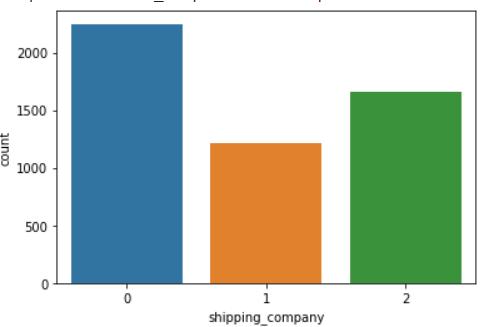
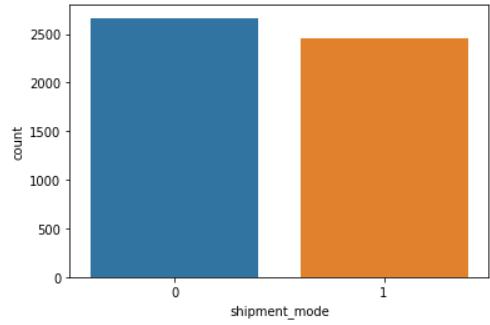
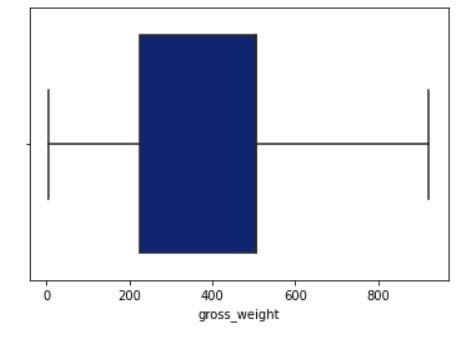
Aftercompletingthedatapreprocessingstep,wemovedon to conduct exploratory data analysis (EDA). To better understand the distribution of shipment mode, shipment charges,shippingcompany,anddrop-offpoint,weutilized boxplots.Boxplotsareagraphicalrepresentationofdata thatdisplaythedistributionofdatathroughtheirquartiles. Theboxportionoftheplotcontainsthemiddle50%ofthe data, while the whiskers extend to the minimum and maximumvaluesofthedata.Thisallowedustoidentifyany outliersandgaininsightsintothedistributionofthedata.
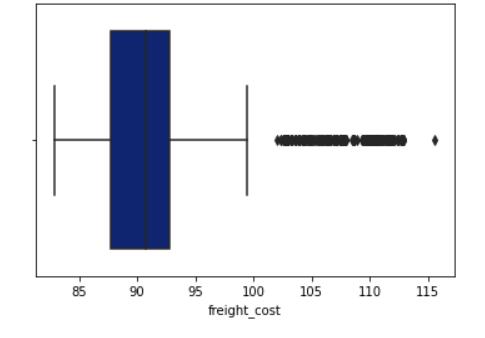
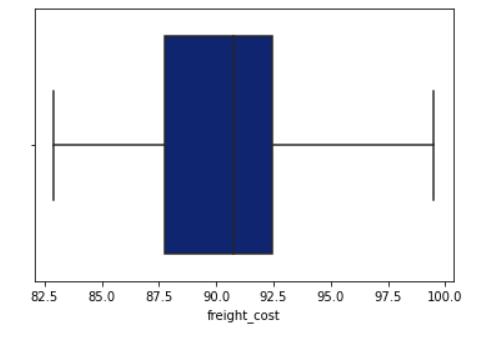
Toidentifyanyoutliersinthedataset,weutilizedBoxand Whiskerplots.Thefollowingplotsummarizesourfindings:
AsobservedfromtheBoxandWhiskerplot,the'freight_cost' and'gross_weight'featurecolumnscontainedoutliers,which couldadverselyaffecttheaccuracyofouranalysis.Outlier reductionisacrucialstepinExploratoryDataAnalysis,as outlierscanleadtoskewedresultsandinfluencetheoverall outcome.
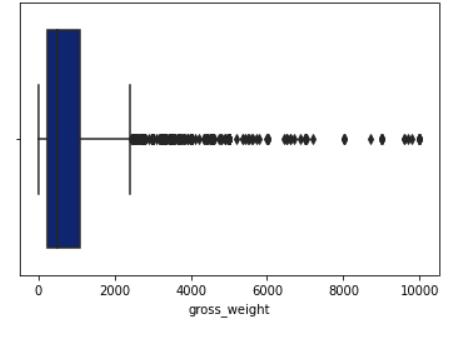
To address this issue, we removed these outliers by confiningthedatabetweenthefirstandthirdquartile,thus ensuringthatthedatapointswerewithinareasonablerange andwerenotextremevaluesthatcouldimpacttheaccuracy ofouranalysis.(Chart7,Chart8)
Uponremovaloftheoutliers,thedatasetwasupdatedwith thenewoutlier-freedata.
ThisisreflectedintheupdatedBoxandWhiskerplots,which showthattherangeofthedataisnowmorereasonableand therearenoextremevaluesthatcouldadverselyaffectour analysis. Therefore, we utilized this updated dataset for furtheranalysis.
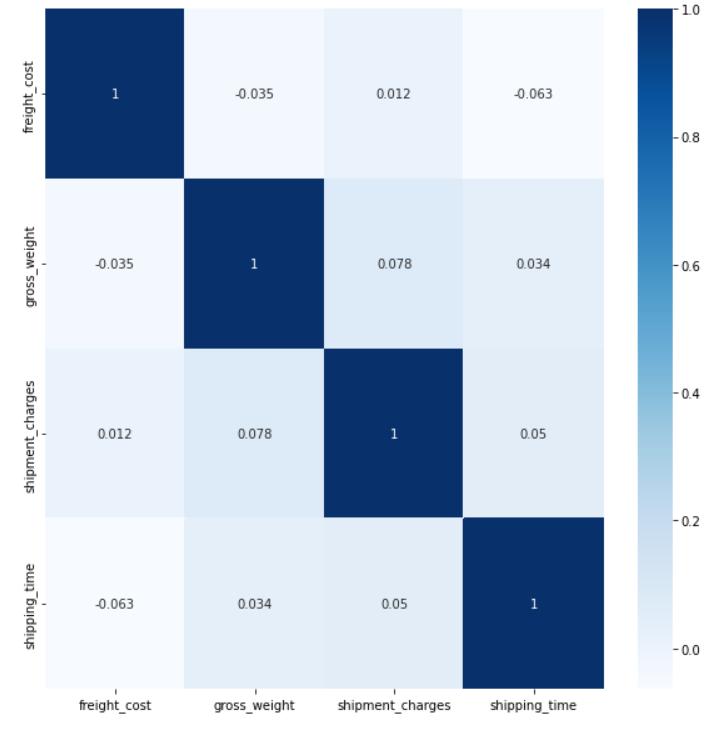
To visualize the strength of correlation between the numerical variables in the dataset, we utilized the tools available in the sci-kit learn's matplotlib library to plot a correlation heatmap (Chart9). This heat map provided us with valuable insights into the correlations between the differentvariablesinthedataset.
3. ANALYSIS
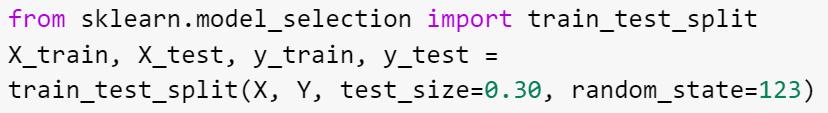
Oncewecompletedtheexploratorydataanalysis(EDA),we divided the dataset into training and testing sets for the purpose of machine learning. To split the dataset, we employed sci-kit learn's train_test_split function, which separatedthedataintoa70-30ratiofortrainingandtesting, respectively.Wetookutmostcareinchoosingthesplitratio toensurethatourmodelwasnotoverfittingtothedata.By doing so, we verified that there was no overfitting or underfitting present in the model, thereby enhancing its performanceandreliabilityforfuturepredictions. Moreover,wealsoemployedcross-validationtechniquesto further validate the model and ensure that it was not overfittingthedata.Usingthecross_val_scorefunctionfrom sci-kit learn, we measured the model's performance on different subsets of the data, allowing us to verify its accuracyandconsistencyacrossvariouspartsofthedataset. Thisenabledus tohavegreaterconfidence in the model's abilitytogeneralizewellandmakeaccuratepredictionson new,unseen data.Hence,ourrigorous approachto model validation using both train-test split and cross-validation techniquesensuredthatourmodelwasrobustandcapable ofmakingaccuratepredictions.
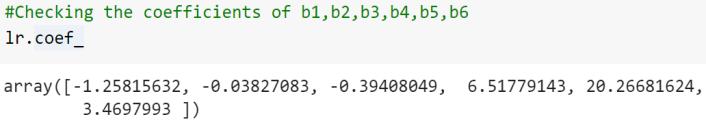
Uponcheckingthecoefficientsofregressionweobtainedthe followingdata(Figure2).
To accurately predict shipping time, we opted for the multiplelinear regression model asourdatasetcontained several independent variables and only one dependent variable (Figure 1). Multiple linear regression is a widely used statistical method for modeling linear relationships between multiple independent variables and a dependent variable.
Ourapproachinvolvedfittingalinearequationtothedata andestimatingtheregressioncoefficientsthatexplainthe relationshipbetweenthevariables.Thecoefficientsobtained from the model can be used to predict the shipping time accuratelyforfutureshipments,makingitapowerfultoolfor decision-makingandimprovingshippingprocesses.
Byusingmultiplelinearregression,wewereabletomodel thecomplexrelationshipbetweentheindependentvariables and the dependent variable accurately. This helped us to identify the factors thataffectshippingtimethe mostand make data-driven decisions to optimize our shipping process.Overall,multiplelinearregressionprovideduswith valuableinsightsintotheshippingprocessandenabledusto makeinformeddecisionsthatimprovedtheefficiencyand accuracyofourshipments.
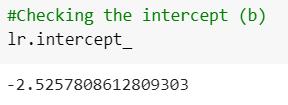
Theinterceptoftheregressionanalysiswasfoundouttobe asfollows(Figure3):
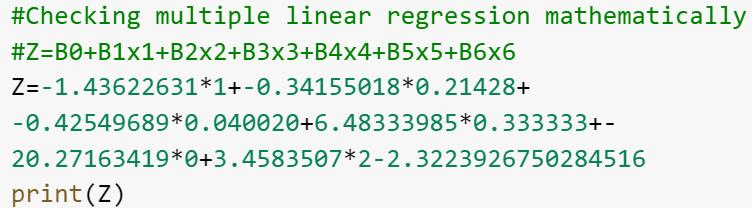
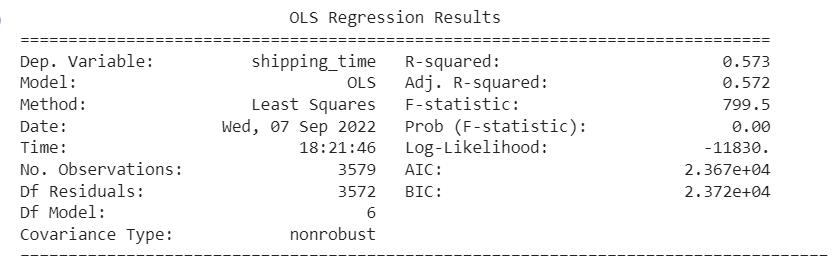
ToverifythattheMachineLearningmodelismathematically correctweconductedthefollowinganalysis(Figure4).
To ensure the mathematical accuracy of our Machine Learningmodel,weconductedanextensiveanalysis,which proved to be essential in validating the model's mathematical correctness. The obtained results aligned seamlessly with the predicted outputs of the model, confirmingitsrobustnessandreliability.Byvalidatingthe model in this manner, we can have a greater level of confidence in its performance and accuracy, making it a powerfultoolformakingdata-drivendecisions.
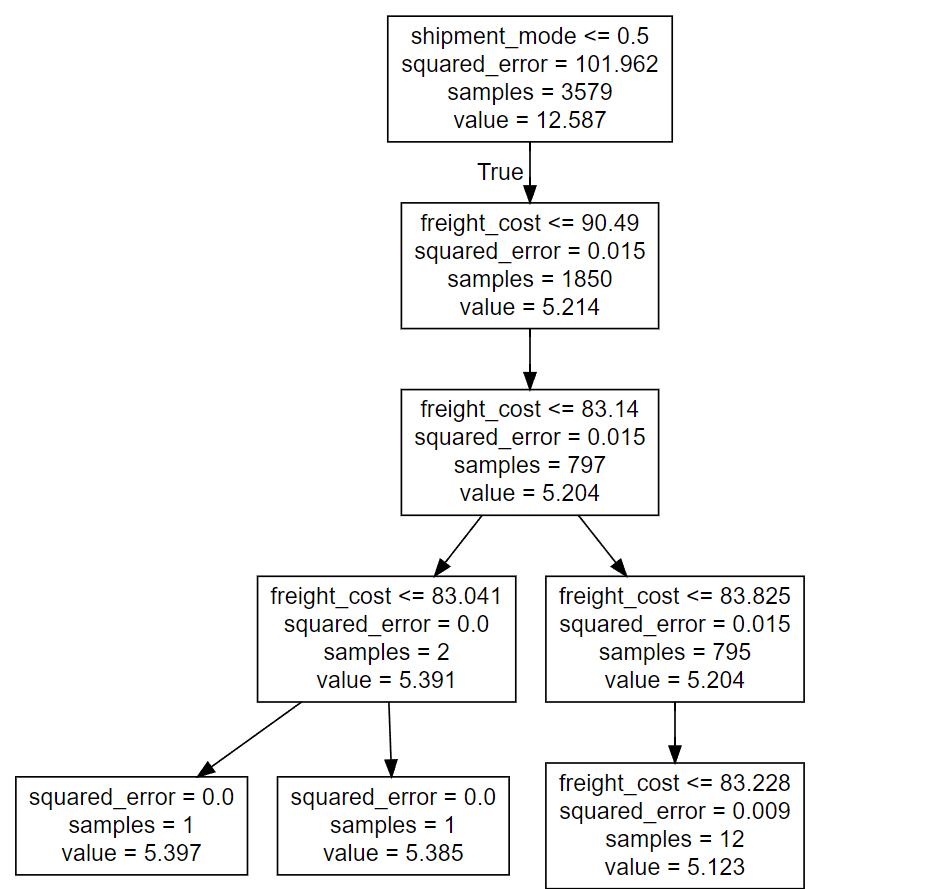
Moving on to our subsequent model, the decision tree regressormodel,weutilizedthesci-kitlearndecisiontree regressormodeltoimplementitonourdata.Todetermine therootnodes,weemployedthe'squarederror'metricto splittheleafnodes,whichledtothefinaldecisionnode.We presentaclearandconcisegraphicalrepresentationofthe decisiontreeregressormodelbelow(Figure5),providinga betterunderstandingofitsfunctioningandoutcomes.
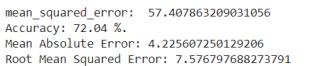
Inordertoevaluatetheeffectivenessofournewlycreated machine-learning model, we employed a variety of assessmentmeasures,suchasaccuracy,meansquarederror, androotmeansquarederror.
TheresultsobtainedfortheLinearRegressionmodelareas follows(Table4,Figure5):
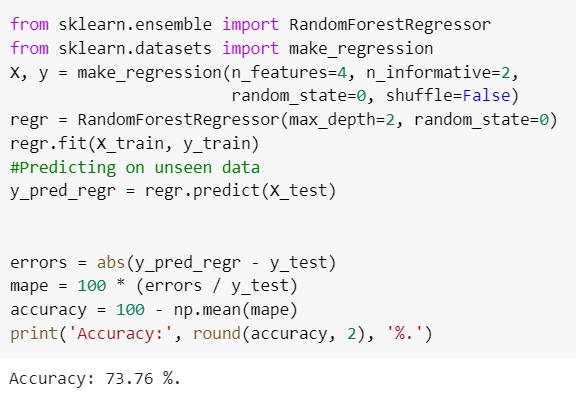
Theresultsobtainedfromtherandomforestregressorwere asfollows(Figure6).
FUTURE SCOPE
[1] Exploring the possibility of enhancing the model's accuracybyincorporatingweatherpatterns,provided reliabledatacouldbeobtained.
[2] Consideringconvertingandcategorizingthetimestamp data basedonloading quartersthroughoutthedayto increaseaccuracy.
[3] Inaddition, developinga user interfacefordata input andlivepredictionofaccuracybasedontheavailable data.
Thiswouldallowuserstoobtainimmediatepredictions andfeedbackontheaccuracyoftheirinputdata
6. CONCLUSIONS:
[1] Following an in-depth analysis of multiple ML techniques, we carefully selected and shortlisted algorithmsbasedontheirrelevancetoourspecificusecase. Our objective was to achieve optimal results for ourproblemstatement.
[2] After a thorough evaluation, we developed two algorithms - Linear Regression and Random Forest Regressor-astheyarehighlyeffectiveforaddressing regression problems. Through extensive experimentation, we achieved a significant level of accuracy for both models, with Linear Regression
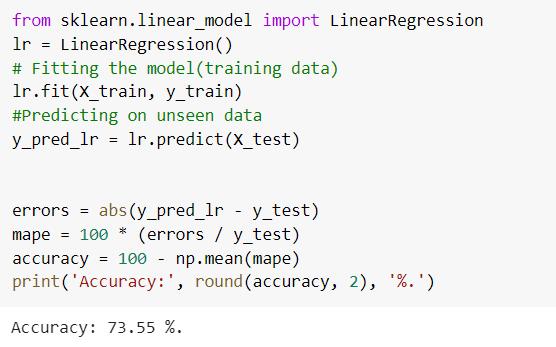
achieving an accuracy of 73.55%, and Random Forest Regressorachievinganaccuracyof73.76%.
[3] Thus, our developed machine learning model enables accurate prediction of shipping time, providing a valuabletoolforstakeholdersseekingtooptimizetheir supplychainoperations.
REFERENCES
[1] Boosting Algorithms for Delivery Time Prediction in TransportationLogistics-JihedKhiar,CristinaOlaverriMonreal
[2] Hands-On Machine Learning with Scikit-Learn and TensorFlow-AurélienGéron.
[3] https://medium.com/walmartglobaltech/customerdelivery-time-cdt-prediction-using-machine-learningaae9c33cc07e
[4] Predicting Shipping Time with Machine LearningAntoineJonquais,FlorianKrempl
[5] https://braintoy.ai/2021/06/15/shipping-time/hed.
BIOGRAPHIES
[1] Aditya Mahesh Deshpande Dept.ofMechanicalEngineering, K.J.SomaiyaCollegeofEngineering,Mumbai B.A.R.CIntern(2023),CSWP,CSWPA.
[2] Harsh Mahendra Gaglani Dept.ofMechanicalEngineering, K.J.SomaiyaCollegeofEngineering,Mumbai B.A.R.CIntern(2023),CSWP,CSWPA.