Breast Cancer Prediction using Machine Learning
 Himon Sarkar1 , Riddhiman Ghose2
1Student, Department of Computer Science and Engineering, Heritage Institute of Technology ,West Bengal, India. 2Student, Department of Computer Science and Engineering, University of Calcutta, West Bengal, India. ***
Abstract - Breast cancer is a significant public health issue,affecting millionsofwomenworldwide.Worldwide, femalebreastcancerhasnowsurpassedlungcancerasthe mostcommonlydiagnosedcancer.Anestimated2,261,419 new cases of breast cancer were diagnosed in women across the world in 2020.. Breast cancer tumors can be classified as either benign or malignant. Fibroadenomas aresolid, smooth, firm, noncancerous (benign) lumps and theydonotspreadtootherpartsofbody.Theymaycause discomfort or pain, but they are not life-threatening. On the other hand, ductal carcinoma in situ, invasive ductal carcinoma,inflammatorybreastcancer,andmetastaticare malignant tumours, which are cancerous growths that have the potential to leave the breast tissue and invade other bodily organs. The distinction between benign and malignant breast tumors is important because it helps determine the appropriate course of treatment. Here Machine Learning (ML) comes to tremendous help as it canaccuratelypredictthetypeoftumorbyanalysinglarge amounts of data and intricately complex patterns. In this paper, we have identified this problem as a Binary Classification problem and have implemented four different classification techniques, namely logistic regression, support vector machines, random forests, and neural network, to predict breast cancer basedon patient dataandimagingresults.Thealgorithms'accuracyresults were carefully studied and it was found that Logistic Regression gave the highest accuracy rate, reaching up-to 98.24%.
Key Words: Machine Learning, Breast Cancer, Binary Classification, Logistic Regression, Random Forest Classifier, Support Vector Machines, Artificial Neural Network, Cancer Dataset, Malignant & Benign Tumors
1. INTRODUCTION
The accurate diagnosis of some crucial information is a major problem in the area of bioinformatics or medical science. In the field of medicine, illness diagnosis is a challengingandlabor-intensivetask.Numerousdiagnostic facilities, hospitals, and research facilities, as well as a number of websites, all have access to a vast quantity of medical diagnosis data. It is hardly ever essential to classify them in order to automate and speed up disease diagnosis. The medical planning officer's knowledge and expertise in the medical area are typically the foundation
for the disease diagnosis. This leads to situations where errors and unintended biases occur, and it takes a long timetoaccuratelydiagnoseanillness.
Breast cancer is a disease that occurs most frequently. Over three million women are thought to be impacted yearly.Five-yearsurvivalforbreastcanceramongwomen diagnosed between 2015 and 2020 varies greatly with variationsinlocation.Inmostplaces,itiswidelyknownto be greater than fifty percent. Although there is no known way toprevent breast cancer, odds ofsurvival aregreatly increasedbyearlydetectionanddiagnosis.
Early in the course of the illness, the symptoms are not well-presented, which delays identification. The National Breast Cancer Fund (NBCF) advises that women over the age of forty should get a mammogram once a year. An Xrayofthebreastiswhatamammographyis.Itisamedical technique used to find breast cancer in female patients without causing any negative side effects, making the process safe. Women who undergo mammograms have a higherchanceofsurvivalthanwomenwhodonot.
Forcharacteristictumors,automationoftheidentification method is therefore essential. Many people have already attempted using machine learning techniques to identify cancers in their family members, and researchers have also verified that these algorithms are more effective at doing so. The application of machine learning algorithms onbreastcancerinwomenissummarisedinthisarticle.A malignant tumour is one that develops and spreads throughout the body. Therefore it's necessary to comprehend priorly. Thickening or having a lump on breast is considered of as symptoms of carcinoma. The main goal of the paper is to categorise and determine whetherornotanindividualhasmalignanttumors.
2. PRIOR WORKS
[1] This paper is a comprehensive review of the different machine learning algorithms used for breast cancer prediction. The authors compare the performance of different algorithms, including SVM, artificial neural networks,decisiontrees,andlogisticregression.Theyalso discuss the challenges and limitations of these algorithms andsuggestfutureresearchdirections.Theauthorsfound that SVM achieved the highest accuracy in most studies, followed by artificial neural networks and decision trees.
They also noted that the choice of features and data preprocessing techniqueshaveasignificantimpactonthe performance of these algorithms. The review concludes with a summary of the key findings, highlighting the potentialofmachinelearningalgorithmsinimprovingthe accuracy of breast cancer diagnosis. The authors emphasise the need for further research to address the challengesassociatedwithusingmachinelearning.
[2] In this study, a breast cancer detection method based on convolutional neural networks (CNN) is proposed. To teach their CNN algorithm, the authors used a dataset of mammogram images. They came to the conclusion that CNN-based models can be a helpful instrument for diagnosing breast cancer after achieving an accuracy of 96.38%intheirexperiments.Thispaper'suseofasizable collection of mammogram images to train the CNN model is one of its strong points. The performance of the CNN model outperformed other ML algorithms, such as SVM and logistic regression, according to the writers' comparisons. The dataset's possible biases and the CNN model'spoorinterpretabilityarejusttwoexamples ofthe study's limitations that the authors failed to address. The results also show that the proposed CNN-based model outperforms other approaches, achieving an accuracy of 97.18%, sensitivity of 97.47%, and specificity of 96.60%. Theauthorsalsoprovideadetailedanalysisofthemodel's performance, highlighting its ability to correctly identify cancerouslesions.
[3] The authors of this study compared various feature selection and classification approaches for machine learning-based breast cancer prediction. They evaluated the effectiveness of various feature selection techniques, such as principal component analysis and mutual information,andvariousclassificationalgorithms,such as SVM and decision trees, using a dataset of mammogram imagesandpatientdata.Intheirexperiments,theauthors discovered that the SVM algorithm with mutual information feature selection had the best accuracy. They also talked about how crucial feature choice is to enhancingtheaccuracyofmachinelearningalgorithmsfor predictingbreastcancer.Theauthorssuggestthattheuse of machine learning algorithms, particularly the combination of PCA and support vector machines, can improve the accuracy and efficiency of breast cancer prediction, leading to earlier detection and improved outcomesforpatients.
3. DATASET ACQUISITION

In this paper, we have used the University of Wisconsin Hospitals Madison Breast Cancer Database's dataset for our research. A digitised image of a breast cancer sample acquired through fine-needle aspiration is used to calculate the features of the dataset (FNA). These traits
allow us to infer the characteristics of the cell nuclei visible in the image. Breast Cancer Wisconsin Diagnostic has 569instances (Benign: 357Malignant: 212),2classes (62.74% benign and 37.26% malignant), and 11 integervalued characteristics (-Id -Diagnosis -Radius - TextureArea -Perimeter -Smoothness -Compactness -ConcavityConcavepoints-Symmetry-Fractaldimension).
A brief description of the above features of the dataset isgivenbelow:
FEATURES
Radius
Texture
Perimeter
Area
Smoothness
Compactness
Concavity
Concavepoints
Symmetry
Fractaldimension
DESCRIPTION
It is the mean of distances from the centre to the points on the circumference
The standard deviation of the grey-scalevalues
CircumferenceofTumour
AreaoftheTumour
Itisthelocaldeviationinradius
Defined as [(perimeter^2)/area -1]
The gravity of concave portions onthesilhouette
Number of concave portions on thesilhouette
A balanced and proportionate similarity that is found in two halvesofanobject
It is a characteristic parameter used to describe the irregular extentofcoastline
Table -1: Briefdescriptionaboutdatafeatures
4.1 EXPLORATORY DATA ANALYSIS
For our dataset, it was found that the data was relatively consistent and there were no null values in each feature column. Initially 'M' and 'B' labels were used to specify malignant and benign tumors. We have subsequently changedthelabelsto1and0forbetterrepresentation.
We havealsocomputed the mean value of the feature list for the malignant and benign tumors. The mean of few featuresaregivenbelow:
4.2 DATA VISUALISATION
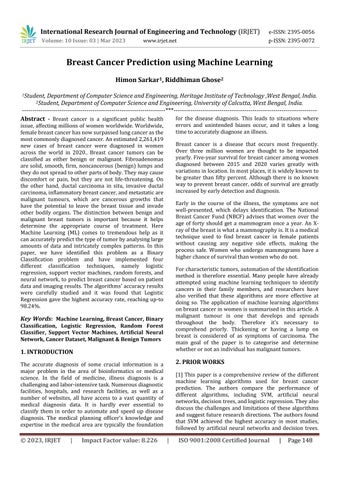
Each attribute's distribution plot can have a substantial impact on how accurately the generated function works. The characteristics need to be normally distributed (Gaussian Curve or Bell Curve). The Gaussian Curve distribution plot has also helped us to identify the skewnessofthedata.Thetwomaintypesofskewnessare Positive Skewed and Negative Skewed. In positively skewed,themeanofthedataisgreaterthanthemedian(a large number of data-pushed on the right-hand side). In other words, the results are bent towards the lower side. The mean will be more than the median as the median is themiddlevalueandmodeisalwaysthehighestvalue. In negatively skewed, the mean of the data is less than the median (a large number of data-pushed on the left-hand side). Negatively Skewed Distribution is a type of distribution where the mean, median, and mode of the distributionarenegativeratherthanpositiveorzero.
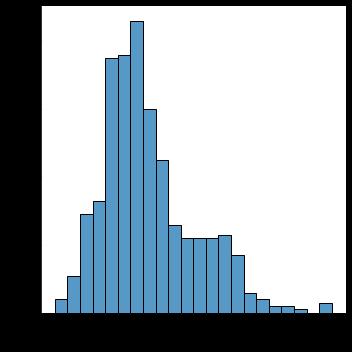
Inthefollowingfigures, the distributionplots fora few of thecharacteristicsaredisplayed.
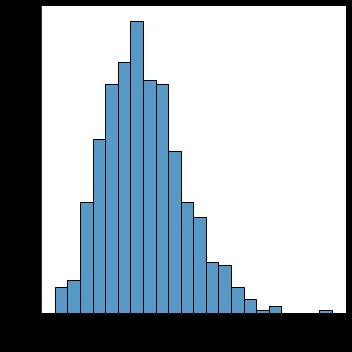
The scatter plot between the different features of the dataset has helped us to find the correlation between them. Since the scatter plot among all the features will have taken drastic time, we have show it for only first 2 features,i.ebetweenradius_meanandtexture_mean.
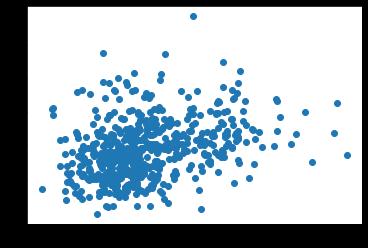
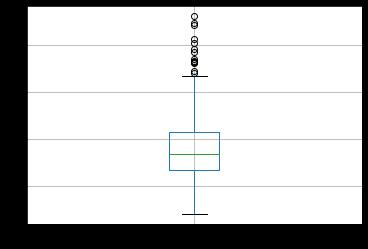
We have also used box plot for visualising the outliers in the dataset. Box outliers are important because they provideinformationaboutthedistributionofthedata. An outlier is a data point that is significantly different from otherdata points inthe dataset. Outliers canoccur due to measurement errors, data entry errors, or because the data truly represents an extreme value or an unusual event.Boxoutliersaretypicallyidentifiedusingthe"1.5 x IQRrule", whereIQRstands for"interquartile range".The interquartile range is the distance between the first and third quartiles of the data, which defines the middle 50% of the distribution. The 1.5 x IQR rule identifies any data points that fall outside of the range of 1.5 times the IQR below the first quartile or above the third quartile. Box outliers indicate the presence of unusual or unexpected data points that may warrant further investigation. In some cases, outliers can be indicative of errors or measurementissuesthatneedtobeaddressed.Boxplotof radius_meanisgivenbelow:
5. METHODOLOGY
Herewehavesummarisedthestepsthatwehavefollowed in the form of a flow chart for better visualisation and understanding.
6 MACHINE LEARNING ALGORITHMS
The three classes of ML algorithms that we can generally divide into are Supervised Learning, Unsupervised Learning, and Reinforcement Learning. In this article, supervised learning algorithms are the main topic. In the instance of supervised learning, labelled input data are given to thealgorithm, and itthen maps the input data to well-known input-output pairs. A brief description of the algorithmsthathavebeenusedherearegivenbelow:
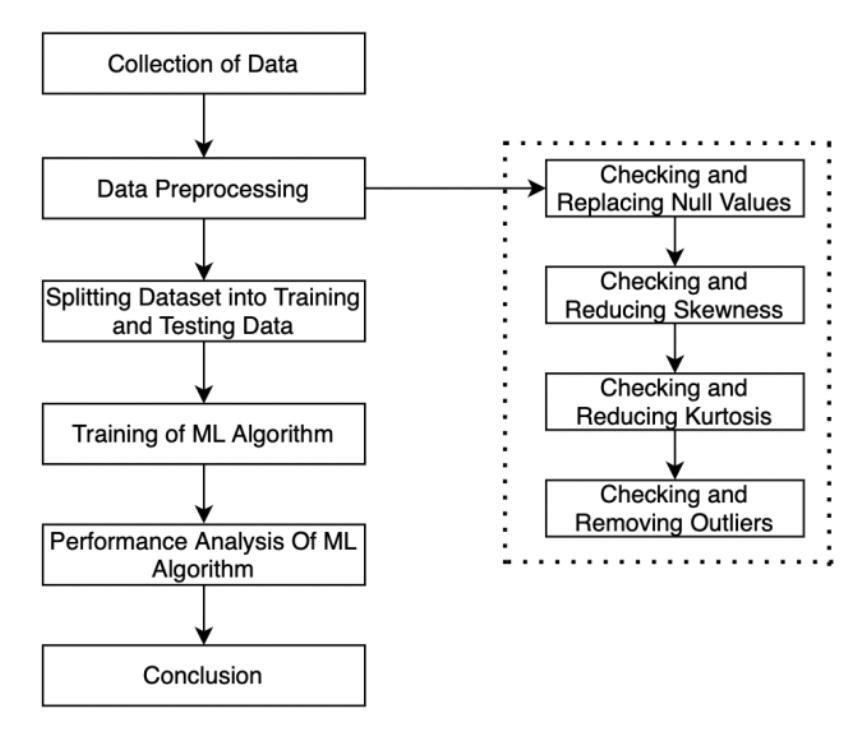
Figure 2:OutliersdetectionindatasetusingBoxPlot
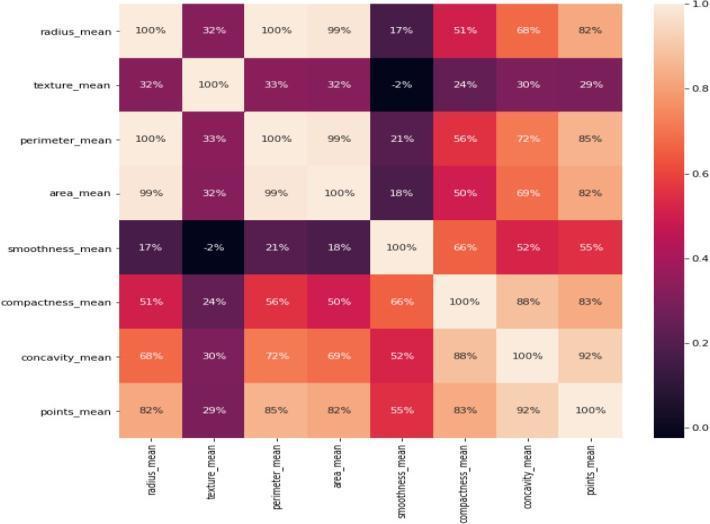
The figure 3 shown below shows the heat map of the correlationbetweenthefeaturegroupsinthedataset.The rowoftheheatmapisrepresentedbythevalueofthefirst component, and the column by the value of the second. The two discrete variables are now connected in a twodimensionalcorrelationmatrix.
• Logistic Regression (LR) : It is a statistical method used for analysing data in which the dependent variable is categorical. It is a type of generalised linear model that estimatestheprobabilityofaneventoccurringbasedon one or more independent variables. The output of logistic regression is a probability value that falls between 0 and 1, representing the likelihood of the eventoccurring.
• Random Forest Classifier (RFC) :- It is a machine learning algorithm that belongs to the family of ensemble methods. It is used for classification problems, where the target variable is a categorical variable with two or more classes. The algorithm combines multiple decision trees to make predictions and is particularly useful when dealing with high-dimensional datasets with complex relationships between the input features and the target variable. In random forest classifier, multiple decision trees are constructed using bootstrapped samples of the original data. Each decision tree is built by recursively partitioning the data into smaller subsets based on the values of the input features.Ateachnodeofthedecisiontree,thealgorithm
selects the input feature that provides the best split, according to some criterion such as the reduction in the Gini impurity or entropy. The process is repeated until a stopping criterion is met, such as reaching a maximum depth or having a minimum number of samples in a leaf node.
• Support Vector Machine (SVM) :- Support vector machines (SVMs) are a machine learning algorithm that can be used for classification and regression problems. SVMs are particularly useful when dealing with highdimensional datasets, where the number of input features is much larger than the number of samples. SVMs work by finding the optimal hyperplane that separates the different classes in the data.In binary classification problems, the hyperplane that separates the two classes is the one that maximises the margin, which is the distance between the hyperplane and the closestdatapointsofeachclass.Thedatapointsthatare closesttothehyperplanearecalledsupportvectors,and they determine the position and orientation of the hyperplane. SVMs can also handle non-linearly separable data by mapping the input features into a higher-dimensional space, where the classes can be separatedbyahyperplane.
• ArtificialNeuralNetwork(ANN):-Neuralnetworks,also knownasartificialneuralnetworks(ANNs),areafamily ofmachinelearningalgorithmsinspiredbythestructure and function of the human brain. Neural networks can be used for a wide range of tasks, such as classification, regression, clustering, and pattern recognition.A neural network consists of multiple layers of interconnected nodes, called neurons, which receive input signals and produce output signals. The input signals are processed by the neurons in the first layer, which pass their outputstotheneuronsinthenextlayer,andsoon,until the output layer produces the final prediction or classification. Each neuron in the network has a set of weights, which determine the strength and direction of the connections between the neurons. During training, the weights are adjusted to minimise the difference betweenthepredictedoutputsandthetrueoutputs.
7. RESULTS
The entire dataset is split into a training set and a testing set before the machine learning methods have been applied. 85% of the dataset, or roughly 483 samples of data, is provided for machine learning training and the remaining15%,orroughly86samplesofdata,isprovided for testing, which is then used to predict the result. The effectiveness of machine learning methods are assessed andcompared.
Thus it was concluded that Logistic Regression algorithm gave the highest test data accuracy of 98.24% among the otherfouralgorithmswhichwereimplemented.
8. CONCLUSION
Inconclusion, theuse ofmachinelearning methods inthe early detection and prognosis of breast cancer has shown great promise. The studies examined here show that machine learning algorithms are capable of efficiently analysingvastamountsofpatientdataandmakingprecise predictions about the probability of developing breast cancer.Therearestillissuesthatneedtoberesolved,such as ensuring the quantity and quality of the data used to train these models, addressing data bias, and putting in place efficient clinical processes that take machine learning predictions into account. Overall, the study provided in this paper emphasises the need for further investigation and refinement of these techniques to increase their efficiency in clinical practise while highlighting the potential of machine learning in breast cancer prediction. These studies' findings imply that machine learning models can be practical aids in clinical decision-making, assisting medical workers in making defensible choices regarding patient care and treatment. By using these models, breast cancer may be discovered early, improving patient outcomes and potentially saving lives.
REFERENCES
[1] R. B. Mane and V. S. Prabhu, "Breast cancer diagnosis using machine learning algorithms: A review," International Journal of Intelligent Systems and Applications,vol.13,no.2,pp.61-68,2021.
[2] Anjali Sharma, Satish Kumar, and Rakesh Kumar, "Breast cancer diagnosis using convolutional neural networks," Journal of Ambient Intelligence and Humanized Computing, vol. 11, no. 3, pp. 1431-1440, 2020.
[3] Wen-Hung Liao and Yi-Chun Chen, "Breast cancer prediction using machine learning algorithms: a comparison of feature selection and classification
methods", International Journal of Medical Informatics, 2018,114,7-17)
[4]AhmedFE,AhmedNC,VosPW,BonnerupC,AtkinsJN, Casey M. Artificial neural network modeling of breast cancerrecurrence.Expertsystemswithapplications.2007 Mar1;32(2):610-23.
[5] Al-masni MA, Saleh AI, Al-antari MA, Hussain M, Alghamdi WS. Computer-aided diagnosis of breast cancer using deep learning algorithms Journal of healthcare engineering.2018;2018.
[6] Amoah S, Sefa-Dedeh S. Breast cancer detection using support vector machines. World Academy of Science, EngineeringandTechnology.2009Sep;34:453-8.
[7] Asri H, Mousannif H, Al Moatassime H, Noel T. Using machine learning algorithms for breast cancer risk prediction and diagnosis. Procedia Computer Science. 2016Jan1;83:1064-9
[8] Chae EY, Kim HH, Cha JH, Kim HJ, Shin HJ, Kim HS. Radiomics features on mammography for the assessment ofbreastcancer.Scientificreports.2020Mar4;10(1):1-0
[9] El-Said M, Ahmed SA, Ahmed FE. Artificial neural network modeling of breast cancer data: an overview. Appliedsoftcomputing.2017Aug1;57:584-96.
[10] Esteva A, Kuprel B, Novoa RA,Ko J, Swetter SM,Blau HM, Thrun S. Dermatologist-level classification of skin cancer with deep neural networks. Nature. 2017 Jan;542(7639):115-8.
[11] Jafari MH, Sadeghi M, Mashohor SB, Mahmud HR, Saripan MI, Abdul Nasir NA. Computer-aided detection/diagnosis of breast cancer in mammography and ultrasound: a review. Clinical Imaging. 2016 May 1;40(3):279-92.
[12] Jafari-KoshkiT,Arsang-Jang S,MahjubH.Application ofartificialneuralnetworkforpredictionofbreastcancer survival: a retrospective study in Iranian population. Journalofresearchinhealthsciences.2014;14(4):275-9.
[13]WangX,PengY,LuL,LuH,LuZ,BagheriM,Summers RM. ChestX-ray8: Hospital-scale chest X-ray database and benchmarks on weakly-supervised classification and localizationofcommonthorax diseases. InProceedings of the IEEE conference on computer vision and pattern recognition2017Jul21(pp.2097-2106).
[14] LiX,PlatelB,ChenH,LiH,ZhouY,ChenZ,CaiW,Liu M. Breast cancer detection using deep convolutional neural networks and support vector machines. Neural ComputingandApplications.2018May1;29(5):1493-503.
[15] D. Tanouz, R. R. Subramanian, D. Eswar, G. V. P. Reddy, A. R. Kumar and C. V. N. M. Praneeth, "Credit Card Fraud Detection Using Machine Learning," 2021 5th International Conference on Intelligent Computing and ControlSystems(ICICCS),2021,pp.967-972.
© 2023, IRJET | Impact Factor value: 8.226 |
[16] https://www.cancer.net/cancer-types/breastcancer/statistics