Municipal Solid Waste Management; Air Pollution and its’ Impact
1Environmental Specialist, Azis Labs, Indore
2Assitant Project Engineer, MECON, India
3Technical Consultant, National River Conservation Directorate, New Delhi

4Line Incharge, Rajratan Global Wires Limited, Indore
5Director, National River Conservation Directorate, New Delhi ***
Abstract – The emission of pollutants during processing of solid waste is of great concern due to its hazardous effects. An assessment of air quality of the solid waste management sites were made and transfer stations duringFebruarytoJune2021 and October to December 2021. Parameters such as particulate matter (PM2.5), particulate matter (PM10) were measured along with other parameters. An assessment of air quality showed their levels of their mean value ranged between 50.7 and 89.6 µg/m3 at sources and 69.54 and 95.79 µg/m3 at downwind. GHG showed lower levels than the proposed limit value, which could not cause any health issues, while PM2.5 was 4-7 times higher than the standards established. Higher pollutant concentration was recorded in the month of February to June than the month of October to December. Thus, it is estimated that the ambient air of the sites is not safe for people living there. Hence, it is necessary to use safe practices for MSWM and its emission control.
Key Words: PM2.5, PM10, SWM, CPHEEO, Bio methanation, Incineration,GHG
1.1 NTRODUCTION
Solid Waste Management is one of the most essential servicesformaintainingthequalityoflifeintheurbanareas andforensuring betterstandardsofhealthandsanitation [1].InIndia,thisservicefallsshortofthedesiredlevel,asthe systemsadoptedareoutdatedandinefficient.Institutional weakness, shortage of human and financial resources, improperchoiceoftechnology,inadequatecoverageandlack of short and long term planning are responsible for the inadequacyofservice[2]
Itisamajorchallengeincitieswithhighpopulationdensity inIndiaasthepercapitagenerationofMuncipalsolidwaste hasalsoincreasedtremendously[3].Asmorelandisneeded fortheultimatedisposalofthesesolidwastes,issuesrelated to disposal have become highly challenging. The waste ManagementandHandlingRulesinIndiawereintroduced bytheMinistryofEnvironmentandForests[4,5,6].
Illmanagementofsolidwasteleadstoproblemsthatimpair human and animal health. Impact of waste depends on compositionofwasteandpracticesinvolvingillegaldisposal.
Solidwastecreatesseveralnoxiousgasessuchassuspended Sulphur Dioxide (SO2), oxides of Nitrogen (NOX), Carbon Monoxide (CO), Respirable Suspended Particulate Matter (RSPM)andSuspendedParticulateMatter(SPM).Pollution duetowastedumpingaffectshealththroughbothshortand long-term effects. Examples of short-term and long-term include asthma and respiratory infection, respiratory chronic respiratory and cardiovascular diseases, cancer respectively. According to international solid waste association (ISWA), 2.6 million tons per day of municipal solidwasteisproducedglobally,andtheamountmayreach upto4.5milliontonsperdayby2050[7,8,9,10]
The management of solid waste is in association with the controlofitsproduction,collectionandstorageandfinallyis transferredtodisposalsitesbyfollowingthebestprinciples ofhealth,finances,aestheticsandecologicalaspects[11,12]
2. MATERIALS AND METHODS
2.1 Description of study area
Kirandul is a city and a municipality in the Dantewada districtintheStateChhattisgarh,India.Itisatwintownship consistingofKirandulandBadeBacheliofBailadilaregion. Bailadilameans"humpoftheox",andthemountainrange herehaspeaksthatlooklikethehumpsofanox.
Present average generation of waste in the study area is about320g/capita/dayaspertheactualsurvey.Thecity KirandulhasthedeficienciesinmanagingMSWinvarying degreesandthereisaneedtosetupanewsolidwaste management technique to improve the present SWM practices prevailing in the city to raise the standards of health, sanitation and urban environment. Government of India has launched a “Swachh Bharat Abhiyan (SBA)” or “CleanIndiaMission”covering4041statutorytownstoclean thestreets,roadsandinfrastructureofthecountry
PopulationprojectionofBailadilaregion,Chhattisgarhis showninTable-1
2.2
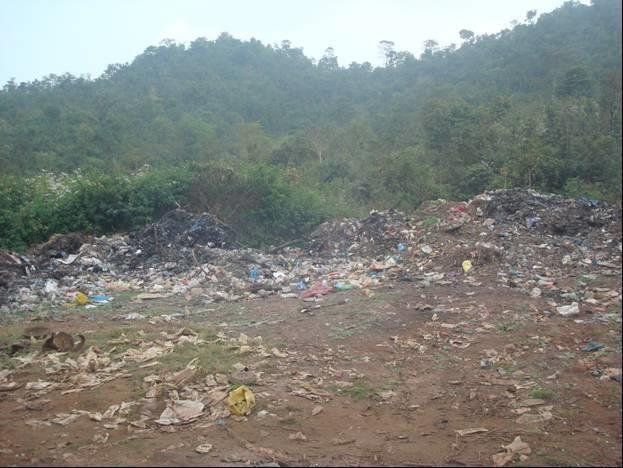
The region does not have any door to door collection and sourcesegregationsystematpresent.Wastesaretransferred by individual households into community bins without segregation. The mixed waste (wet and dry) from the communitybinsisemptiedandloadedintotransportation vehicles(tractors)
- WastegenerationforBailadilaareaforyear2021is takenas0.320kg/capita/day
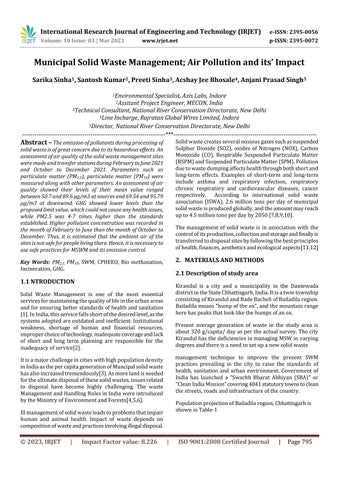
Presently,wasteprocessingisnotcarriedoutBailadilaarea. Entiremixedwasteiscollectedfromindividualhouseholds orfromthesecondarycollectionpointsandtransportedto thelow-lyingareafordumping.
There are no environmentally suitable and demarcated dumping yards in the city, but most of the municipal solid waste is dumped at Old MV Siding area and near Railway ColonyatBailadilaregionthatisconsideredastheonlydump yard
Waste Generation Projection- The waste generation estimateiscarriedoutonthefollowingassumptions:
- Incrementinwastegenerationrateis0%perannum
- Floatingpopulationisconsideredas0%
- issameasthatof2021asthepopulationisdecreasing
Totalprojectedpopulationis18,887fortheyear2041(Same asthatof2011)asthepopulationisdecreasing.
Waste Composition:
The quantity as well as its composition (biodegradable, recyclablesetc.)arerequiredtoarriveatpropertechnology (ies)forwasteprocessing,viz.Compositing,Biomethanation (BM),WastetoEnergy(WtE),Landfilling,Recyclingetc.The waste composition estimate has been calculated based on field studies, laboratory experiments and as per CPHEEO guidelines.
Solid Waste Qualitative and Quantitative Assessment
Thequalitativeandquantitativeassessmentforsolidwaste wascarriedoutforBailadilaareainFebruary- June2021 Details ofthe samplingandanalysisaregiven in following sections.
Waste Sample Collection and Analysis
Thequantitativeandqualitativeassessmentofwasteinthe city, especially its physical and chemical properties are essentialfordeterminingthefuturetechnologicaloptionsfor itstreatmentanddisposal.Thefindingsfromthisstudywill feedintotheprocessandfacilitatetakingfuturedecisions, especiallyintermsofselectionofthetechnology.
As a methodology, in the absence of any existing informationonMSWofBailadilaregion,profilinghasbeen taken up to understand the solid waste characteristics, collectionsystem,treatmentprocesses,disposalmethodsand othermanagementissues.Total35solidwastesampleseach in February- June 2021 were collected from different locations like commercial area, markets, residential area, collectionbins,andexistingdumpingsites.
4. RESULT AND DISCUSSION
4.1 Results of the Field Survey and the Laboratory Studies on the Solid Waste Samples Collected During Field Survey
Quantity of Waste Generation
The quantification of waste generation was done based on actualhouseholdsurveyduringthefieldvisitinJune2021by IIT(ISM)representatives,CensusRecordsandAveragewaste GenerationratesasperManualonSolidWasteManagement by Central Public Health & Environment Engineering Organization (CPHEEO), Ministry of Urban Development, Govt. of India and the data collected on the total wastes collectedbycollectionvehiclesduringthefieldvisit.
Waste Characterization
ThecollectedsamplesofMunicipalSolidWastes(MSW)were broadlycategorizedintofollowingfourcategories:(i) biodegradable waste that include food and kitchen waste, greenwaste(vegetables,flowers,leaves,fruits),papers(that canberecycled);(ii)recyclablematerialsthatincludepapers, glass, bottles, cans, metals, certain plastics, etc.; (iii) inert wastesthatincludeconstructionanddemolitionwaste,dirt, rocks, debris etc. and (iv) non- biodegradable waste. The detailanalysis(usingstandardmethods)ofthecollectedsolid wastesamplesarepresentedinTable4(weightandtypeof wastes present in each sample) and Table 5 (presence of biodegradable and non-biodegradable waste materials in percentage).
Moisture Content
Themoisturecontentofsolidwastesusuallyisexpressed asbelow:
Where,
M-moisturecontent,wetbasis(%)
w–initial(wet)weightofsample
d–final(dry)weightofsample
Theresultsofthemoisturecontentanalysisforallcollected solidwastesamplesarepresentedinTable6.Themoisture contenttestwasdoneusingstandardmethodandcalculation wasdoneonthebasisoftheaboveequation.
Energy Content and Density of Solid Waste Components
The energy content of solid waste components can be determinedusing(i)afullscaleboilerasacalorimeter(ii)a laboratory bomb calorimeter and (iii) calculation, if the elemental composition is known. Density is defined as the weightofamaterialperunitvolume(kg/m3).Thedensity dataareneededtoassessthetotalmassandvolumeofthe wastethatmustbemanaged.Thedensityandcalorificvalue (energycontent)ofthecollectedsamplesofmunicipalsolid wastearepresentedinTable7.
Solidwastecontainsorganicaswellasinorganicmatters.The latentenergypresentinitsorganicfractioncanberecovered forbeneficialutilizationthroughadoptionofsuitablewaste processing and treatment technologies. The recovery of energyfromwastesoffersafewadditionalbenefitssuchas (i)thetotalquantityofwastegetsreducedbynearly60%to 90%dependinguponthewastecompositionandtheadopted technology,(ii)demandforland,whichisalreadyscarcein cities,forlandfillingisreduced,(iii)thecostoftransportation of waste to far away landfill sites also gets reduced proportionately, and (iv) net reduction in environmental pollution. The important physical parameters for energy recovery that to be considered include size of the constituents,density,andmoisturecontent.Smallersizeof theconstituentsaids in faster decomposition of the waste. The important chemical parameters to be considered for determiningtheenergyrecoverypotentialandthesuitability ofwastetreatmentthroughbio-chemicalorthermo-chemical conversion
technologies include (i) volatile solids, (ii) fixed carbon content, (iii) inertness, (iv) calorific value, (v) C/N ratio (Carbon/Nitrogenratio),and(vi)toxicity.
Proximate Analysis
Proximateanalysisofthesolidwastesamplesincludesthe followingtests:(i)lossofmoisture(lossofmoisturewhen heatedto105℃for1hr),(ii)volatilematter(additionalloss of weight on ignition at 950 ℃ in a covered crucible), (iii) fixedcarbon(combustibleresidueleftaftervolatilematteris removed),and(iv)ash(weightofresidueaftercombustionin anopencrucible).
Theabovetestswerecarriedoutusingstandardmethodsin laboratory(usingOvenandMuffleFurnace)andpresentedin
Table8.
Ultimate Analysis of Solid Waste Components
TheUltimateAnalysisofSolidWasteComponentstypically involvesthedeterminationofthepercentageofC(Carbon),H (Hydrogen),O(Oxygen),N(Nitrogen),S(Sulfur)andash.The resultsoftheultimateanalysisareusedtocharacterizethe chemicalcompositionoftheorganicmatterinMSW.Theyare also used to define the proper mix of waste materials to achieve suitable C/N ratios for biological conversion processes.TheresultsoftheUltimateAnalysiswereobtained usinga State of the Art equipment, CHONS analyser in the
DepartmentofEnvironmentalScienceandEngineering,IIT (ISM) Dhanbad for the collected solid waste samples and presentedinTable9.
Table- 9:Ultimateanalysisofthecollectedmunicipalsolid wastes S.N
Categorization of the solid waste samples based on the laboratorytestresultsTheanalysisresultsofthecollected sampleswereusedtosub-categorizethetotalmunicipalsolid wastesintorecyclablewaste,incinerablewaste,compostable waste,andlandfillingwaste.ResultsarepresentedinTable 10.
Table -10:Wastecategorizationonthebasisofrecyclable, incineration,compostingandlandfilling(FebruarytoJune)
4.2 Results of the Field Survey and the Laboratory Studies on the Solid Waste Samples Collected During Field Survey (October- Januray)
Waste
Thedetailanalysis(usingstandardmethods)ofthecollected solidwastesamplesarepresentedinTable11(weightand typeofwastespresentineachsample),Table12(presenceof biodegradable and non-biodegradable waste materials), Table13(percentagecompositionofbiodegradableandnonbiodegradable wastes), and Table 14 (percentage compositionofeachtypeofsolidwastes).
Table -11:Compositionofthecollectedmunicipalsolid wastesamplesfromthesite
Table -12:Classificationofmunicipalsolidwastessamples basedondegradability
S.N Sample number Biodegradable waste Non-biodegradable waste
Sector A
1 Sample1DtoD √
2 Sample2DtoD √
3 Sample3DtoD √
4 Sample4dustbin√
5 Sample5 dustbin √
Sector B
1 Sample1DtoD √
2 Sample2DtoD √
3 Sample3DtoD √
4 Sample4 Dustbin √
5 Sample5 Dustbin √
Table-13:Percentageofbiodegradableandnonbiodegradablewastesinthecollectedsamples S.N
Table
:Compositionoftotalwastesampleinpercentage
Energy
The density and calorific value (energy content) of the collectedsamplesofmunicipalsolidwastearepresentedin Table16.
Aroughassessmentofthepotentialrecoveryofenergyfrom solid waste through different treatment methods can be madefromtheknowledgeofitscalorificvalueandorganic fractionasperstandardmethodsdiscussedbelow. Table
Table
Proximate Analysis
The proximate analysis was carried out using standard methodsinlaboratory(usingOvenandMuffleFurnace)and presentedinTable17.
Table- 17:Proximateanalysisofthecollectedmunicipal solidwastesamples
Ultimate Analysis of Solid Waste Components
TheresultsoftheUltimateAnalysiswasdoneusingaStateof the Art equipment, CHONS analyser in the Department of EnvironmentalScienceandEngineering,IIT(ISM)Dhanbad forthecollectedsolidwastesamplesandpresentedinTable 18.
Table -18:Ultimateanalysisofthecollectedmunicipal solidwastes
Categorization of the solid waste samples based on the laboratory test results
The analysis results of the collectedsamples were used to sub-categorize the total municipal solid wastes into recyclablewaste,incinerablewaste,compostablewaste,and landfillingwaste.ResultsarepresentedinTable19.
Table -19:Wastecategorizationonthebasisofrecyclable, incineration,compostingandlandfilling(Feb2021)
During the SWM process various pollutants are emitted. Vriousactivitiesduringthesolidwastemanagementarethe mainsourcesofemissionofGHGandothermajorpollutants. During sampling period the measured mean level of particulatematterrangedbetween50.7and89.6µg/m3at sourcesand69.54and95.79µg/m3atdownwind.Moreover, higherlevelsofPMwereobservedinthemonthofFeb-June than the month of October-December. ]. Concentration of PM2.5wasobservedtobedecreased35mawayfromthe source. On comparison it sowed 20% increased PM2.5 concentrationatthesource.IncreaseinlevelofPM2.5raised the concern that inhalation of PM2.5 from SWM sites can cause pulmonary diseases, and other diseases among the workers and populations living within facilities of such MSWM sites. Presence of organic components in the solid waste materials is decomposed by microbes and releases GHG.So,theSWMsitesareconsideredtobemajorsourcesof CO2andCH4emissions.CH4isamajorcomponentofGHG andhas25timesmoreglobalwarmingpotentialthanCO2.
Thusitshowsthatduetovariousmanagementprocessesof solidwasteithasasignificantimpactonairquality.
3. CONCLUSIONS
The household waste includes unused food, peels of vegetable,rottenfood,unusedpapers,plasticbags,plastic material(wrappers,Likho-phekhopens,brokenbucket,tub etc),unusedcottonmaterial,electronicwaste,smoke,dust etc.Rottingfoodandother decaying organicwasteallows methaneandcarbondioxidetoseepoutofthegroundand upintotheair.Methaneisapotentgreenhousegasandcan itself be a danger because it is flammable and potentially explosive. Carbon dioxide is the most widely produced greenhousegas.Ittrapsheatintheatmosphere,contributing to climate change. Poorly run landfills may become nuisancesbecauseofvectorssuchasratsandflieswhichcan causeinfectiousdiseases.Theoccurrenceofsuchvectorscan be mitigated through the use of daily cover. Gases are produced in landfills due to the anaerobic digestion by microbes. Solid wastes are potential problem to human healthfromimproperhandling.Themainproblemtohealth is indirect and arise from the breeding of disease vectors, primarily Flies and Rats. The household waste along with industrialeffluentscreatesspecificdangerofconcentration ofheavymetalsinthefoodchain.Peoplesarecompelledto live in such area. This is not the natural process we are responsibleforit.Wehavetoconcerntheseproblemsand shouldtrytocontrolit.
REFERENCES
[1] Prabhjot Kaur, “Recent advances in utilization of municipalsolidwasteforproductionofbioproducts:A bibliometric analysis” Case Studies in Chemical and Environmental Engineering 4 (2021) 100164, doi.org/10.1016/j.cscee.2021.100164
[2] VandanaBharti,“AReviewonSolidWasteManagement MethodsandPracticesinIndia”TrendsinBiosciences 10(21),2017,4065-4067
[3] LalChandMalav,“Areviewonmunicipalsolidwasteas arenewablesourceforwaste-to-energyprojectinIndia: Currentpractices,challenges,andfutureopportunities”, JournalofCleanerProductionVolume277,20December 2020,123227
[4] Juntakan Taweekun, “A Review Study On Municipal Solid Waste Management And Waste To Energy Technologies”, Journal of Industrial Pollution Control, ISSN(0970-2083)
[5] Poritosh Roy, “Impacts of COVID-19 Outbreak on the MunicipalSolidWasteManagement:Nowandbeyond thePandemic,”ACSEnviron.,1,Au202132 45
[6] Willie Doaemo, “Assessment of municipal solid waste managementsysteminLaeCity,PapuaNewGuineain the context of sustainable development,” Environ Dev Sustain,23(12),202118509–18539.
[7] ShwetaChoudhary,“AResearchPaperonSolidWaste Management,”JETIRMarchVolume6Issue3,2019
[8] Arti Pamnani, “MUNICIPAL SOLID WASTE MANAGEMENTININDIA:AREVIEWANDSOMENEW RESULTS,”Volume5,Issue2,February(2014),pp.0108
[9] WidadFadhullah,“Householdsolidwastemanagement practicesandperceptionsamongresidentsintheEast Coast of Malaysia,” BMC Public Health, 22:1 (2022) https://doi.org/10.1186/s12889-021-12274-7
[10] George J. Kupchik & Gerald J. Franz, “Solid Waste, Air Pollution and Health,” Journal of the Air Pollution Control Association, 26:2, 116-118, DOI: 10.1080/00022470.1976.10470229
[11] Neha Gupta, “A review on current status of municipal solid waste management in India,” Journal of EnvironmentalSciences37,2015,206-217
[12] VhuthuNdou,“BibliometricAnalysisofMunicipalSolid WasteManagementResearch:GlobalandSouthAfrican Trends,” Sustainability,14 2022, 10229. https://doi.org/10.3390/su141610229