SURVEY PAPER ON CROP DISEASE NOTIFICATION SYSTEM

Abstract - Cropsicknessesareaprimary dangertofood security;however,theirfastidentificationremainstoughin lotsofelementsofthesectorbecauseoftheshortageofthe essential infrastructure. The aggregate of growing worldwidesmartphonepenetrationandcurrentadvancesin computer imaginative and prescient made viable with the aid of deep getting to know has paved the way for cellphone-assisted sickness prognosis. The use of a public dataset of 20,306 photos of diseased and healthy plant leaves accumulated underneath controlled situations, we educateadeepconvolutionalneuralnetworktopickout15 crop species and 29 diseases (or absence thereof). The educatedmodelachievesanaccuracyof85.35%onaheldoutcheckset,demonstratingthefeasibilityofthisapproach. Universal,themethodofschoolingdeeplearningmodelson anincreasingnumberofhugeandpubliclytobehadimage datasets gives a clean route in the direction of phoneassisted crop ailment diagnosis on a massive worldwide scale.Notificationsofferacompletelyuniquemechanismfor increasing the effectiveness of actual-time facts transport systems. However, notifications that demand farmers’ attention at inopportune moments are more likely to have destructive effects and may become a motive of capability disruptioninplaceofprovingbeneficialtofarmers.Inorder to address these demanding situations a spread of notification mechanism based on tracking and gaining knowledgeofcropdiseasebehaviorwereproposed.Thegoal
of such mechanism is maximizing farmers receptiveness to the added records by means of routinely inferring the propercropandtheproperfertilizers,forassuringaccurate yieldofcrops.
Key Words: Smartphone, Notifications, Crop Disease, Deep Convolutional Neural Network.
1.INTRODUCTION
Plant illnesses[1] , pest infestation, wind pressure, and nutrient deficiencies are a number of the grand demandingsituationsforanyagriculturalmanufacturer,at any vicinity and for anything Commodities or size of the operationisdealingeveryday.It'sfarcriticalthatfarmers would know the existence of such challenges of their operationsonawell-timedbasis.Nevertheless,itcouldbe prettyhelpfultoagriculturalmanufacturerstohaveaccess towith notroubleto behad Generationto coachthemon
how to cope with each of those threats for Agricultural Production to beautify crop manufacturing and operation profitability.
For example, within the India, plant ailment reasons lossesofbetween50and60percentageoftheagricultural crop manufacturing annually. Consequently, farmers ought to directly diagnose the specific varieties of plant illnesses to stop their spread within their agricultural fields. Traditionally, underserved farmers attempt to diagnose plant diseases through optical commentary of plant leaves signs, which includes a drastically excessive diplomaofcomplexity.Anymisdiagnosisofcropdecreases willcausetheuseofthewrongfertilizersthatcouldstress the plants and result in nutrient deficiencies within the Agriculturalarea.
MachineLearning(ML)coupledwithlaptopvisionhave already enabled sport-changing precision agriculture abilties by means of providing the capability to optimize farm returns, hold herbal resources, lessen unnecessary use of fertilizers, and discover sickness in vegetation and animalsfromremotelysensedimagery.
Consider a clever Mobile-based totally system that farmers can use to perceive the unique forms of plant diseaseswithexcessiveaccuracy[2].Suchstructuresmight assist both small- and huge-scale farmers to make the right choices on which fertilizers to use to confront plant sicknessesintheirplants.
This paper offers a cell-based machine for detecting plant leaf diseases[3] the use of Deep Learning (DL) in realtime. In particular, we developed a distributed gadget that is prepared with components executing on centralized servers at the cloud and locally at the user’s cellular gadgets. We created a dataset that includes more than 20 k pictures for the most common place 38 plant ailment categories in 15 crop species, together with tomato scab, tomato, grape leaf[3] blight, rice[4] and lots of others[5] .
On the cloud side, we created a Convolutional Neural network (CNN) model which can feed pixS without delay from farmers’ mobile devices. The version then performs item detection[6] andsemanticsegmentation,anddisplays the ailment class in conjunction with the self-assurance
percent and class time have taken to process the photo. WeEvolvedanAndroidmobileapptopermitconstrainedassets farmers to seize a image of the diseased plant leaves.ThecellularapprunsonpinnacleoftheCNNmodel on the user side. Also, the application shows the selfassurance percentage and class time taken to technique thepicture.
The contributions of this paper are threefold. First, we advocate a dispensed ML powered Platform that is organized with parts executing on the cell consumer gadgetsattheagriculturaldisciplineandexcessive-overall performance servers hosted inside the cloud. Second, the proposed Machine is capable of taking pictures, processing, and visualizing massive imagery agrarian datasets.Third,weevolvedaperson-pleasantinterfaceon pinnacle of the CNN model to allow Farmers to interact with the disorder detector quite simply on the cellular aspect. Fourth, Mobile notifications are presented in a unifiedfashionbyalmostallmobileoperatingsystems.
In order to ensure real-time awareness of users about the delivered information, mobile operating systems rely on notifications that steer users’ attention towards the delivered information through audio, visual and haptic signals. This is indeed in contrast with the traditional paradigm of pull-basedinformation retrieval and delivery in which the user has to initiate a request for the transmissionofinformation.
2. SYSTEM DESIGN
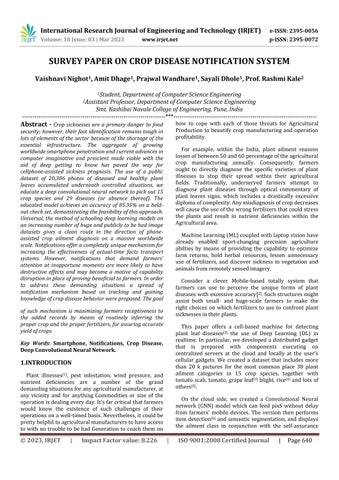
The distributed run-time system for the plant disease detector with Notification is organized with parts executingonmobiledevicesattheuserside,aswellason centralized servers at the cloud side. Module 1 describes the farmer registration at client side, which includes Log In and Sign In Dashboard. Module 2 depicts the crop prediction depending on soil, temperature[7] and rainfall attributes on the preferred location[8]. Module 3 recognizes the disease of the crop which formulates the devicetosendNotificationfortheusers.
2.1 CNN Structure
We trained a CNN model[9] with 2 convolutional layers, oneinputlayerandoneoutputlayer.I=[i1,i2,...,ir ]andO =[o1,o2,...,oh]representtheinputandoutputvectors, respectively, where r represents the number of elements intheinputfeaturesetandhisthenumberofclasses.The main objective of the network is to learn a compressed representation of the dataset. In other words, it tries to approximately learns the identity function F, which is definedas:
FWB(I)≠I (1)
whereWandBarethewholenetworkweightsandbiases vectors.
A log sigmoid function is selected as the activation function f in the hidden and output neurons. The log sigmoid function s isa special caseofthelogistic function inthe t space,whichisdefinedbytheformula:
s
(t) = (2)
The weights of the CNN network create the decision boundaries in the feature space, and the resulting discriminating surfaces can classify complex boundaries. Duringthetrainingprocess,theseweightsareadaptedfor each new training image. In general, feeding the CNN model with more images[10] can recognize the plant diseases more accurately. We used the back-propagation algorithm, which has a linear time computational complexity, fortrainingtheCNNmodel.
The input value Ɵ going into a node i in the network is calculated by the weighted sum of outputs from all nodes connectedtoit,asfollows:
Ɵi =∑( ) (3)
where ɷij is the weight on the connections between neuron j to i; Yj is the output value of neuron j; and µi is a threshold value for neuron i, which represents a baseline inputtoneuron i intheabsenceofanyotherinputs.Ifthe valueof ɷi,j isnegative,itistaggedasinhibitoryvalueand excludedbecauseitdecreasesnetinput.
The training algorithm involves two phases: forward and backward phases. During the forward phase, the network’s weights are kept fixed, and the input data is propagated through the network layer by layer. The forwardphaseisconcludedwhentheerrorsignal
ei computationsconvergeasfollows:
ei =(di -oi) (4)
where di and oi arethedesired(target)andactualoutputs ofithtrainingimage,respectively.
In the backward phase, the error signal ei is propagated through the network in the backward direction. During this phase, error adjustments are applied to the CNN network’sweightsforminimizing ei.
We used the gradient descent first-order iterative optimization algorithm to calculate the change of each neuronweight∆ɷi,j,whichisdefinedasfollows: ( ) ( ) ( ) (5)
where yi(n) is the intermediate output of the previous neuron n, η isthelearningrate,and ε(n)istheerrorsignal intheentireoutput. ε(n)iscalculatedasfollows: ( ) ∑ ( ) (6)
The CNN network has two types of layers: convolution andpooling.Eachlayerhasagroupofspecializedneurons that perform one of these operations. The convolution operationmeansdetectingthevisualfeaturesofobjectsin the input image such as edges, lines, color drops, etc. The pooling process helps the CNN network to avoid learning irrelevant featuresof objectsbyfocusingonlyon learning theessential ones.Thepoolingoperationis appliedtothe output of the convolutional layers to downsampling the generated feature maps by summarizing the features into patches.Twocommonpoolingmethodsareused:
average-pooling and max-pooling. In this paper, we used the max-pooling method, which calculates the maximum value for each patch of the feature map as the dominant feature.
Before moving the trained CNN model to the mobile device, we converted it into an optimized IR model based on the trained network topology, weights, and biases values.WeusedtheIntelOpenVINO[18] toolkittogenerate the IR model, which is the only format that the inference engine on the Android platform accepts and understands. The conversion process involved removing the convolutionandpoolinglayersthatarenotrelevanttothe mobile device’s inference engine. In particular, OpenVINO splits the trained model into two types of files: XML and Binextension.TheXMLfilescontainthenetworktopology, while the BIN files contain the weights and biases binary data.
2.2 SVM
An essential aspect of medical research is the prediction[11] for a health outcome and the scientific identification of important factors. As a result, numerous methods were developed for model selections in recent years. In the era of big data, machine learning has been broadly adopted for data analysis. In particular, the Support Vector Machine (SVM)[12] has an excellent performance in classifications and predictions with the high-dimensional data. In this research, a novel model selection strategy is carried out, named as the Stepwise Support Vector Machine (StepSVM). The new strategy is based on the SVM to conduct a modified stepwise selection, where the tuning parameter could be determinedby10-foldcross-validationthatminimizesthe mean squared error. Two popular methods, the conventional stepwise logistic regression model and the SVM Recursive Feature Elimination (SVM-RFE), were compared to the StepSVM. The Stability and accuracy of the three strategies were evaluated by simulation studies withacomplexhierarchicalstructure.Uptofivevariables were selected to predict the dichotomous cancer remissionofalungcancerpatient.Regardingthestepwise logisticregression,themeanoftheC-statisticwas69.19%. The overall accuracy of the SVM-RFE was estimated at 70.62%. In contrast, the StepSVM provided the highest prediction accuracy of 80.57%. Although the StepSVM is more time consuming, it is more consistent and outperformstheothertwomethods.
Therearetwotypesofmachinelearning,thesupervised machinelearningwithaspecificoutcomevariableandthe unsupervised machine learning that only examines the associations between a set of predictors. Regression and classification are two primary applications for supervised learning, such as the generalized linear model (GLM), the logisticregressionmodel,andtheSupportVectorMachine (SVM).Forunsupervisedlearning,clusteringistheleading interest and the most popular method is the Principal Components Analysis (PCA). The SVM is a machine learningtooldealingwithclassificationproblems.Withan increasing amount of variables collected, the high dimensional data draw more attention in image processing[13] and the SVM is considered a powerful classificationmethod.Changetal.concludedthattheSVM is useful in the imaging diagnosis of breast cancer and its classification ability is nearly equal to a neural network model. In particular, when a non-linear structure exists, the SVM demonstrates its superior ability to find the optimal separating hyperplane by kernel tricks into a higherdimensionalfeaturespace.
Support Vector Machine or SVM is one of the most popularSupervisedLearningalgorithms,whichisusedfor Classification as well as Regression problems. However,
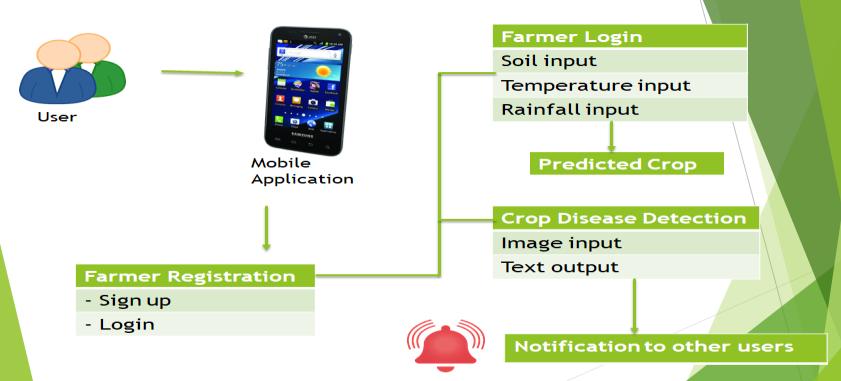
primarily,itisusedforClassificationproblemsinMachine Learning. The goal of the SVM algorithm is to create the best line or decision boundary that can segregate ndimensional space into classes so that we can easily put the new data point in the correct category in the future. This best decision boundary is called a hyperplane. SVM chooses the extreme points/vectors that help in creating thehyperplane.Theseextremecasesarecalledassupport vectors, and hence algorithm is termed as Support Vector Machine. Consider the below diagram in which there are twodifferentcategoriesthatareclassifiedusingadecision boundaryorhyperplane:
TypesofSVM
SVMcanbeoftwotypes:
1]Linear SVM: Linear SVM is used for linearly separable data, which means if a dataset can be classified into two classes by using a single straight line, then such data is termed as linearly separable data, and classifier is used calledasLinearSVMclassifier.
2]Non-linear SVM: Non-Linear SVM is used for nonlinearly separated data, which means if a dataset cannot be classified by using a straight line, then such data is termed as non-linear data and classifier used is called as Non-linearSVMclassifier.
Hyperplane: There can be multiple lines/decision boundaries to segregate the classes in n-dimensional space,butweneedtofindoutthebestdecisionboundary thathelpstoclassifythedatapoints.Thisbestboundaryis known as the hyperplane of SVM. The dimensions of the hyperplanedependonthefeaturespresentinthedataset, which means if there are 2 features (as shown in image), then hyperplane will be a straight line. And if there are 3 features,thenhyperplanewillbea2-dimensionplane.We always create a hyperplane that has a maximum margin, which means the maximum distance between the data points.
Example: SVM can be understood with the example that we have used in the KNN classifier[14] Suppose we see a strange cat that also has some features of dogs, so if we want a model that can accurately identify whether it is a cat or dog, so such a model can be created by using the SVM algorithm. We will first train our model with lots of imagesofcatsanddogssothatitcanlearnaboutdifferent features of cats and dogs, and then we test it with this strange creature. So as support vector creates a decision boundary between these two data (cat and dog) and choose extreme cases (support vectors), it will see the extreme case of cat and dog. On the basis of the support vectors, it will classify it as a cat. SVM algorithm can be used for Face detection, image classification, text categorization,etc.
Although theSVMhasbeenwidelyextendedinavariety of concepts, such as the parameter tuning or kernel choices, this research is focusing on statistical methodologies for stepwise selection models. The backward eliminations implemented by the SVM-RFE consider variables that are top-ranked to be eliminated last are not necessarily the factors that are individually mostrelevant.Inparticular,thesepredictorsarethemost relevant conditional on the specific ranked subset in the model.Inordertoavoidincorrectlyeliminatedfactors,we propose a novel forward algorithm with stepwise considerations based on the SVM. The name of the new strategy is the Stepwise Support Vector Machine (StepSVM).
2.3 Dataset
Although standard object detection datasets (e.g., Microsoft COCO) exhibit volume and variety of examples, they are not suitable for plant disease detection as they annotate a set of object categories not include plant diseases. Therefore, we collected more than labelled 20k imagesofhealthyandinfectedplantleavesfortrainingthe CNNmodelfromdifferentsourcessuchasKaggle[15],Plant Village and Google Web Scraper[16] . Many images in our dataset are in their natural environments because object detectionishighlydependentoncontextualinformation.
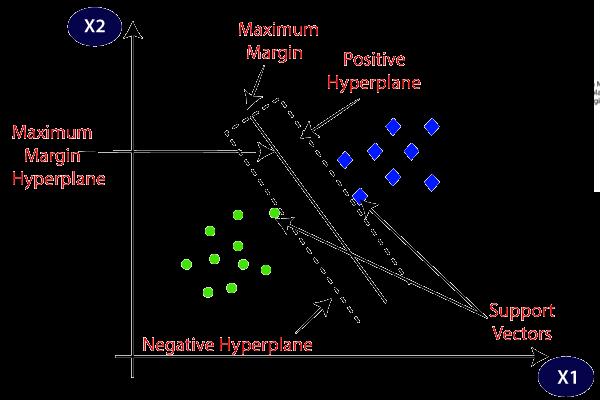
Ourdatasetisdividedintothreeparts:training,validation and testing. Table 1 shows the number of images used in thethreephasesacrossthe38diseaseclassesin14crop
species. The number of images in each phase is determinedbasedonthefine-tunedhyperparametersand structureoftheCNNmodel.
We conducted a set of controlled experiments to estimate the hyperparameters to improve the prediction accuracyandperformance.Inparticular,weprogressively tested
random combinations of hyperparameter values until we achieved satisfactory results. Cross-validation optimizers werealsousedtofindthebestsetofhyperparameters.
To increase the training accuracy and minimize training loss of the CNN model, we applied a series of image preprocessing transformations to the training dataset. Particularly, we altered the contrast of image colors, addedGaussiannoise,andusedimagedesaturation,which makespixelcolorsmoremutedbyaddingmoreblackand white colors. The primary purpose of these transformations is to weaken the influence of the background factor during the training process. This had a better effect on learning the 38 disease classes more effectivelyandincreasedourCNNmodel’sstability.
We had to normalize the range of pixel intensity values of leaf images in the dataset before training the CNN model. This step was necessary because all dimensions of feature
vectorsextractedfrominputimagesshouldbeinthesame intensity range. This made the convergence of our CNN model faster during the training phase. Image normalization was implemented by subtracting the input image’s mean value µ from each pixel’s value I(i, j), and thendividingtheresultbythestandarddeviation σ ofthe input image. The distribution of the output pixel intensity valueswouldresemblea Gaussiancurvecenteredat zero. Weusedthefollowingformulatonormalizeeachimagein ourtrainingset:
3. CONCLUSIONS
where I and O are the input and output images, respectively;and i and j arethecurrent pixelindicestobenormalized.
Faced with growing demands, shrinking of natural resources, and more stringent regulations, the agriculture sector worldwide found refuge in AI through the use of smart and innovative IoT technologies to optimize production and minimize losses. Crop diseases are one of the critical factors behind the crop production losses in the India. Therefore, correct disease diagnosis and awarenessaboutthediseasesisoneofthemostimportant aspects of modern agriculture. Without proper identificationofthedisease,diseasecontrolmeasurescan wastemoneyandleadtofurtherplantlosses.
ThispaperpresentedthedesignofanML-poweredplant disease detector that enables farmers to diagnosis the mostcommon38diseasesin14species.WetrainedaCNN model using an imagery dataset consisting of 96,206 photos of healthy and diseased plant leaves, where crowded backgrounds, low contrast, and diverse illumination
conditionimagesaretakenintoconsideration.Toincrease the system usability, we developed a mobile app[17] that would create a better opportunity for limited-resources farmers to detect plant diseases in their early stages and
eliminate the use of incorrect fertilizers that can hurt the healthofboththeplantsandsoil.
REFERENCES
[1]. K. Jagan Mohan, M. Balasubramanian, S. Palanivel “ DetectionandRecognitionFromPaddyPlantLeafImages”
[2]. Sakshi Kasat , Dhawnit Thadhani , Manali Kolekar, ShreyaGudsurkar,"eshetkari:aninterfaceforfarmers",In International Education and Research Journal,Volume:2,Issue: 3,March 2016.
[3]. Udgave, Monika Kasture, “ Grape Leaf Disease DetectionusingK-meansClustering”, IRJET,2016
[4].DhanashriNemishte,RupaliPatil,SupriyaMore,Sayali Udgave, Monika Kasture " Proposed Decision Support System for Indian Rice crop Yield Prediction", 2016 IEEE International conference for agriculture and rural Development
[5]. Niketa Gandhi, Leisa J. Armstrong, Owaiz Petkar " Proposed Decision Support System for Indian Rice crop Yield Prediction", 2016 IEEE International conference for agriculture and rural Development
[6]. Ms. P.R. Patil, Prof. N.B. Bhawarkar," Crop Diseases Detection with preventive measures Using Image Processing ", In International Journal of Engineering ResearchandApplications(IJERA)ISSN:2248-9622,NCERT – November2015.
[7]. MArya,KAnjali,DUnni Detection of unhealthy plant leavesUsingimageprocessingandgeneticalgorithmwith Arduino. IEEEInternationalConferenceonPower,Signals, ControlandComputation(2018),pp.1-5
[8]. Ahmed, A.A. A privacy-preserving mobile locationbased advertising system for small businesses. Eng. Rep. 2021,1–15.
[9]. SAbed,AEsmaeel A novel approach to classify and detect bean diseases based on image processing. IEEE Symposium on Computer Applications & Industrial Electronics(2018), pp.297-302.
[10]. Ahmed, A.A.; Echi, M. Hawk-eye: An ai-powered threat detector for intelligent surveillance cameras. IEEE Access 2021, 9,63283–63293.
[11]. S. Nagini, Dr. T. V. Rajini Kanth, B. V. Kiranmayee," Agricultural Yield Prediction Using Predictive Analytic Techniques" 2016 2nd International Conference on ContemporaryComputingandInformatics,IEEE,2016
[12]. S.Nema,A.Dixit Wheat Leaf Detection and PreventionUsing SupportVectorMachine. International Conference on Circuits and Systems in Digital Enterprise Technology(2018), pp.1-5
[13]. Suraksha, Sushmita, Sushma, Sushmita Keshav" Disease Prediction of Paddy Crops Using data Mining and ImageProcessingTechniques", IJAREEIE-2016
[14]. Kalavathi K, Nimitha Safar P.V.," Performance Comparison between Naïve Bayes,Decision Tree and kNearest Neighbor ",In International Journal of Emerging Research in management and Technology,ISSN:22789359,Volume 4, Issue 6,2015
[15]. Kaggle: Machine Learning and Data Science Community. 2021. Available online: https://www.kaggle.com/ (accessedon25January2023).
[16]. GoogleWeb Scraper. 2021. Available online: https://chrome.google.com/webstore/detail/webscraper/jnhgnonknehpejjnehehllkliplmbmhn?hl=en (accessed on 25 January 2023).
[17]. Kotlin: A Multiplatform Mobile Framework. 2021. Available online: https://kotlinlang.org/lp/mobile/ (accessedon25January2023).
[18]. Openvino: A Toolkit for Optimizing Deep Learning Models. 2021. Available online: https://software.intel.com/content/www/ us/en/develop/tools/openvino-toolkit.html (accessed on 25January2023).