MEASURE EFFECTIVENESS OF ROUNDABOUTS IN URBAN AREAS AND THEIR COMPARISON WITH SIGNALISED INTERSECTIONS
Abstract – Nowadays,trafficcongestionhasbecomeoneof themainsocietalandeconomicissuesinmetropolitancitiesof bothdevelopedanddevelopingcountries.Trafficcongestionis mainly observed at road intersections in urban areas, and particularly, it becomes severe during peak hours. Roundabouts are popular in urban areas as intersection controls and, as such, used widely irrespective of their effectiveness in terms of safety and capacity. Given that roundabouts have been used widely in urban areas, it is important to measure their effectiveness such as average delay, maximum queue length, the level of service (LOS) and compare them with signalised intersections and signalised roundaboutstogaugetheintersectionsafety,trafficefficiency, and resulting congestion.
Key Words: Roundabouts, Signalised intersections, Signalised roundabout, Delay, SIDRA software, Saturation flow, Cycle Length.
1.INTRODUCTION
Theroadnetworkisanintegralpartofthecommunityland useandcannotbedevelopedindependently.Interestingare nodesofthesystemandsoafundamentalpartofanyroad network, which determines how effectively the network operates. The developing cities face never-ending traffic issues with the increasing rate of vehicle ownership. Emerging road traffic in medium and large cities is a significantchallengeintermsofdevelopinganetworkthat wouldbeabletosatisfytheneedsoftraffic.Intersectionsare acriticalcomponentofthisnetworkandmustbecarefully designedtomanagetrafficeffectively.
During the past decades, major cities have experienced tremendous growth due to industrialization and urbanization.Trafficisexpandingdaybyday,soitisalmost impracticaltocontrolthetrafficmanuallyattheintersection. Althoughthesignalshavebeenprovidedonintersectionsthe traffic congestion has not reduced effectively. To improve trafficconditionsaswellastheaestheticoftheintersection, roundabouts are becoming popular to alleviate traffic congestionwhilekeepinginviewhightrafficvolume.
Inthepresenttime,trafficissuescanbedirectlyattributedto theincreasingvehicleownershipintheurbanareas,these increasedratesofvehiclesrequirespaceformovementwith
safetyhavingenoughcapacityofroundabouts,intersections socapacityevaluationneedstobedoneontheroundabout forefficientoperationoftraffic.Intersectionsinfluencethe safetyandcapacityofurbantraffic.Signalisedintersections areoneoftheintersectiontypesinwhichthearrangement andlengthoftheflowattheintersectionarecontrolledby the signals. For the most part, this kind of intersection is utilizedonroadswithhightrafficvolume.[1]
1.1 Need for the study
Nowadaysroadtrafficcongestionhasbecomeavitalsocietal andeconomicprobleminurbanareasbothindevelopedand developingcountries.Inthelastfivedecades,awidescopeof traffic flow theories and models have been developed to minimisetheissueoftrafficcongestion.[2]Trafficcongestion isprimarilyobservedatroadintersectionsinurbanareas, and especially, it becomes severe during peak hours. Roundabouts are currently considered as an alternative trafficcontroldevicethatcanimprovesafetyandoperational efficiency at intersections when compared to other intersectioncontrols,usuallyfortrafficflowmanagementor to improve safety. Roundabouts play a key role in the improvement of the environmental impact of traffic compared to other forms of at-grade intersections. It is commonly seen nowadays in the urban area that roundaboutshavegainedpopularityandarebeingusedas intersection control at many major urban intersections. However, it is pivotal to measure the effectiveness of roundabouts in urban areas and compare them with signalisedintersections.[3]
1.2 Justification of the study
Firstly, this research applied knowledge to measure the effectivenessofroundabouts,aswellasthecomparisonwith signalised intersections, since the congested streets and intersectionsneedcapacityanalysistogivethepremiseto evaluating traffic lanes. The main advantages are traffic safety, operational performance, environmental factors, pedestrian safety, more efficiency, and aesthetics. The roundabouts are implemented based on geometric and operationalaspects.Asignalizedroundaboutwithacircular islandandsignalizedintersectionswerestudiedintermsof capacity, delay, and emissions located in Ahmedabad, Gujarat.Thisresearchincludedthreetypesofcomparisons: Roundabouts, Signalised roundabouts, and Signalised

intersections using a manual method of PCU count, queue length, saturation flow, delay, as well as compared using SIDRAIntersection8.0analysissoftware.
Theoutcomesofthisstudywouldfocusonsaturationflow, timetakenbyvehiclestoclearthejunction,queueformation, priorityforBRTS,Safety,Pedestrian,andcyclists,estimating thedelayunderheterogeneousconditionsintheAhmedabad city and may be useful to the urban local bodies (such as municipalities, urban development authorities, etc.) in makingdecisions.
1.3 Objective
To measure the effectiveness of roundabouts in Ahmedabadcity.
To make a comparison of roundabouts with signalisedintersectionsforoperationalcapacity.
2. METHODOLOGY
2.1 Traffic volume count
A survey had to be done on weekdays. Classified volume count was carried out at each of the intersections during Peak hours (Morning & Evening) and Off-Peak hours (Afternoon).Themethodadoptedforthesurveywasmanual counting of traffic for 6 intervals of 2 hours. each intersectioninmorningpeak:09:00 AM-11:00AMand in eveningpeak:06:30PM-08:30PMandoff-peak:02:00PM4:00 PM. The Volume in units of numbers was then later converted into one common unit PCU. Traffic counts a Mondaymorningrushhour,andaFridayeveningrushhour may indicate high volumes and are not included in the analysis; therefore, counts are conducted on a Tuesday, Wednesday,orThursday.ThesePCUvalueswereusedfor analysis.[4]
2.2 Selections of study area
Roundabouts:Ujala
SignalisedRoundabout:Nirma,ONGC,Visat
SignalisedIntersections:C.G.Road,VijayRoad
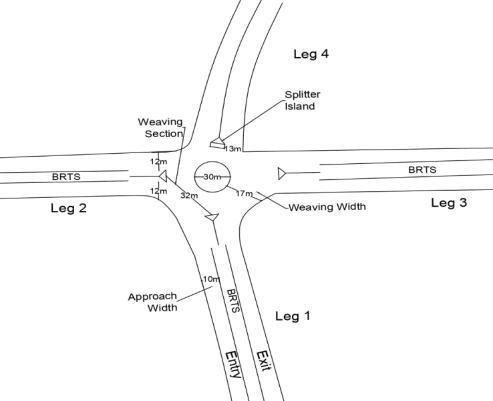
2.2.1 Ujala Roundabouts
• Longitude:72.4928°E
• Latitude:22.9801°N
• Leg1:TowardstheSarkhej-Bavlaroad
• Leg2:TowardstheS.G.Highway
• Leg3:TowardstheUjalabridge
Parameters:
• DiameteroftheRoundabout=28m
• EntryWidth=10m
• ExitWidth=10m
• ApproachWidth=8m
• WeavingLength=29m
• WeavingWidth=9m
• SplitterIsland=9m
• NumberofCirculatingLanes=3
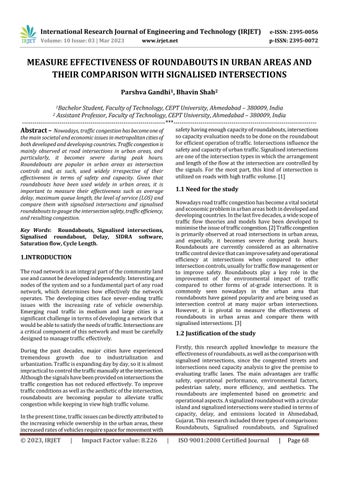
2.2.2 Nirma Signalised Roundabout
• Longitude:72.540682°E
• Latitude:23.020744°N
• Leg1:TowardstheShivajraniroad
• Leg2:TowardstheSahajanandCollege
• Leg3:TowardstheDharnidhar
• Leg4:TowardstheAmbawadi
Parameters:
• DiameteroftheRoundabout=30m
• EntryWidth=12m
• ExitWidth=12m
• ApproachWidth=10m
• WeavingLength=32m
• WeavingWidth=17m
• SplitterIsland=13m
• NumberofCirculatingLanes=3
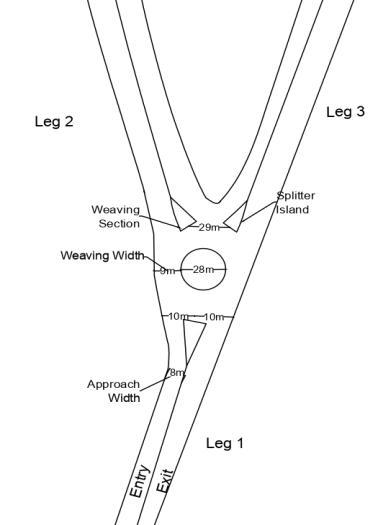
2.2.3 ONGC Signalised Roundabout
• Longitude:72.5975°E
• Latitude:23.1056°N
• Leg1:TowardstheVishwakarmacollege
• Leg2:TowardsthenewC.G.Road
• Leg3:TowardstheUGVCLMoteraoffice
• Leg4:TowardstheMoterastadiumroad
2.2
• Longitude:72.5575°E
• Latitude:23.0284°N
• Numberoflegs=4
• Leg1:TowardstheSwastikcrossroad
• Leg2:TowardstheMithakhalicircle
• Leg3:TowardsthePanchwaticrossroad
• Leg4:TowardstheSt.Xavier’scollege
• ApproachWidth=10m
• NumberofLanes=3
2.2.6
• Longitude:72.5491°E
• Latitude:23.0427°N
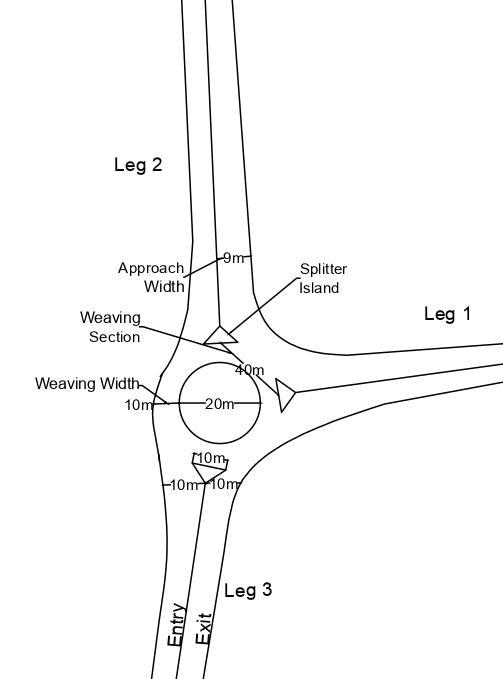
2.2.4 Visat Signalised Roundabout
• Longitude:72.5892°E
• Latitude:23.0986°N
• Leg1:TowardsanEklavyaEnglishschool
• Leg2:TowardstheMehsanabypassroad
• Leg3:TowardstheAhmedabad-PatanHighwayRoad
Parameters:
• DiameteroftheRoundabout=20m
• EntryWidth=10m
• ExitWidth=10m
• ApproachWidth=9m
• WeavingLength=40m
• WeavingWidth=10m
• SplitterIsland=10m
• NumberofCirculatingLanes=2
• Numberoflegs=4
• Leg1:TowardstheDarpancircle
• Leg2:TowardstheCommercesixroad
• Leg3:TowardstheUniversityroad
• Leg4:TowardstheDrive-inroad
• ApproachWidth=10m
• NumberofCirculatingLanes=3
3. Data Analysis
3.1 Traffic volume count
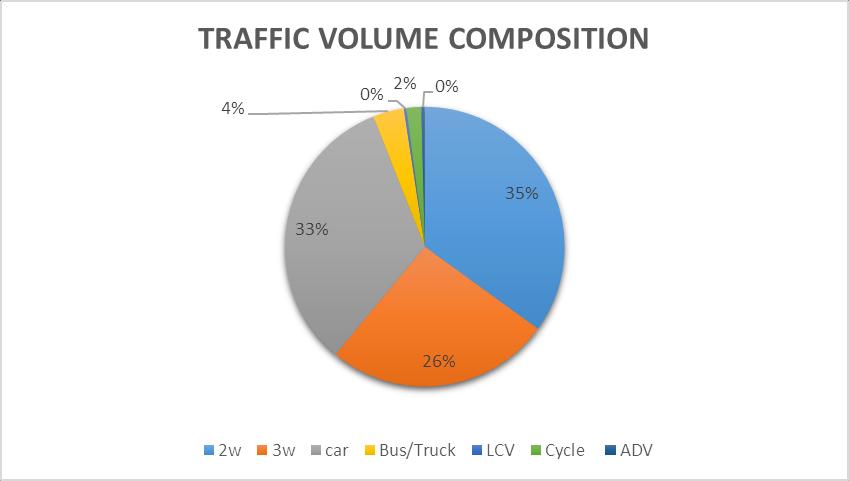
Chart -1:TotalPCUFlow
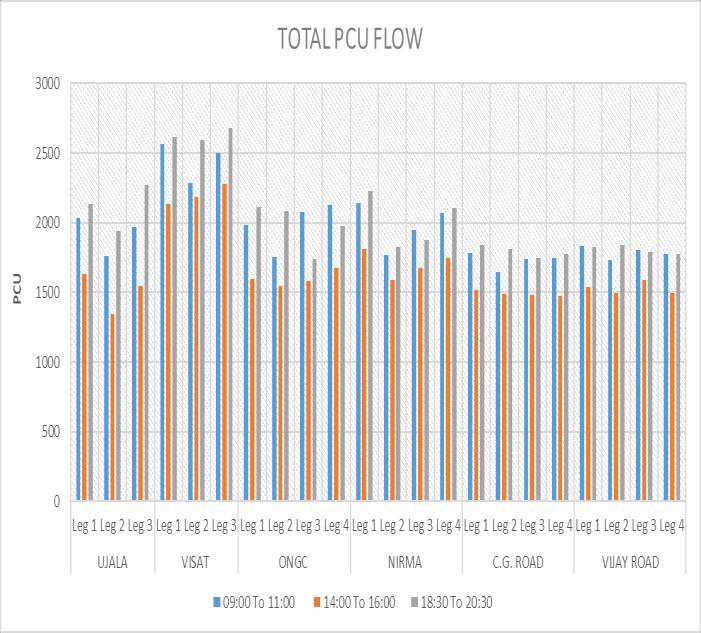
The total vehicle counts were taken at each intersection duringpeakhours(Morning&Evening)andoff-peakhours (Afternoon).Apeakinthemorningfollowedbyaleanflow until another peak in the middle of the afternoon, after whichtheremaybeanewpeakinthelateevening.Thepeak inthemorningisoftenmoresharpbyreachingthepeakover a short duration and immediately dropping to its lowest point.Theafternoonpeakontheotherhandischaracterized by a generally wider peak. The peak is reached and dispersed over a longer period than the morning peak. However,inurbansatellitetowns,themorningpeakmaybe too early and the evening peak may be too late in comparison to the principal towns without significant middaypeaks.Chart-1showstheTimevsno.ofvehicleflow for the same intersections and reflects the variant in the flow.
Chart -3:DelayatIntersectionsandRoundabouts
Chart-3showsacorrelationwiththeobserveddelay.
It is observed that delay is more due to longer cycle time. Also if the proportion of green allotted to a particular approach is less, vehicles have to stand in a queue for a longer period as the Red time increases. It considers the effectoftheGreenRatio(g/c)ratio,Roadwidth,andtraffic compositiontodeterminethestoppeddelay.
Forthesamecyclelength,delaydecreaseswiththeincrease in the g/c ratio on a particular leg of the intersection. Similarly,forthesamegreentimeindifferentcyclelengths, delaydecreaseswithanincreaseintheg/cratio.
If, sg>qc indicates that there is no delay in that approach.
If, sg<qcthisindicatesadelayintheapproach.
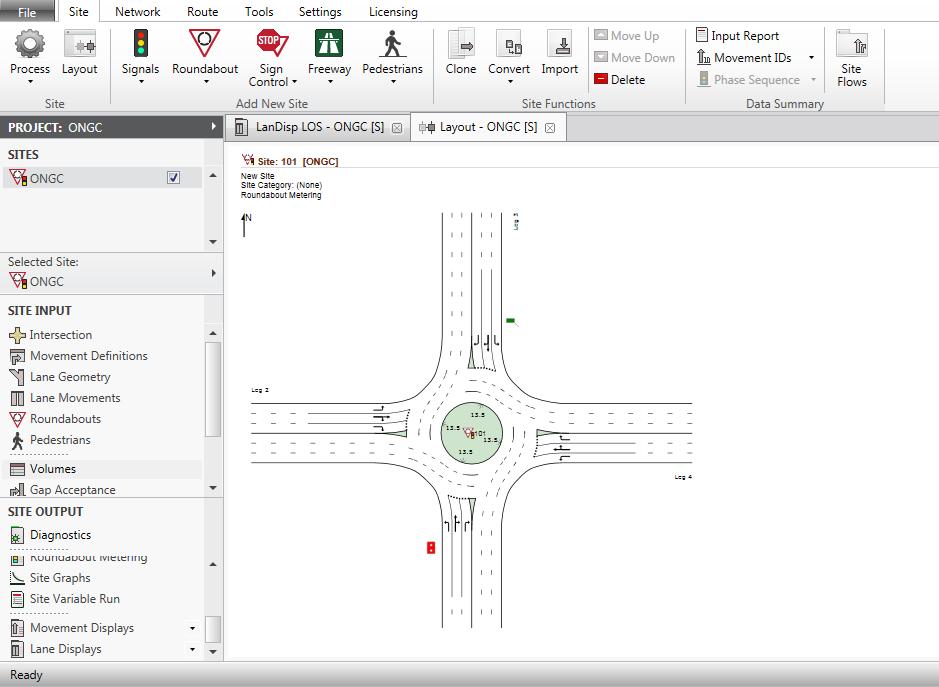
3.2 SIDRA
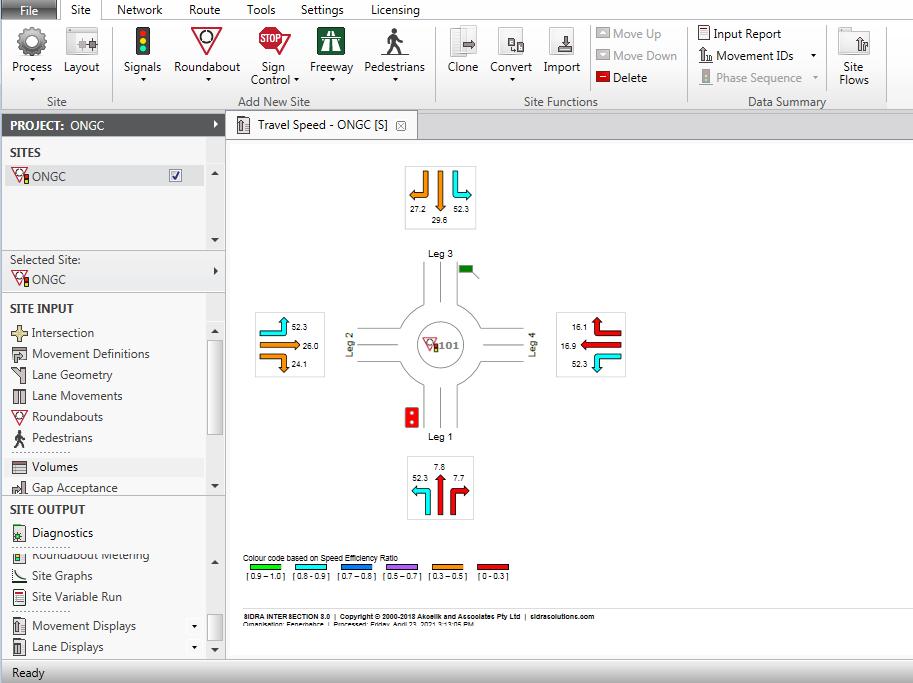
Chart -2:TotalPercentageofVehicle
Figure6depictsthelayoutofintersectionsandroundabouts. SIDRA software is used to calculate the travel speed efficiency, Delay control, and Level of services (LOS) at intersections and roundabouts and compare it to manual data to provide a more accurate image. In the Level of services,Adenotesfreeflow,Bdenotesreasonablyfreeflow, Cdenotesstableflow,DdenotesApproachingunstableflow, Edenotesunstableflow,andFdenotesforcedorbreakdown flow. Los F denotes high congestion at intersections or roundabouts,aswellasalackofcomfortandconvenience forcommutingusingthisroute.ToimprovetheLOS while providingapleasantdrivingexperienceforallroadusers.
4. CONCLUSIONS
Signalisation enhances the operational efficiency of roundabouts.Itisparticularlyeffectivewhenunacceptable vehicledelaysoccurduetohightrafficvolumesfromone; causingunacceptablequeues.Dueto thepandemic,traffic flow and PCU count may be affected. No evidence was identified to suggest that a signalization would degrade roundabout traffic operations. When traffic signals are installed that stop both entry and exit traffic at the same time, allowing pedestrians to cross from both directions, queues back up into the circulating roadway, and disrupt trafficoperations.Sincesaturationflowislowsogreentime shouldbeincreasedtoreducetrafficcongestionatsignalised intersectionsandroundabouts.
The performance of both signalised and unsignalised roundabouts,signalisedintersectionswasevaluatedbased on, such delays, maximum queue length, and the level of service(LOS).Itwasalsoconcludedthattheaveragedelayof thesignalizedroundaboutswasimprovedby(9%to35%) andtheLOSimprovedbytwolevels.
Duringthisstudytheobservationsthathavebeenrecorded inthefieldofstudyareasareasfollows:
I. The LOS in the morning period was better than the eveningperiod,whichmeansthatthevolumeoftraffic flowsintheeveningmorethaninthemorningperiod.
II. The capacity of an intersection and roundabout was unabletoabsorbthehugevolumeoftrafficflowatrush hours.
III. Someintersectionsandroundaboutsneednewlanesto beaddedtoreducethecongestionandimprovesystem speed.
IV. Someintersectionscouldn’thavenewlanesaddedto them.Therefore,alternativeroutesmustbeopenedto reducetrafficjamsattheseintersections.
REFERENCES
[1] Rashed, O., & Imam, R. (2020). A Functional and Operational Comparison between Signalized and UnsignalizedRoundabouts.13(6),1448–1454.
[2] Chimdessa, Y., Kassa, S. M., & Lemecha, L. (n.d.). EfficiencyofRoundaboutsasComparedtoTrafficLight ControlledIntersectionsinUrbanRoadNetworks.5(2), 81–100.
[3] IRC 69: 1977 "Space standards for Road in Urban Areas",TheIndianRoadCongress,NewDelhi,1977
[4] IRC SP 41: 1994 “Guidelines on Design of At-Grade IntersectionsinRural&UrbanAreas",TheIndianRoad Congress,NewDelhi,1994