Design of The Cooling System for Optimizing the Performance of Solar Panel
1 Student, Dept. of Mechanical Engineering, Pillai College of Engineering, Maharashtra, India
2 Professor, Dept. of Mechanical Engineering, Pillai College of Engineering, Maharashtra, India ***
Abstract - There is a persistent need for further development and implementation of renewable energy sources, such as wind and solar. Due to the increase in global population, the disappearance of fossil fuels, and thereality of climate change, renewable powerisneeded nowmore than ever. Thesemodules work via siliconcells which are as semiconductors, outputting electrical energy when incident with solar radiation. This is done by separating electrons and protons within the cell. Additionally, the lifespan of a PV system is significantly reduced as a result of cell degradation due to excess thermal stress. For this project, I have modeled, prototyped, and tested three cooling systems for PV modules. Two of the cooling systems are passive, nonpower consuming. One simply consisting of a large Acrylic tank centeredon the backsideof the module, and the other consisting of a combination of copper heat pipes and the same aluminum heat sink. The third system consisted of a water-cooling methodwherewater was pumped over the working surface of the module from areservoir,being evenly spread across theworking surface through a perforated tube.
1.INTRODUCTION
Thisdocumentistemplate.Thegrowingacceptanceof climatechangeasarealandpresentdangeralllifeon Earth.Allofthesefactorshavecausedahugeincrease intheinvestmentofrenewablepoweroptions.Solar
PV, photovoltaic, is just one of numerous promising renewablepowergenerationsmethods.Unfortunately, PVcelltechnologyperformanceissensitivetooperating temperature.Sincepowerisgeneratedviasiliconcells which is semiconductor material, outputting electric power when incident with solar radiation. Like all semiconductorsastheoperatingtemperatureincrease s, the output voltage drastically decreases despite a slight increase in the output current resulting in an overallsignificantreductioninpowerproductionand moduleefficiency.Photovoltaicsglobalpotential,asa primary power source, is dependent upon designing moreefficientPVsystems.Creatingimmenseinterest withinthescientificcommunityinpossiblePVcooling overthelast40year
1.1 Operating Principle
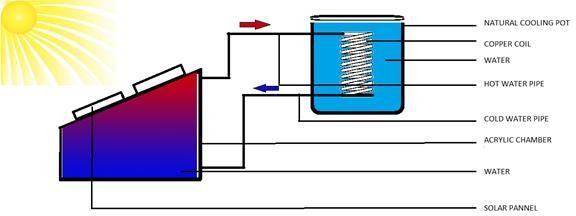
Photovoltaicsdirectlyconvertsolarradiationintoelectricity. Eachcelliscomprisedoflayersofasemiconductingmaterial, p and n-Type. When incident with light, the cell enacts an electricfieldbetweenlayers,resultinginanoutputvoltage andcurrent.Thecellsareeitherpolycrystalline,madeupof piecesfromnumeroussiliconcrystals,ormonocrystalline, which are cut from a single large crystal. That process of conversiontakeplacewithadditionofheatwhichincreases the PV cell temperature, which later transferred into the waterthroughcopperplate. AsthetemperatureofPVcell increases the water temperature increases. As the water surface whichis in contact with plate getting warmer and warmer it starts to moving through copper pipe which is submergedinawaterinenclosedearthenpot.

Experimental Readings (Without cooling system) (Avg. Value)
Table -1: experimentalreadings
2. LITREATURE REVIEW
Manyacademicshaverecentlystartedlookingatsolarpanels and techniques to harvest thermal energy from them. Numerousresearchusingthefrontandbacksidesofthecells forcoolinghasbeenexploredinanumberofstudies.Several attemptshavebeendocumentedtocontrolthetemperature of PV panels using air, water, piezoelectric materials, and othermethods.Solarpanels'efficiencydegradesasaresultof absorbedheat;hencesolarpanelcoolingiscritical.
1. Mohsin Jamil et al. In 2014 presented the possibility of extraction of thermal energyfromthe panelsusing water. Their research shows The results of the experiment for improvingefficiencyofsolarpanelusingmirrorsandcooling werecomeouttobehighlyencouraging.Usingmirrorsplus cooling is better than the other two as efficiency is approximately52%
2. K.A. Moharram, et al. In 2013 reported performance enhancementbycoolingofphotovoltaicpanels.Systemfor coolingwasdesignedanddevelopedusingwaterascoolant. Thecoolingsystemwascombinedthroughsolarphotovoltaic panelstoformhybridsystem.Coolingagentforcoolingthe solar panels i.e. water, was continually circulated in the region of the PV panels. The high temperature water generated from the system can be used for varietyofhouseholdapplications.
3. Fahad Al-Amri, et al. In 2020 reported performance enhancementbycoolingofphotovoltaicpanels.Systemfor coolingwasdesignedanddevelopedusingpassivecooling. Thecoolingsystemwascombinedthroughsolarphotovoltaic panelstoformhybridsystem.Thesystemusedforcooling thesolarpanelsi.e.heatsinkinadditionwithPCMmaterial.
4.BarbaraSwatowska,etal.In2011designedanddeveloped ahybridtypeSiliconcellsolarsystem.HeinvestigatedThat reflectioncoefficientcanbereducedbycoveringthetopof the solar panel surface by antireflective coatings and also discusstheeffectofthicknessofARConsolar
5. A. Ibrahim et al. In 2011 presented comprehensive simulationstudies.Intheirresearchtheyhavestudiedthe relationofsolarpanelefficiencyandoperatingtemperature in outdoor atmosphere. Cold temperatures produce more efficientphotoconversionforsingle-crystalsolarpanels.The efficiency for single-crystal solar panel decreases as the operatingtemperatureofcellsincreases.Itisreportedinthe
literaturethatthedecreaseintheefficiencyisapproximately 0.06inabsolutevalueper˚Cincrease
6. F.M.Gaitho etal.In2009reportedthattheefficiencyof singlecrystalsiliconsolarpanelverymuchdependsonthe thermal system of the entire cell, the main factor being thermal conductivity, which is greatly seen to vary with temperature.Theefficiencyofthiscellisoptimumwhenits output is at its highest value at a nominal operating cell temperatureof312K.
7.YMIrwan,etal.In2015comparedairandwatercooling methodsandfoundoutthatwaterascoolingagentismuch bettercomparedtoair.Forconstantairmovementtheyused fan and water pump was used to maintain circulation of coolant on the reverse side and front side of PV module respectively.TemperaturedetectionofPVTemperaturewas carriedbysensorswhichwereinstalledonthePVmodule To automatically switch ON or OFF fan and water pump was connectedtoPICmicrocontroller.
8. Manel Hammami, et al. In 2017 reported despite the coolingair gap,there isa remarkablePVcell temperature increaseintroducedbythebacksidebatteries,estimatedat 20
25°CforthePVcellsonthebatteryarea.
Toprepareanymachinepart,thetypeofmaterialshouldbe properlyselectedbyconsideringdesign,safetyandfollowing points:
Theselectionofmaterialforengineeringapplicationisgiven bythefollowing Factors:-
1) Suitabilityofthematerialfortherequiredcomponents.
2) Suitabilityofthematerialforthedesiredconditions
3) Availabilityofmaterials.
4) Costofthematerials.
Thecoolantwhichweselectedforthisexperimentis Water.
Tank is made of Acrylic, as Acrylic is much economical comparedtoanyothermetalandalsoputgoodresistance tooutsideheat

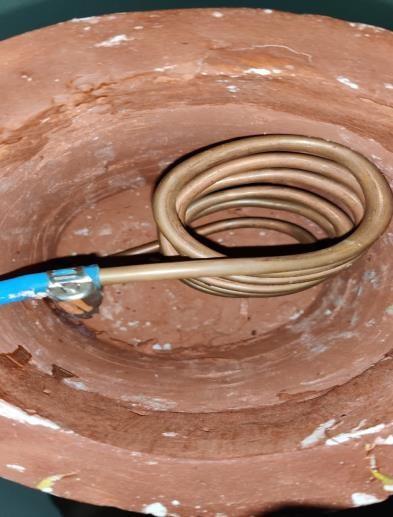
CoolingchamberusedhereismadeofmudandPOPasit hasporoussurfaceandcanperformcapillaryactionand keepsthewatercoolwhichisstoredinside.
Pipeswhichisusedhereareofcopperasitisagood thermalconductor.
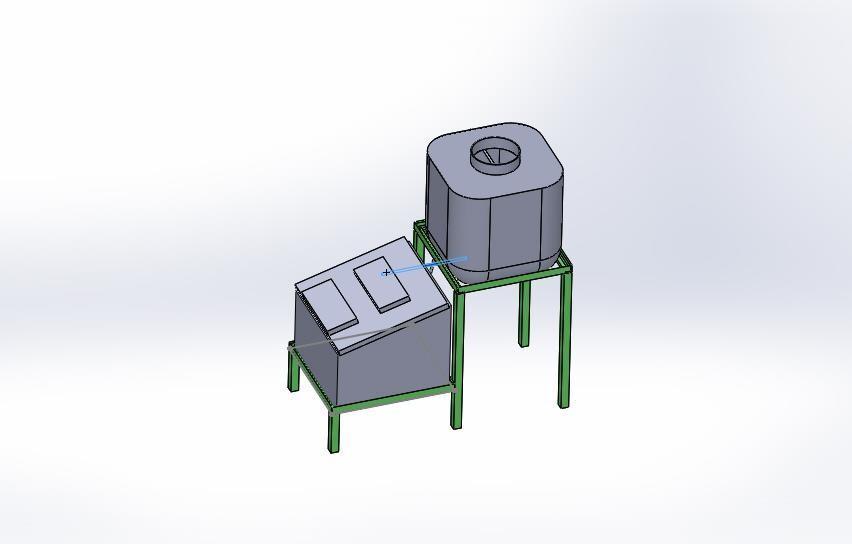
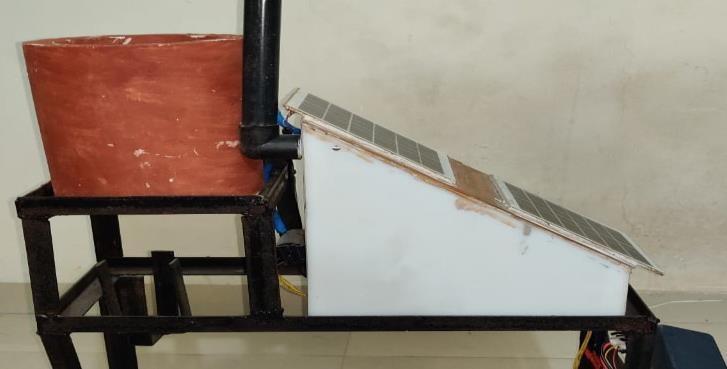
3.5 Prototype
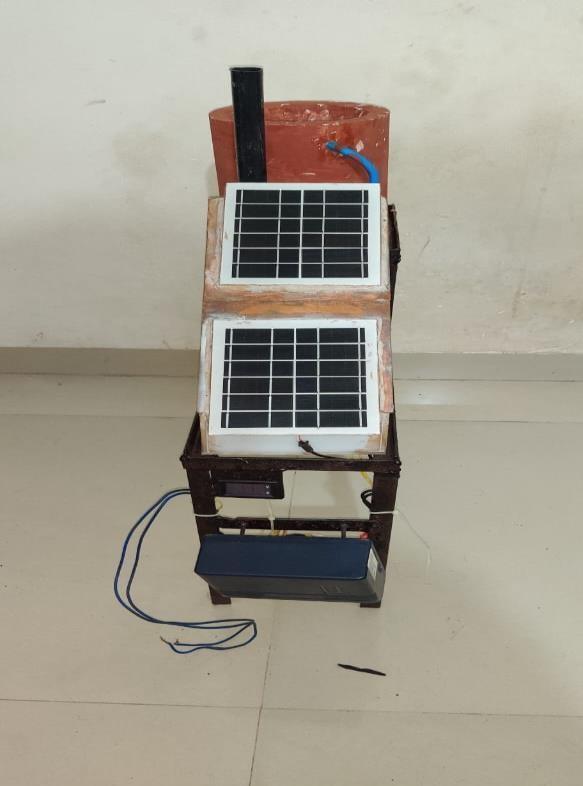
Table -43.: experimentalreadings(WithoutWater)
Table -4.4: experimentalreadings(WithoutWater)
Table -4.5: experimentalreadings(WithWater)
4. Experimental Observation
From October/28/2022, until November/4/2022, we conductedanexperimenttoobtainthemostaccuratereading possible.Theresultsarehighlyencouraging,andthereading weobtainedduringthisexperimentislistedbelow.
Location NaviMumbai,Panvel
Rangeoftemperaturein day 28Cto36 C
Atmosphericpressure 1Bar
Localtimeofconducting theexperiment 12.00PMIST
Table -4.1: GeographicalConditionofarea
Table -4.7: experimentalreadings(WithWater)
Table -4.2: experimentalreadings(WithoutWater)
Table -4.8: experimentalreadings(WithWater)
Table -4.9: experimentalreadings(WithWater)
6.REFERENCES
[1]FahadAl-Amri,TaherS.Maatallah,OmarF.Al-AmriSajid Ali,SadaqatAli,IjlalShahrukhAteeq,RichuZachariah,Tarek S. Kayed Innovative technique for achieving uniform temperaturesacrosssolarpanelsusingheatpipesandliquid immersion cooling in the harsh climate in the Kingdom of Saudi Arabia Alexandria Engineering Journal (2022) 61, 1413–1424
[2]K.A.Moharram,M.S.Abd-Elhady,H.A.Kandil,H.El-Sherif Enhancingtheperformanceofphotovoltaicpanelsbywater cooling,AinShamsEngineeringJournal(2013), AinShamsEngineeringJournal(2013)4,869–877
Table -4.10: experimentalreadings(WithWater)

[3] A. Ibrahim Analysis of Electrical Characteristics of Photovoltaic Single Crystal Silicon Solar Cells at Outdoor Measurements,SmartGridandRenewableEnergy,2011,2, 169-175
[4]Manel Hammami Simone Torretti, Francesco Grimaccia andGabrieleGrandiThermalandPerformanceAnalysisofa
Table -4.11: experimentalreadings(WithWater)
4. Summary of conclusion
1. Fromtheaboveexperimentwecansafelyconclude thatwhenthereisnoactivecoolingsysteminvolve themaximumaveragepoweroutputis5.06W(Ref. Table4.1).
2. But When we start using the cooling system the averageoutputincreasesto5.3Walsotheaverage currentoutputisalsoincreasedto0.9(Ref.Table 4.2toTable4.10).
3. Apartfromthattheaveragemaximumtemperature attained by the solar plate is 71 0C while with activatedcoolingsystemtheaveragetemperature liesbetweentherangeof60 0C-63 0C.
4. After completion of the experiment the average poweroutputincreasesby7%.
5. AverageMaximumtemperaturedecreasesby8 0C whichcanpreventcelldegradationandincreases thelifeexpectancyofsolarplate.
6. Theabovementionareshorttermadvantagesthat we have seen during the experiment, for more accurateoutcomeswehavetoexpandtheduration ofcourse.
5.ACKNOWLEDGEMENT (Optional)
Theauthorssincerelyappreciatethetechnicalassistance offered by the Prof. Shilpa Mondkar and Department of MechanicalEngineering,MESPillaiCollegeofEngineer
Photovoltaic Module with an Integrated Energy Storage System,IEEETrans.EnergyConvers.2015,30,1386–1396
[5] RizwanArshad,SalmanTariq,MuhammadUmairNiaz, Mohsin Jamil Improvement in solar panel efficiency using solarconcentrationbysimplemirrorsandbycooling 2014 International Conference on Robotics and Emerging AlliedTechnologiesinEngineering(iCREATE)
[6] E.M.G. Rodrigues, R. Melício, V.M.F. Mendes and J.P.S. CatalãoSimulationofaSolarpanelconsideringSingle-Diode EquivalentCircuitModel,International Conferenceonrenewableenergiesandpowerquality,Vol.1, No.9,May2011
[7] BARBARA SWATOWSKA, TOMASZ STAPINSKI, KAZIMIERZ DRABCZYK, PIOTR PANEK The Role of Antireflection Coatings in Silicon Solar Cells
The InfluenceonTheirElectricalParameters OpticaApplicata,Vol.XLI,No.2,2011
[8]F.M.Gaitho,F.G.Ndiritu,P.M.Muriithi,R.G.Ngumbu,J.K. Ngareh Effect of thermal conductivity on the efficiency of singlecrystalsiliconsolarcellcoatedwithan anti-reflective thin film Science direct Solar Energy83(8):1290-1293
[9]AnkitS.Gujrathi,SudhirU.Patil,SachinP.IngaleAnalysis of Solar Photovoltaic Thermal System with air cooling SpecialIssue
ICRTET-2018ISSN:2454-9150