Depression Detection Using Various Machine Learning Classifiers
Amaan Khan, Jayeshkumar Kharol, Abhishek Gaikwad, Swapnil Jagtap, Prof. Suresh Mestry Rajiv Gandhi Institute of Technology, Mumbai 400053 Professor Suresh Mestry, Dept. of Computer Engineering, Rajiv Gandhi Institute of Technology, Maharashtra, India***
Abstract - Datasetsderivedfromsocialnetworksareuseful in several areas, including neuroscience and psychology. Recent studies have indicated a correlation between high usage of social media and increased depressed users. However, technical assistance is inadequate, and precise approaches are desperately needed. By using Machine learning and Natural language processing, depressed consumers of Twitter are detected. Sentiment analysis is used for obtaining the polarity of the text. The model is trainedandtestedusingdifferentformsofclassifiers.The qualityofeachclassifierisinvestigatedandthepre-eminent modelisused.Finally,withintheproposedmodel,aGUIfor depression detectioniscreated. Hence the project would identifyuserswithdepression.
Key Words: Sentiment Analysis, depression detection, Machine learning (ML), Social Media , Natural Language Processing
1. INTRODUCTION
According to the World Health Organization (WHO), depression is the leading cause of disability worldwide, affectingmorethan264millionpeopleofallagesworldwide. Post-traumatic stress disorder (PTSD) is a form of depression that develops after exposure to a potentially traumaticevent,suchaswitnessinganaccident,physicalor sexual assault, combat, or death. Approximately 8 million adultsintheUnitedStateswillexperiencePTSDinagiven year. It is a serious medical condition causing persistent thoughts of traumatic memories, insomnia, and severe anxiety.Earlydiagnosisandtreatmentarethereforeofthe utmostimportance.Therapiesandmedicationsareavailable foreffectivetreatment.Withtheriseofsocialmedia,people tendtopostmostoftheiractivitiesonlineastextandimages, whichlargelyreflectstheirmentalhealthstatus.Detecting theseindicatorscanhelpwithearlydiagnosisandsavelives inthefuture.Depressionisoneofthemostcommonmental illnesses,butremainsundiagnosedoruntreatedduetolack ofawarenessordenial.Severedepressioncanbeprevented byearlydetectionofsymptomsandtimelyinterventionand treatment.
Because users express their feelings through messages or commentsontheTwitterplatform,sometimestheirtweets refer to emotional states such as "joy", "sadness", "fear", "anger"or"surprise".Wecollectthisdatatoanalyzevarious featuresfromthesetweets.
This study uses data collected from 20,000 tweets from differentuserprofiles.Anumberofclassificationmethods are used to determine the degree of depression, of which ETF(Extra TreeClassifier) showsthe bestresultswithan accuracyof94 and precisionof97.29.TherestoftheArticle isasfollows.Section2illustratesliteraturereview.Section3 explains the methodology of study and the features extracted.Section4representsthecomparativestudyand systemarchitecture.Section5describesthediscussesresult andconclusions.FinallySection6outlinesthefuturework ofthestudy
2. Literature Review

Psychological analysis can be carried out using various methods, with the text-based dataset. In this section, we discuss the previous works performed using various techniques for psychological analysis and the depression detection task. With the gradual increase in social media usageandtheextensivelevelofself-disclosurewithinsuch platforms, efforts to detect depression from Twitter data haveincreased[1].
[2]Studieshavebeendoneonbothimbalancedandbalanced data. Any data that does not contain missing values in imbalanced data may be subject to resampling. Balanced data isdividedinto twotypes:(1)positivetweetsand(2) negative tweets. In an imbalanced dataset, the number of instanceswithpositiveandnegativetweetsischeckedfirst. This reduces the overall predictive performance of the model. Modelling of imbalanced data is done using data resamplingmethods.
Experiments in the proposed task were performed three times.Experiment1performsdepressiondetectionusingan imbalanceddataset.InExperiment2,theSMOTEresampling method was implemented to solve the class imbalance problemofthetrainingdataset.Experiment3implements the RUS under sampling method to solve the problem of imbalance in the data set. We analyze and compare the performanceoftheaboveclassifiers.TheLSTMclassification model outperforms other basic models in its approach to detectingdepression.
[3]The focus of the study was to combine four types of factors: affective processes, temporal processes, verbal styles,andall(emotional,temporal,andverbalstyles)traits todetectandprocessdepressiondatareceivedintheformof Facebook posts. Study and detect depressive behavior in
Facebook comments. Information taken from social networks.NCapturewasusedtopreparesocialmediadata for Facebook[,] data collection. explored elements of each type individually using a supervised machine learning approach. For each type, classification methods such as "decision trees", "k-nearest neighbors", "support vector machines",and"ensembles"areconsideredappropriate.The results show that decision trees (DTs) outperform other machinelearningapproachesinavarietyofexperiments.
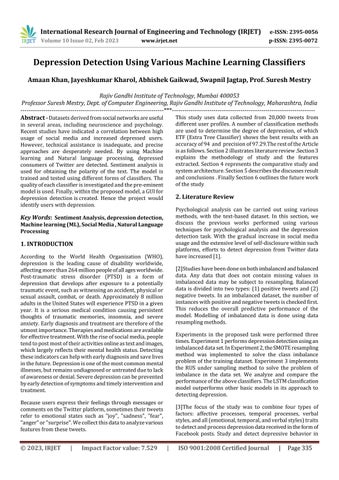
[4]A quantitative study was conducted to train and test differentmachinelearningclassifierstodetermineifauser ofaTwitteraccountisdepressedbasedontweetsinitiated orbehavioronTwitter.Datapreparation,featureextraction and classification tasks were performed in R version 3.3 with Rstudio IDE . To avoid overfitting, the classifier was trainedusing10-foldcross-validationandthentestedonan extendedtestset.Theydemonstrateddepressiondetection using the Activity and Content Functional Classification (DDACF) model. First, all tweets for depressed and nondepressed accounts are retrieved, as well as user account and activity information such as number of followers, numberoffollowers,totalmessages,posttime,numberof mentions,andnumberoflikes.
[5]Quantitativestudieswerederivedasreviewarticles by comparingmethodologieswiththosepublishedinjournals. Although these studies provide encouraging results, they also highlight some important limitations and challenges. Forexample,theaccuracyofdetectingdepressioninsocial media data is determined by the quality and representativeness of the data and the algorithms and featuresusedintheanalysis.
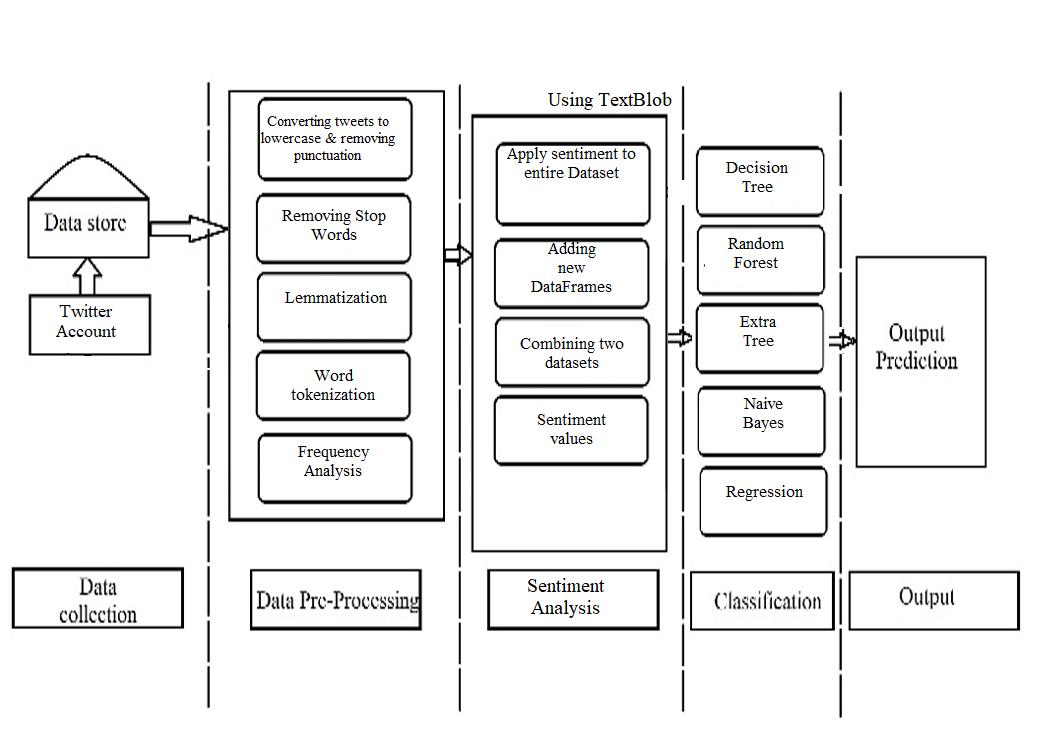
3. Methodology
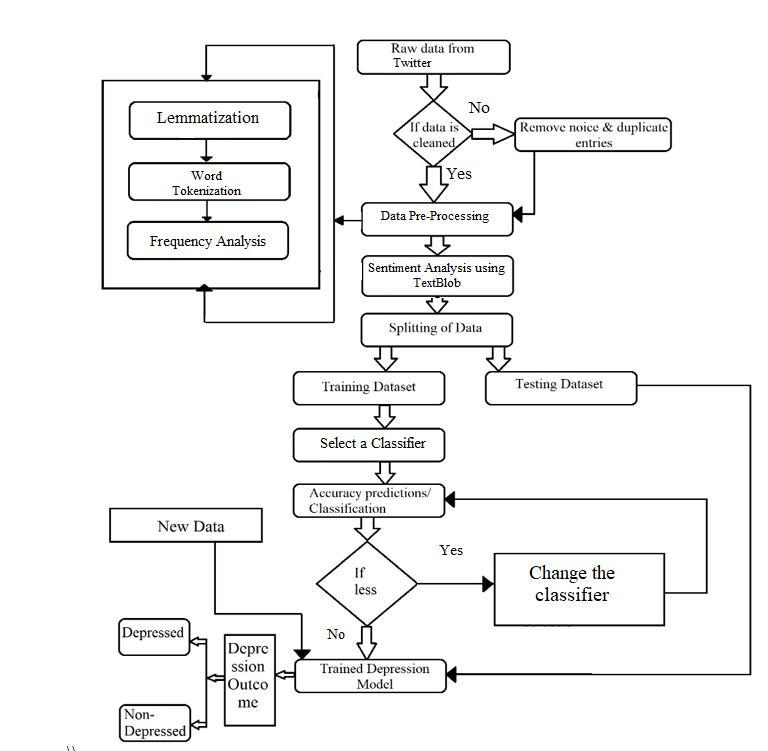
People frequently experience mental health issues. Depression is the fastest-growing health disorder; it is caused by a change in mood, which includes elements of motivational and emotional conditions. Despite the popularityofsocialmediaplatformsandtherapiditywith whichtheyhavepermeatedalmosteveryaspectofourlives, thereisasignificantlackofcleardataonhowtheyaffectus personally,suchasourbehaviour,socialrelationships,and mental health. We conducted a quantitative study in this papertotrainandtestvariousmachinelearningclassifiers to determine if a user of a Twitter account is depressed based on tweets initiated by the user or his/her Twitter activity.
3.1 Data preparation
Used data from 20,000 Twitter users. Data collected from socialmediaplatformscancontainerrorsorobsoletetext, making sentiment analysis difficult. Since there are no emoticonsinthedatasetweareusing,thereisnoneedto processemoticons.Featureextractionreducesthenumber ofrawdataprocessinggroups.
Feature extraction is the process of selecting data and combiningthemintofeaturestoreducetheamountofdata thatmustbeaccuratelyprocessedandcarefullydescribethe original data set. The amount of redundant data for this analysis is also reduced. Therefore, feature extraction is performed by removing unnecessary data.Then clean the tweets by converting them to lowercase, removing punctuationandnumericvalues,andremovingstopwords. Stopwordsareimportantinmanyapplicationsbecausethey allow you to focus on the important words by removing commonly used words in a given language. Removing stopwordsisdoneinPythonusingNLTK.Alistofstopwords can be loaded, and the system is used to extract roots by removingsuffixesorprefixesassociatedwithwords.Inthis study, a Snowball morpheme analyzer, which is different from the Porter morpheme analyzer,isused in thatit can perform morpheme analysis on multiple languages. Tfidfvectorizer is used to tokenize the given document. FrequencyAnalysisisalsocarriedout.
3.2 Sentiment Analysis
Sentiment analysis (also known as opinion analysis) is a natural language processing (NLP) technique for determiningwhetherdataispositive,negative,orneutral. Sentiment analysis focuses on the polarity of the text (positive,negative,orneutral),butgoesbeyondpolarityto specific feelings and emotions (anger, joy, sadness, etc.), urgency (urgent, non-urgent), and even intentions (interestedvs.nointerest).TextBlobwasusedtoanalyzethe sentimentofthedataset.
TextBlob uses the Natural Language ToolKit (NLTK) and input is limited to one sentence. TextBlobs breed polarity and subjectivity. Polarity scores range (-1 to 1), with -1 identifying the most negative words such as "disgusting", "terrible" and "sorry" and 1 identifying the most negative
wordssuchas"excellent"and"best".Identifypositivewords. "..Thesubjectivityscoreisbetween(0and1).Itshowsthe degree of personal opinion. If the proposal is highly subjective,i.e.Closerto1,thetextappearstocontainmore personalopinionsthanfactualinformation.
3.3 Modeling
The cleaned dataset is now used to train and test the machinelearningmodel.Scikit-learnmakesiteasytocreate andtrainmodels.Thedatasetissplitintotwoparts,training andtesting,andissplit80/20.Thedatasetistrainedwith various classifiers such as Random Forest, Decision Tree, NaiveBayes,Regression,etc.andaccuracyiscalculated.We found that the Extra Tree had the highest accuracy in predictingwhetherornotaTwitteruserwasdepressed.
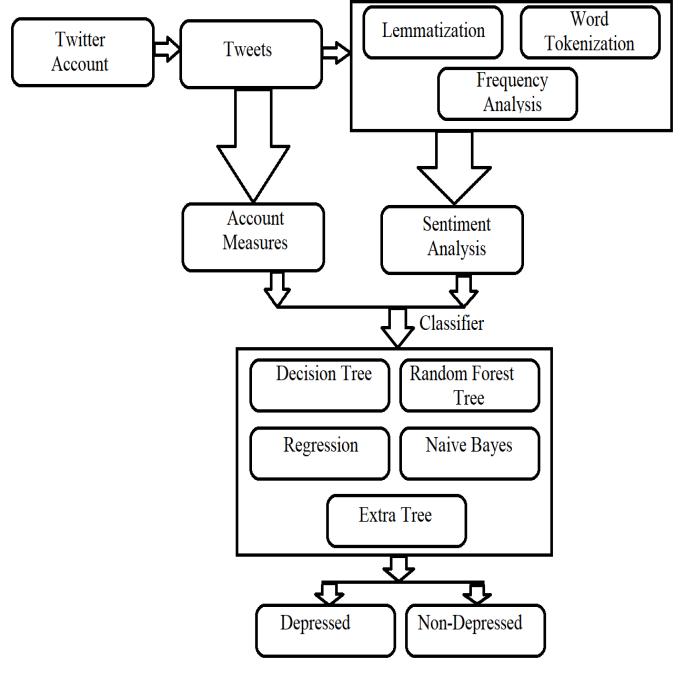
After applying Sentimental Analysis, we compared the positivetweetsversusNegativetweetsinthefig4.2below.
Result
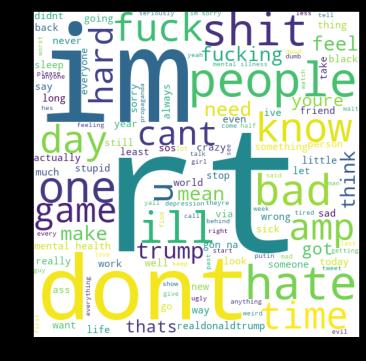
Wordcloudwascreatedtohighlightpopularwordsusedin negativemoodsandphrasesbasedontheirfrequencyand relevance.Thisgaveusquickandeasyvisualinsightsthat couldleadtodeeperanalysis.
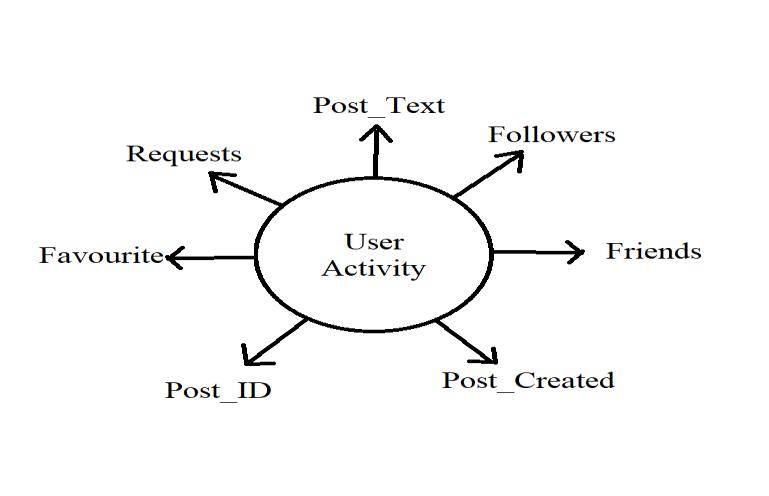
4 .0 Comparative Study & System Architecture:
The proposed action has been completed. We discuss, analyze and compare the work of classifiers. The classificationalgorithmwasanalyzedusingthescikit-learn library and the plots were generated using the Matplotlib library.
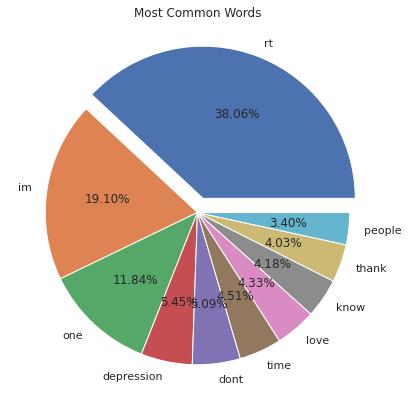
Thedatawaspre-processedandcleanedbeforeidentifying themostcommonwordsinthedataset.AsshownintheFig 4.1
DifferentclassifierssuchasSupportVectorClassifier(SVC), K-Nearest Neighbors (KNN), Decision Trees (DT), ComplementaryTreeClassifier(ETF),RandomForest(RF), Logistic Regression (LR), Nave Bayes, Gradient Boosted Decision Trees (GBDT) ) ) and xgboost were trained and analyzed.
1.SVM: SVMstandsforSupportVectorMachine.Asupport vector machine is a model for two-group classification problemsusingclassificationalgorithms.SVMisastableand fast algorithm. It consists of a line, called a decision boundary,thatseparatestwodataobjects.
This serves as the pivot of separation. Separating axis equation:
Y = mx + c, wheremistheslope.Thehyperplaneequationseparating thedataentitiesisnowH:wt(x)+b=0.wherebistheoffset.
2. Decision tree (DT):Adecisiontreeisadecision-making toolthatcontainsprobabilitiesofeventoutcomes,resource costs, and utilities. It is used for predictive modeling, statistics, and machine learning. Information gain is an importantparameterindecisiontreesbecauseitreducesthe amountofinformationneededtodifferentiatebetweentwo datapointsforapartition
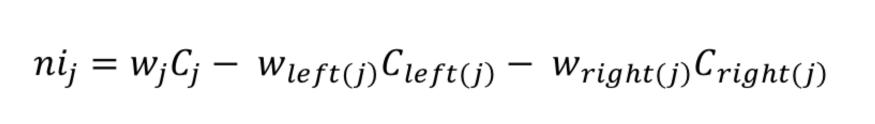
right(j)=childnodefromrightsplitonnodej
4. Extra Tree Classifier: Extremely Randomized Trees Classifier(Extra Trees Classifier) is a type of ensemble learningtechniquethataggregatestheresultsofmultipledecorrelateddecisiontreescollectedina"forest"tooutputits classificationresult.Inconcept,itisverysimilartoaRandom Forest Classifier and differs only in the way the decision treesintheforestareconstructed.TheExtraTreesForest's
DecisionTreesarebuiltfromtheoriginaltrainingsample. Then,ateachtestnode,eachtreeisgivenarandomsample ofkfeaturesfromthefeatureset,fromwhicheachdecision treemustchoosethebestfeaturetosplitthedataaccording tosomemathematicalcriteria(typicallytheGiniIndex).This randomsampleoffeaturesleadstothecreationofmultiple de-correlateddecisiontrees
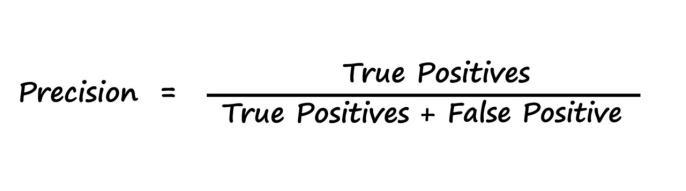
TheanalysisresultsarepresentedinFig4.4and4.5,andit can be seen that the Extra Tree Classifier is the most effectivemodel.Theseclassifierswererunusingthescoring matrix parameters (precision, recall, and F-score). It was doneinfourdifferentways.TruePositive(TP)=Depressive case that is positive and expected to be positive. A true negative(TN)caseofdepressionisonethatisnegativeand expected to be negative. False Negative (FN) depression cases are those that are positive but are expected to be negative.FalsePositive(FP)depressioncasesarethosethat arenegativebutareexpectedtobepositive.
Precision is the ratio of true positives to cases that are expectedtobepositive.Itisthelevelofselectedcasesthatis correct.
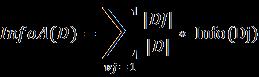
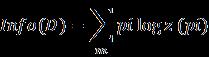
Inthiscase,pirepresentstheprobabilitythatatupleindata set D is of class ci. Info(D) is the average amount of data requiredtodeterminewhichdataobjectclassDitbelongsto. Theinfogainiscalculatedas
Gain(A) =info(D) − infoA(d).
3. Random Forest:Arandomforestisaclassifierthatuses multipledecisiontreesfordifferentsubsetsofagivendata setandaveragesthemtoimprovethepredictiveaccuracyof thedataset.Ratherthanrelyingonasingledecisiontree,a randomforesttakespredictionsfromeachtreeandpredicts the final outcome based on the majority of predictions. Scikit-learnassumesonlytwochildnodes(binarytree)and usesGiniimportancetocalculatetheimportanceofnodesin eachdecisiontree.nisub(j)=theimportanceofnodej
wsub(j)=weightednumberofsamplesreachingnodej
Csub(j)=theimpurityvalueofnodej
left(j)=childnodefromleftsplitonnodej
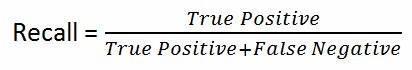
Recall is the proportion of true positives to the cases that trulypositive.Itisthelevelofchosencasesthatareselected
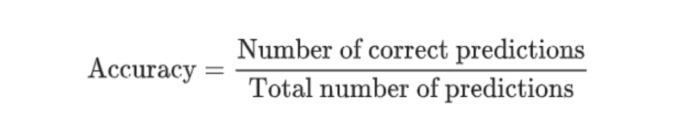
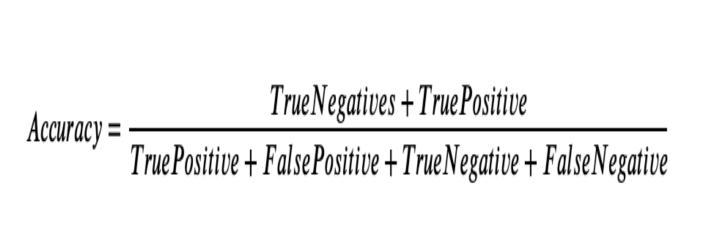
Accuracyisonemetricforevaluatingclassificationmodels. Informally, accuracy isthefractionofpredictionsourmodel gotright.Formally,accuracyhasthefollowingdefinition:
Forbinaryclassification,accuracycanalsobecalculatedin termsofpositivesandnegativesasfollows:
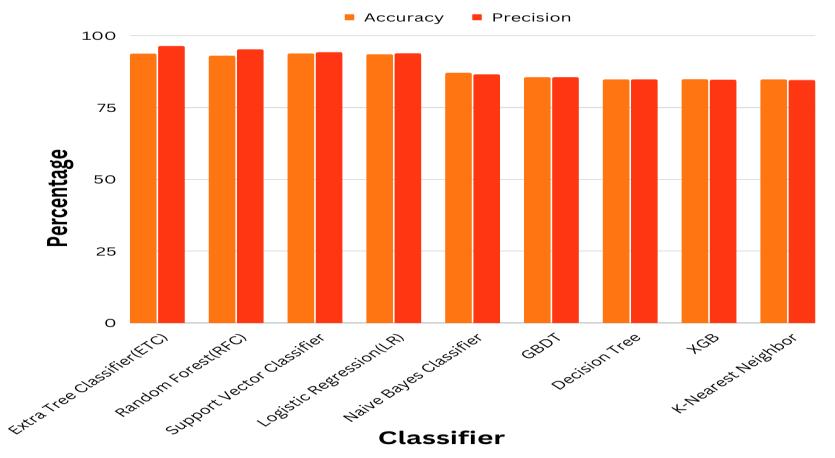
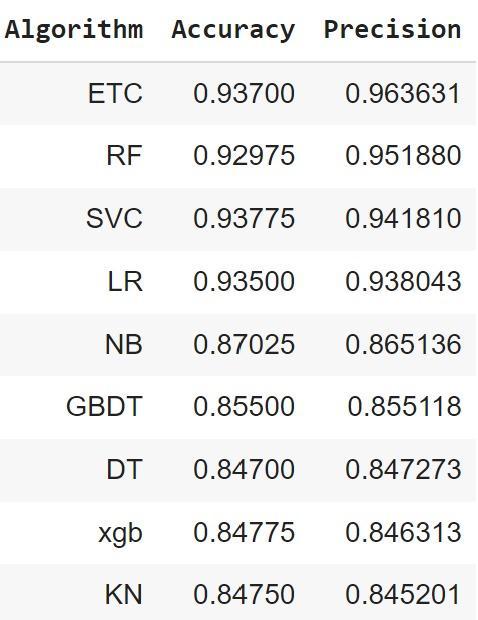
ItisclearthattheExtraTreeclassifiergivesexcellentresults. Webelievethatthisstudypavedthewayforfutureresearch oninferenceanddiscoveryofadditionalinformationbased oncausalevents,suchasdiscoveryofhiddenemotionsor causes,predictionofpublicopinionbasedoncausalevents, etc.
5. Result and Conclusion
WehaveexhibitedthecapabilityofusingTwitterasatool for measuring and detecting major depression among its users. Worked on Twitter users’ accounts for depressive behavioural exploration and detection. The data was collectedfromthesocialnetwork.Depressionwasdetected on various factors like followers, friends, post_text, post_created, post_id, favourites, requests.Sentiment analysis/Opinion Mining understands the feelings, replications as well as judgements amassed or extracted fromtextsorotherdatautilizedindataanalysisormining, web mining, and convivial media analytics because sentimentsaretojudgehumancomportment
Thensupervisedmachinelearningapproacheswereapplied tostudyeachfactortypesindependently.Theclassification techniquessuchas‘Decisiontree’,‘Randomforest’,‘Support Vector Machine’, ‘Extra tree classifier’ ,’naïve bayes’ and ’regression’ are deemed suitable for each type. The result showsthatindifferentexperimentsExtratreeclassifiergives the highest accuracy than other Machine Learning approachestofindthedepressionasshowninthefig 4.5
6. Future Work
Depressioncaninfluenceanyofusanytime.However,some phases or events make us more vulnerable to depression. Physicalandemotionalchangesassociatedwithgrowing-up, losing a loved one, beginning a family, retirement may trigger some emotional infux that could lead toward depressionforfewpeople.
Theareseveraldifferentwaystorelegatesentiments.
Asoffuturework,variousotherdatacanwithalbeutilized forthedepressiondetection.Forexample,biometricsdata, Facialexpressionsoftheuser,Speechsignalsoftheuserand EEG signals. With the social media data, these data additionallywasauxiliaryfortheanalysisofthedetection. Thecumulationofdifferentalgorithmscanadditionallybe habituated to check the precision value under different conditionsandwithdifferentdata Wecouldalsoincrease ourtrainingdatasizebyusingvarioussamplingmethods.
Alsowecouldintroducemultiplelanguagesinthefuture.
REFERENCES:
[1] A.G. Reece, A.J. Reagan, K.L. Lix, P.S. Dodds, C.M. Danforth, and E.J. Langer, “Forecasting the onset and course of mental illness with twitter data,” Scientific repobrts,vol.7,no.1,p.13006,2017
[2] PsychologicalAnalysisfor DepressionDetectionfrom Social Networking Sites. (Sonam Gupta , Lipika Goel , ArjunSingh, AjayPrasad,andMohammadAmanUllah) 6April2022
[3] Depression detection fromsocial network data using machine learning techniques (Md. Rafqul Islam, MuhammadAshadKabir,AshirAhmed,AbuRaihanM. Kamal,HuaWang4andAnwaarUlhaq)27August2018
[4] Machine Learning-Based Approach for Depression Detection in Twitter Using Content and Activity Features(HatoonS.ALSAGRI,MouradYKHLEF)24April 2020
[5] SentimentAnalysisinSocialMediaDataforDepression Detection Using Artificial Intelligence Intelligence.(Nirmal Varghese Babu,E. Grace Mary Kanaga)19November2021
BIOGRAPHIES
Amaan Khan

ThirdYearEngineering
ComputerEngineering
RajivGandhiInstituteTechnology
Jayeshkumar Kharol
ThirdYearEngineering
ComputerEngineering
RajivGandhiInstituteTechnology
Abhishek Gaikwad

ThirdYearEngineering
ComputerEngineering
RajivGandhiInstituteTechnology
Swapnil Jagtap


ThirdYearEngineering
ComputerEngineering
RajivGandhiInstituteTechnology
Prof. Suresh Mestry
AssistantProfessor
ComputerEngineering
RajivGandhiInstituteTechnology