Women’s Perceptions of Metro Rail Service Quality using Structural Equation Modelling - A Case study of Delhi and Lucknow, India
Monika Singh1, Sanjay Gupta21PhD Scholar, Dept. of Transport Planning, School of Planning & Architecture, Delhi, India

2Professor, Dept. of Transport Planning, School of Planning & Architecture, Delhi, India
Abstract - Public transport forms the backbone of meeting any city’s mobility needs. Paying extra attention to service quality in public transport can play an important role in catering to existing customers as well as attracting new transit users. Men and women tend to exhibit different behavioral tendencies in use of transportation modes such as buses and metro systems. The existing level of research carried out do not adequately answer how gender perception differs across cities with diverse geographies, systems of government, and public transport service availability. This paper is an attempt to assess which particular service characteristics distinguishes women's opinion of public transportation in across two administratively and culturally distinctcitiesinIndia.Theempirical studycarriedoutincities of Delhi and Lucknow reveals that there are significant differences in women’s mobility patterns between two cities in terms access mode, egress mode, and trip purpose. It was found that women in Delhi have a high level of concern about safety at metro stations whereas women in Lucknow placed less emphasis on metro station safety. Access time and egress time were more significant for women in Delhi while travel time and waiting time were more significant for women in Lucknow.
Key Words: Women’s Mobility, Mobility Patterns, Structural Equation Modelling, Women’s Safety, Public Transport
1. INTRODUCTION
The significant increase in the number of private vehicleshasresultedinaslewofissues,includingpollution and time and money loss. Encouragement of public transportation is proposed as a long-term option to meet travel demand while reducing the use of private vehicles. Passengerswhoaresatisfiedwithpublictransportationare more likely to continue using it; also, the public transportation system can improve its mode share by boosting passenger satisfaction. Paying extra attention to servicequalitycanplayanimportantroleinbothcateringto existingcustomersandattractingnewtransitusers[1][2].
Toassesspublic transportusers’satisfaction,thereare objectiveandsubjectivedimensionsthatareevaluatedusing performanceindicators(e.g.,reliabilityandcapacity)orby understanding users’ perceptions, respectively [3]. Public transport user survey is typically used to collect the
subjective component. The key determinant of customer happiness and an important component of any system is users’experience[1].Theusers’experiencemeasuresthegap betweenexpectedandperceivedperformance[4].Following WWII, significant changes occurred in the economic and socialrolesofwomen.Forexample,thenumberofwomen obtainingadriver’slicenseandenteringintothelabourfield has dramatically grown [5], resulting in more trips by women.Genderrolesandlifestyleshavealteredinemerging countriessuchasIndia,asindevelopedcountries.InIndia, menandwomen’srolesatworkandathomehavebecome moresimilarinrecentdecades.Menandwomenmayexhibit differentbehavioraltendenciesintransportation,astheydo inotherdisciplines[6].
Previousresearchongenderdisparitiesintransit,suchas riding behavior [7] and public transport usage [8], has focused on the effects of gender on transit. Researchers examine user variables such as gender in transportation researchandpolicymaking[9].Sincethelate1970s,genderbasedanalysishasassistedpolicymakersindevelopingmore personalized approaches to increase transit use [10]. Men and women travel differently, have different expectations, andhavedifferentperceptionsofpublictransportation[9]. Wachsemphasizedthesignificanceofgenderdifferencesin mobility [11]. Tsami and Nathanail discovered that lower fares, more frequent lines, and more trustworthy public transitareneededbywomen[1].Rojoetal.createdamodel to distinguish behavioral differences between male and female transportation consumers. They analyses gender variationsinassessmentofinterurbanbusservicequality; resultsshowthatwomenfavoursafetyontheroad,busseat comfort,andtimeliness[12].Hatamzadehetal.conducteda gender-basedinvestigationtodiscoverdifferencesinwalking behaviorinanIranianmetropolis[6][13],discoveringthat womenaremoresensitivetowalkingdistances[6].Another studyfoundthatsecurity(againstcrimeandharassment)isa significantconcernthatcaninfluencewomen'suseofpublic transportation, which is highly debated around the world [14][15].
Whilenumerousstudiesandpiecesofresearchhavebeen attempted globally on gender-based inequities within a particularstudyregion,howeververylittleefforthasbeen focused to analyse how user perception towards public transportservicequalitydiffersbetweencitieswithdiverse geographies,systemsofgovernmentandserviceavailability
in case of women. To the best of the authors' knowledge, almost insignificant research on customer satisfaction in publictransportationinadevelopingcountrylikeIndiahas been reported which emphasizes exclusively on women’s perceptionofpublictransportservicequality. Thispaperis anattempttofillthisresearchgapandanalysethewomen’s perceptionsofpublictransportservicequalityincontextof twocitiesofDelhiandLucknowwithdiversegeographies, systemsofgovernment andtransitservicequality.Inboth cities, a customer satisfaction survey format was used to interviewabout500femalepassengerswhoweretravelling. Inpublictransportsystemsuchasbusesandmetrosystems. Inordertoprioritizewomen'sserviceattributes,structural equation modelling (SEM) and importance-performance analysis(IPA)areused.
2. METHODOLOGY
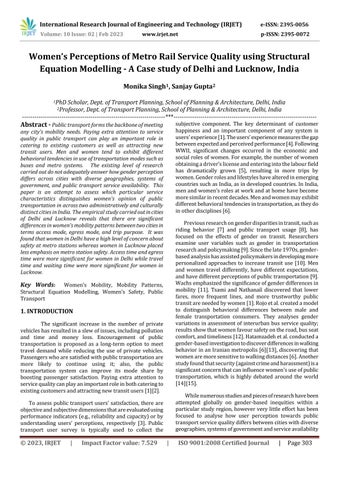
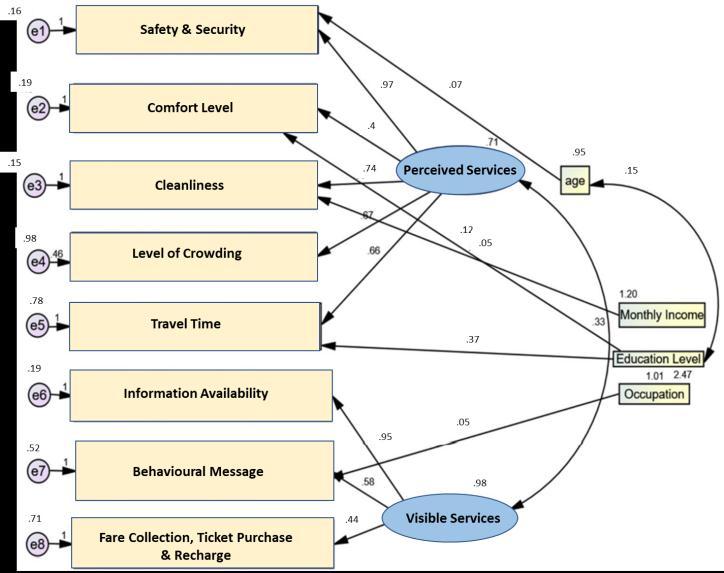
SEMtechniquehasbeenappliedtogroupthevariablesas wellastoidentifytherelationshipbetweenlatentvariables andobservedvariables. Measurementmodelisdetermined tochecktherelationbetweenlatentvariablesandobserved variables with Cronbach’s alpha co-efficient to explain the consistencyofthevariableonfactors.Estimationofmodelis donetochecktheweightedleastsquareabouteffectiveness ofthevariableonfactors.GoodnessofFitindicesischecked bymeasuringdegreeoffreedom(DF),comparativefitindices (CFI), and route mean square error of approximation (RMSEA)iscarriedouttoproceedwithcomparisonoflatent and observed variable, or else to start again with EFA to developarelationtocheckthevalidityofthemodel.Figure1 showstheSEMmodellingtechnique.
Highimportance–highperformance:Thatisoneofthe service'smainstrengths,andtheattributesassignedto thisareashouldcontinuetoperformwell.
Highimportance–lowperformance:Thisareacontains theservice'sbiggestflawsandrequiresquickattention forimprovement.
Low importance – high performance: Excessive resources have been allocated to service attributes in thisquadrantthatmaybeusedelsewhere.
Low importance – low performance: Minor flaws are located in this area and do not necessitate quick attention.
3. DATA COLLECTION & ANALYSIS
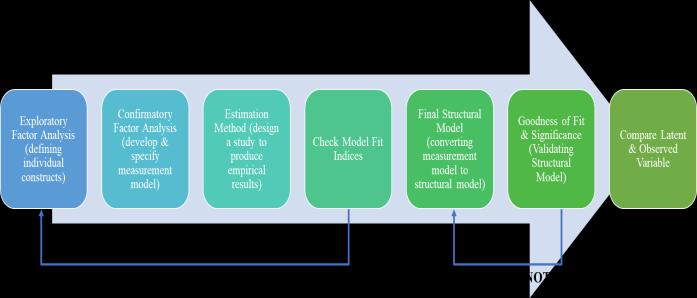
In the current study, primary surveys were conducted via personal interviews at a number of public transportation stations, with data collected via personal interviewsinthecasecitiesofDelhiandLucknow.Thegoalof thesurveywastoassesswomen'sdailytravelpatterns.The surveyincludedapproximately350samples,with56percent women in Delhi(196)and44 percent women inLucknow (154), who were interviewed in 2021 and 2022 in and at metro stations. The questionnaire is divided into three sections:1)serviceattributes,2)tripcharacteristics,and3) personalattributesRespondentsratedeachserviceattribute on a Five-point Likert scale (5 = very satisfied, 1 = very dissatisfied).Figure2depictsthedescriptivestatisticsofthe user interviewees' socio-demographic and trip characteristics. There are significant differences between Delhi and Lucknow in terms of having a driver's licence, accessmode,egressmode,andtrippurposes.Inthesample, theproportionofDelhiwomenwithoutadriver'slicencewas less than 10%, while it was more than 30% for Lucknow women. Women in Lucknow chose walking for access and egress mode more than women in Delhi, indicating that women in Lucknow walk more than women in Delhi and makemorenon-worktrips.
Fig -1:StructuralEquationModelTechnique
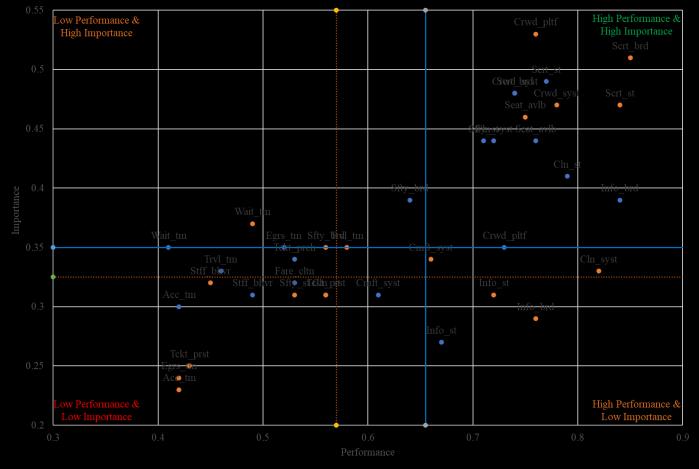
Inordertounderstandtheimportanceofeachattribute andtocategorizethemaccordingtotheirlevelofimportance as perceived by women public transport user from the survey, an IPA analysis was done to the trade-off of two components:theperformanceofprovidingaservice/product (x-axis)andtheimportanceofthatservice/product(y-axis), whichcreateacoordinatesystemandcanberepresentedin fourquadrants,eachofwhichenjoinsastrategicapproach. Quadrants are categorized according to their level of importance&performanceasfollows:
Themeanandstandarddeviationforeachattribute for women in Delhi and Lucknow is shown in Table 1. Womenweremoresatisfiedwithstationcleanliness,travel cardusage,andticketpurchaseandrecharginginbothcities, whereaswaitingtime,seatavailability,andcrowdatstations madethemlesssatisfied.
3. APPLICATION OF STRUCTURAL EQUATION MODEL (SEM)
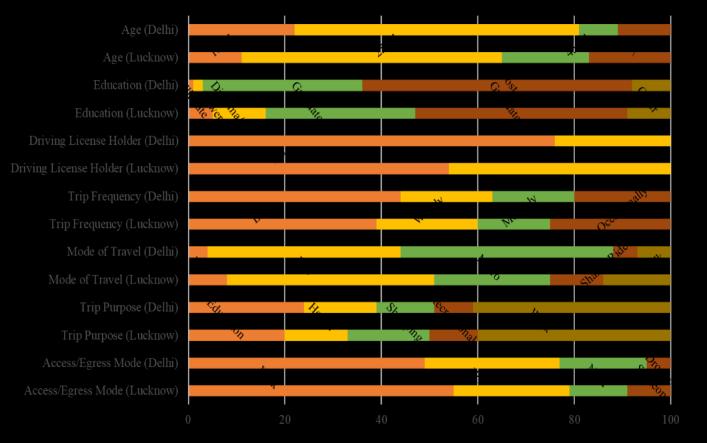
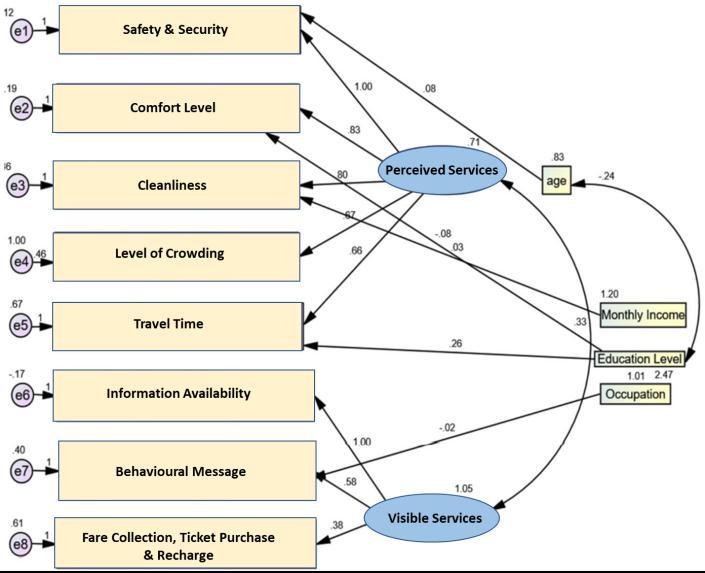
Structure Equation Modelling (SEM) technique is usedtoassesstheperceptionofwomenrelatedtoservice qualityofpublictransportsysteminboththecasecitiesof Delhi and Lucknow. As part of this technique first Exploratory Factor Analysis (EFA) was done on the data base,whichenabledidentificationofprimaryattributesto construct the Structural Equation Model and the latent variables.Cronbach'salphavaluewascheckedforreliability, anditwasfoundtobeacceptableforalltheidentifiedlatent variables. Following that, Confirmatory Factor Analysis (CFA)examinedstructurestoseeiftheloadingfactorswere greaterthan0.4(variableswithfactorloadingslessthan0.4 shouldberemovedfromthestructure)andifthecomposite reliability (CR) was greater than 0.6. CFA confirmed the following five latent variables- comfort, cleanliness, protection,servicequalityandavailabilityofinformationto bethedeterminantsforthefurtheranalysisofthesamples. To check the reliability and validity of attributes to be consideredinthemodelforboththecities,CFAwasdoneso astoapplythebasicstructuretoboththecasecitiessample separately. Itwasobservedthatthefactorloadingoffare collectionandticketpurchaseorrechargesystemforwomen inLucknowwerelessthan0.4andthuswasremoved.Other travelpatternattributesforboththecasecitiesofDelhiand Lucknowrespectivelyrangedupto0.4.Table2showsthe acceptable Composite Reliability (CR) for each latent variable. SEM was performed on both case cities to determinethederivedimportanceforeachattributeshown inFigure3&4.
From Table 2 it can be observed that attributes whichwerecategorizedundercomfortconsistingofcrowd withinthesystem,crowdatstationandcomfortwithinthe system were found to be more important for women in Lucknow.Astudyoninter-urbanbusfoundthatattributes suchasseatavailabilityandcomfortwithinthesystemfor which woman found them to be more significant (12). It wasobservedthatcrowdingattheplatformandwithinthe systemisanothersignificantattributerelatedtocomfortin transit that can affect women's perception about public transport system in present case study. Visible services include discipline and cleanliness within the system. Cleanlinessatthestationweremoresignificantforwomen publictransportusersinDelhiwhile.thisattributewasnot thatimportantforwomeninLucknow.
TheresultsshowthatwomeninDelhihaveahigh level of concern about safety at metro stations whereas, womeninLucknowplacedlessemphasisonmetrostation safetyisduetopassengerdensityatmetrostationswhich also impacts the level of surveillance and management withinthetransitsystem.Accesstimeandegresstimewere moresignificantforwomeninDelhiwhiletraveltimeand waiting time were more significant for Lucknow women. Thisstudydemonstratesthatwomenpaymoreattentionto the amount of time they spend in the metro system from entranceofstationtoexitoutofstation.WomeninDelhi,on the other hand, pay more attention to the amount of time they spend outside metro during access or egress stages. Farecollection,ticketpurchaseandrechargingsystemwere
importantattributesforwomeninDelhiascomparedtocity of Lucknow. On the other hand, ticket purchasing and rechargingwereoneofserviceattributeswithleastpriority forwomeninLucknow.Table2showsthemodelfitindices forbothmodels;CMIN/DFlessthan5andRMSEAlessthan 0.08 which indicate a good fit (90 percent confidence interval).GFI,CFI,andTLIboundby1indicatesperfectfit. ThemodelfitswellinbothcasecitiesofDelhiandLucknow.
ForwomeninDelhi,informationavailabilityistheonly attribute falling in this quadrant which has high performance but perceived with low importance by users as excessive resources have been allocated to service attributes in this quadrant that may be used elsewheretoimproveservicequalityofmetroservice.
Low importance – low performance: this quadrant comprisessafetyatstation,traveltime,staffbehavior, accesstimeandticketpurchaseandrechargeprocess while travelling placed in this quadrant for Delhi. Attributes like ticket purchase and recharge process, accessandegresstimeandstaffbehaviorareplacedin thisquadrantforwomenofLucknow.Theseattributes requiredonotneedanyattention.
3. CONCLUSIONS
Figure4(BluecolorusedforwomeninDelhiandOrange colorusedforwomeninLucknow)presentsthelocationof eachserviceattributeinIPAinordertodeterminepriority forwomeninDelhiandLucknowrespectively.
FromIPAanalysisfollowinginferencescouldbearrivedat forfourquadrants:
High importance – high performance: attributes like security at the station and within the system, crowd within the system and at the platform cleanliness onboardinformationforDelhimeaningthattheirsituation shouldbekept.Securityatstation,crowdwithinsystem and at the platform and seat availability are in this quadrant for women in Lucknow placed at highly importantfactorswithhighperformance,whichshould continuetoperformwell.
High importance – low performance: this quadrant containswaitingtime,safetyonboardandtraveltime forwomeninLucknow.Whereas,attributeslikewaiting timeandegresstimewhiletravellingforwomeninDelhi are placed in this quadrant. These attributes should improve immediately as they are placed as of higher importantfactorswithlowperformance.
Low importance – high performance: this quadrant includesotherattributeslikecomfortwithinthesystem, informationavailabilityonboardandatthestationand cleanlinesswithin thesystemfor womeninLucknow.
This research investigates the level of women public transportusersvariousservicequalityaspectswithinpublic transportsystemincasecitiesofDelhiandLucknow.Public transportsystemcomprisingofmetroandbuswaschosenin casecities.StructuralEquationModelling(SEM)waschosen todeterminehowtheimportanceofeachserviceattribute influenced women's perceptions towards usage of public transportation,andImportancePerformanceAnalysis(IPA) wasdonetodeterminewhicharetheattributesthatneedsto be focused so as to increase the public transport usage of womeninthesetwocasecities.
The findings revealed that, while there are some similarities,womenperceivethingsdifferentlyaccordingto systemavailability.Womenweremorelikelytovalueservice aspectsthatpromoteusercomfort,suchasseatavailability on board, air conditioning, and level of crowding at the stationandonboard.AccordingtoIPA,thesetraitsrequire immediateimprovementinboththecities,buthaveamore positiveandsignificanteffectonuser'sopinion.Formetro system in both the cities, the behavioural instructions and cleanliness at the station and on- board were significant. Women prioritise station safety significantly more than within transit experience. This study shows that women usingmetroandearningmorepayattentiontotimespentin themetrosystemfromentrystationtoexitstation,suchas waiting time and transit time, also women in Delhi pay attention to time spent in accessing the service, such as access or egress time. Factors in the quadrant of high importance - low performance must be addressed immediately because they affect the service quality of the metrosysteminthecasecities.Waitingandtraveltimeare the most important factors for both cities, which require immediateattentiontomeettheneedsofwomenwhousethe metrosystem.Asthisstudyisonlylimitedtometrosystems in both the case cities, hence a particular user group was coveredinthisstudywithonlyfocusonmetrosystems.
ACKNOWLEDGEMENT
ThispaperisapartoftheongoingPhDresearchbythe firstauthoratthe SchoolofPlanningandArchitectureDelhi, India. Householdsurveydata wascollectedby Authorand DepartmentofTransportPlanning,School ofPlanningand ArchitectureDelhiforacademicpurpose.
REFERENCES
[1] Tsami,M.,andE.Nathanail.Openinggroundtofemale transitmovements.Women’svs.operator’sperspective in transit quality of service. The 5th International ConferenceonWomen’sIssuesinTransportation,2014.
[2] MorpaceInternational,Inc.TCRPReport47AHandbook for Measuring Customer Satisfaction and Service Quality.1999.
[3] Mouwen,A.,andP.Rietveld.Doescompetitivetendering improvecustomersatisfactionwithpublictransport ?A casestudyfortheNetherlands.TransportationResearch PartA,vol.51,ElsevierLtd,pp.29–45,2013.
[4] Parasuraman,B.,A,Zeithaml.V.SERVQUAL:AMultipleItem Scale for measuring consumer perception of ServiceQuality.J.Retail.Greenwich,vol.VOL64,1988.
[5] McGuckin, N,. and E. Murakami. Examining TripChaining Behavior: Comparison of Travel by Men and Women.TransportationResearchRecord:Journalofthe TransportationResearchBoard,p.Vol.1693,1999.
[6] Hatamzadeh, Y., M. Habibian, and A. Khodaii. Walking modechoiceacrossgendersforpurposesofworkand shopping :AcasestudyofanIraniancity.International Journal of Sustainable Transportation, vol. 0, no. 0, Taylor&Francis,pp.1–14,2019.
[7] Useche,S.A.,L.Montoro,F. Alonso,andF.M.Tortosa. Doesgenderreallymatter ?Astructuralequationmodel toexplainriskyandpositivecyclingbehaviors.Accident AnalysisandPrevention,vol.118,no.January,Elsevier, pp.86–95,2018.
[8] Fu,X.,andZ.Juan,“Exploringthepsychosocialfactors associated with public transportation usage and examining the ‘gendered’ difference. Transportation ResearchPartA:PolicyandPractice,vol.103,Elsevier Ltd,pp.70–82,2017.
[9] Arabikhan,F,.M.N.Postorino,A.Dupont-kieffer,andA. Gegov.Gender-BasedAnalysisofZonesofTolerancefor Transit Service Quality Considering Intelligent Transportation Systems. Transportation Research Record:JournaloftheTransportationResearchBoard, No.2541,Washington,D.C.,.,no.DOI:10.3141/2541-09, pp.73–80,2016.

[10] Rosenbloom,S.TheNeedforStudyforWomen’sTravel Issues.Transport,vol.7,pp.347–350,1978.
[11] Wachs, M. The Automobile and Gender In Women’s Travel issues. Proceedings from the Second National Conference: Report FHWA-PL-97-024. FHWA, U.S. DepartmentofTransportation.,1998.
[12] Rojo,A.,M.Gonzalo,H.Orden,L.Dell’Olio,andÁ.Ibeas Portilla. Modelling gender perception of quality in interurbanbusservices.ProceedingsoftheInstitutionof CivilEngineers:Transport,vol.164(1),pp.43–53,2011.
[13] Hatamzadeh, Y,. M. Habibian, and A. Khodaii. Walking behavioracrossgendersinschooltrips,acasestudyof Rasht,Iran.J.Transp.Heal.,vol.5,pp.42–54,2017.
[14] Hsu, H.-P. How Does Fear of Sexual Harassment on Transit Affect Women’s Use of Transit?. In Women’s issues in transportation: Summary of the 4th international conference, vol. 2, no. No.46, pp. 85–94, 2011.
[15] Hough,M.AnxietyAboutCrime.Findingsfromthe1994 BritishCrimeSurvey.ResearchFindings25.U.K.Home Office Research and Statistics Department, London., 1995.
BIOGRAPHIES
MonikaSingh
PhDScholar
Dept.ofTransportPlanning
SchoolofPlanning&Architecture
Delhi
Her interest areas are urban and transport planning, urban freight andequityintransport.
Prof.Dr.SanjayGupta
Dean (Research) & Dean (Faculty Welfare)
ProfessorofTransportPlanning
Dept.ofTransportPlanning
SchoolofPlanning&Architecture
Delhi
He specializes in the areas of transport planning, public transport,freightlogistics,demand modeling and transport policy relatedaspects