Multiple disease prediction using Machine Learning Algorithms
Srinidhi B1 , T.P.Manasa21M.Tech, Dept. of Computer Science, Banglore Institute of Technology, Bengaluru, India
2Assistant Prof, Dept. of Computer Science, Banglore Institute of Technology, Bengaluru, India ***

Abstract – Many of the machine learning models for health care analysis now in use focus on just one disease at a time. Like one analysis is for diabetes, one for heart, and one for brain tumor. A single analysis cannot forecast more than one disease using a same framework. In this paper, a system that uses the Flask Application programming interface (API) to forecast numerous diseases is proposed. This paper proposed a method to examine diabetes, brain tumor, heart disease, and Alzheimer. Later, more disorders might be included, such as covid detection, fever tests, and many others. TensorFlow, Flask API, and machine learning techniques were utilized to implement numerous disease analyses. The model behavior is saved using Python pickling, and the pickle file is loaded when needed using Python unpickling. The significance of this article analysis is that all the factors that contribute to the sickness are considered while analyzing it, making it possible to identify the disease's full range of potential impacts. For instance, many of the existing systems for analyzing diabetes considered a few parameters such as age, sex, BMI, and insulin. But in our proposed system we have considered additional factors like number of pregnancies, Glucose concentration, skin thickness, heart rate/pulse rate, and diabetes pedigree which makes our model more efficient compared to existing model.
The final model's behavior will be recorded in a pickle file in Python and the Flask API will be created. The parameters of the disease must be sent together with the disease name when using this API. The relevant model will be called by the Flask API, which then returns the patient's state. The significance of this study is to examine the most diseases possible to keep track of patients' conditions and forewarn them when necessary to reduce the death rate.
Keywords Machine Learning, Flask API, Convolutional Neural Network, XG-Boost
I. INTRODUCTION
Healthcare is increasingly adopting the artificial intelligence(AI)technologiesthatarepervasiveinmodern business and daily life. Artificial intelligence in healthcare has the potential toaid providers in many areas of patient careandoperationalproceduresenablingthemtobuildon current solutions and solve problems more quickly. The
majority of AI and healthcare technologies are highly relevanttothehealthcareindustry,yethospitalsandother healthcare organizations may employ quite different strategies. Precision medicine is the most widely used use of conventional machine learning in the field of artificial intelligenceinhealthcare.Itisa bigstepforward formany healthcare organizations to be able to forecast which treatment approaches would be most effective with patients based on their characteristics and the treatment framework.
And even though some articles on the use of artificial intelligenceinhealthcaresuggestthatitcanperformjustas well as or better than humans at certain procedures, like diagnosingdisease,itwillbeaconsiderableamountoftime beforeAIinhealthcarereplaceshumansforawiderangeof medical tasks. Machine learning and precision medicine applications, which make up the majority of AI in healthcare,requiredatafortrainingwithknownoutcomes. Wecallthissupervisedlearning.
Manyanalysesofthehealthcareindustry'scurrentsystems only took one ailment at a time. For instance, articles are used to analyze diabetes, to analyze brain tumor, and to forecast heart disease. Most articles concentrate on a specific disease. Any institution that wishes to analyze the health reports of its patients must usea variety of models. The method used in the current system is helpful for studying only a certain ailment. Today's mortality has grown as a result of the failure to accurately diagnose diseases.Evenafterbeingtreatedforonedisease,apatient may still be afflicted with another. When analyzing the disease, several current methods employed a limited number of parameters. Because of this, it might not be feasibletopinpointthediseasesthatwill bebroughtonby the disease's effects. For instance, diabetes increases the risk of developing dementia, hearing loss, retinopathy, neuropathy, and heart disease. The analysis of diabetes, brain tumor, heart disease, and Alzheimer data sets were takenintoconsiderationinthispaper.Inthefuture,several other diseases may be added, such as skin conditions, diseases linked to fever, and many more. This adaptable analysis later encompassed several disorders for examination.
The model file associated with the analysis of the new disease must be added by the developer when adding any newdiseaseanalysistothisAPI.Thedevelopermustsetup Pythonpickingtostoremodelbehaviorwhencreatingnew diseases.Thedevelopercanloadapickledfiletoobtainthe
model behavior while utilizing this Flask API. Whena user wishes to analyze a patient's health, they may either forecast a specific disease or, if the report contains factors that are used to predict other diseases, this analysis will provide the most appropriate disease identifications. By forewarning patients depending on their health circumstances, this article aims to stop the mortality ratio from rising day by day. The cost of patient analysis canbe decreased since there are several diseases models and forecastsmadeatonelocation.
The section I explains the Introduction of multiple disease prediction using machine learning. Section II presents the literature review of existing systems and Section III present proposedsystemarchitecture andimplementation details Section IV presents results and discussion of proposed system. Section V concludes our proposed system. While at the end list of references paper are presented
II. LITRATURE SURVEY
M. Chen suggested [1] a novel Convolutional neural network (CNN) based multimodal disease risk prediction method based on hospital structured and unstructured data. M. Chen, Y. Hao, K. Hwang, L. Wang, and L. Wang developeda diseasepredictionsystemformanylocations. They predicted the onset of three diseases: diabetes, cerebralinfraction,andheartdisease.Diseasepredictionis based on structured data. Prediction of heart disease, diabetes, and cerebral infraction is done using several machinelearningalgorithmssuchas naivebayes,decision tree, and K-Nearest Neighbor (KNN) algorithm. The Decision tree method outperforms the Naive Bayes and KNN algorithms. They also indicate whether a patient wouldsufferfromahighriskofcerebralinfarctionoralow risk of cerebral infarction. They used CNN-based multi model disease risk prediction using text data to estimate the risk of cerebral infraction. The accuracy of CNN-based unimodal disease risk predictions (UDRP) is compared to CNN-based multi model disease risk prediction system. With a quicker speed than a CNN-based unimodal disease risk prediction algorithm, disease prediction accuracy can reach 94.8%. The CNN-based multi model disease risk predictionalgorithmprocessesareidenticaltothoseofthe CNN-UDRP method, apart from two extra testing phases. Thisresearchfocusesonbothstructuredandunstructured data datasets. The writer works with unstructured data. Previous work was exclusively based on structured data, and none of the authors dealt with unstructured or semistructureddata.However,thispaperisdependentonboth structuredandunstructureddata.
B.Qian,X.Wang,N.Cao,H.Li,andY.-G.Jiang[2]createdan Alzheimer disease risk prediction system using patient electronic health record (EHR) data. They used an active learning setting to address a real-world problem for the patient. This is where the active patient risk model was
created. The risk of Alzheimer's disease is used in the activeriskpredictionmethod.
Wearable 2.0 isa method presented by IM.Chen, Y. Ma,Y. Li,D.Wu,Y.Zhang,andC.Youn[3]thatinvolvesdesigning washable smart clothing that enhances the quality of experience and quality of service of the next-generation healthcare system. New IoT-based data collecting system was created by Chen. newly developed smart washable clothwithsensors.Thedoctorusedthisclothtorecordthe patient's physiological state. Further analysis is done with theaidofthephysiologicaldata.Themajorcomponentsof this washable smart cloth include several sensors, cables, andelectrodes.Usingtheseparts,ausercangatherdataon the patient's physiological state as well as their emotional health status using a cloud-based system. It was able to capturethepatient'sphysiologicalstatewiththeaidofthis fabric. And this data is used for the analysis. They discussed the difficulties encountered when creating the wearable 2.0 architecture. The gathering of physiological data, detrimental psychological impacts, opposition to wireless body area networking, and sustainable massive physiologicaldatacollectionareamongtheproblemswith the current technology. the many activities carried out on files, such as data analysis, monitoring, and prediction. Once more, the author divides the functional elements of wearable 2.0 smart clothing into the following groups: sensorsintegration,electricalcable-basednetworking,and digitalmodules.Numerousapplicationsarecoveredinthis, including the monitoring of chronic diseases, the care of theaged,andthemanagementofemotions.
Acloud-basedhealthCyber-PhysicalSystems(CPS)system thatmaintainstheenormousvolumeofbiologicaldatawas createdbyY.Zhang,M.Qiu,C.-W.Tsai,M.M.Hassan,andA. Alamri[4].Y.Zhangspokeonthemedicalindustry'srapid rise in data volume. The issue with large data is that information is produced quickly and has a tendency to be stored in many formats. The health-CPS system was created using two technologies, with big data technology cominginsecond.Datacollecting,dataadministration,and data-oriented layers are the three levels that the system takes into account. The layer that collected the data did it inacertainstandardformat.thelayerofdatamanagement utilized for parallel computing and distributed storage. With the aid of the health-cps system, several procedures are carried out by this system. Moreover, this system is awareofvarioushealthcarerelatedservices.
AtelehealthsystemwaspresentedbyL.Qiu,K.Gai,andM. Qiu in [5], along with a discussion on how to manage a significantvolumeofhospitaldatainthecloud.Theauthor of this research recommended improvements to the telehealth system, which are largely focused on the cloudbased data exchange amongst all telehealth providers. However, there are other problems with cloud data sharing,includingnetworkbandwidthandvirtualmachine
switching. For improved data sharing using data sharing ideas, a cloud-based solution to data sharing is recommended in this. Here, the ideal telehealth sharing modelhasbeendeveloped.Withtheuseofthismodel,the author focuses on temporal restrictions, network capabilities, and transmission probability. For this, the author created a brand-new, ideal method for exchanging massivedata.Usersareprovidedwiththebestmethodfor processingbiologicaldatabythisalgorithm.
The best clinical decision-making approach was proposed by Ajinkya Kunjir, Harshal Sawant, and Nuzhat F. Shaikh [6]andusespatienthistory toforecast disease.Numerous diseases and an unanticipated pattern of patient state are predicted in this. created a top-notch clinical decisionmaking tool that is utilized for precise disease prediction based on historical data. The notion of many diseases and anunknownpatternwerealsodeterminedinit.Piecharts and 2D/3D graphs were utilized in this for visualization purposes.
A comparison of several machine learning techniques, including fuzzy logic, fuzzy neural networks, and decision trees,isprovidedbyS.LeoniSharmila,C.Dharuman,and P. Venkatesanintheirarticle[7].Theyusetheliverdatasetto categorizeandconductcomparativeresearch.Accordingto a research, Fuzzy Neutral Network performs 91% more accurately than other machine learning algorithms in classifyingliverdiseasedatasets.Authorisskilledatdoing classification extremely well and providing very good performances.AuthoremployedSimplifiedFuzzyARTMAP inavarietyofapplicationareas.
The author has concluded that on the supplied data set, machine learning techniques like Naive Bayes and Apriori [8] are very helpful for disease detection. Here, smallvolume data, such as symptoms or prior information gleaned from the physical diagnostic, are employed for prediction. Thispaper'slimitationsinclude the inability to considerenormousdatasets.Additionally,becausemedical dataisincreasingtoday,itisdifficulttoidentifyit.
A CNN- multimodal disease risk predictions MDRP techniquewasputupbyShraddhaSubhashShirsath[9]to forecast diseases based on a sizable amount of structured and unstructured hospital data. Using a machine learning algorithm (Naive- Bayes), CNN-MDRP focuses on both structured and unstructured data, increasing disease prediction accuracy and speed compared to CNN-UDRP, whichonlyanalysesstructureddata.Bigdataisconsidered here.
AnewmethodbuiltontheArtificialneuralnetwork(ANN) algorithm was developed for the prediction of heart disease [10]. The researchers developed a categorizationbased interactive prediction approach employing an artificial neural network algorithm and accounting for the thirteen most crucial clinical factors. Healthcare professionals can benefit greatly from the recommended
strategy,whichhadanaccuracyrateof80%whenitcame topredictingheartdisease.
To predict heart disease, the fuzzy method with a membershipfunctionwasapplied[11].Theauthorssought to remove ambiguity and uncertainty from the data by using the Fuzzy KNN Classifier. The 25 classes and 22 elements in each class were created from the 550-record dataset. The dataset was divided into training and testing halves of equal size. Following the use of pre-processing methods, the fuzzy KNN methodology was applied. Accuracy, precision, and recall were only a few of the assessment variables used to evaluate this method. The results revealed that the fuzzy KNN classifier performed betterthantheKNNclassifierintermsofaccuracy.
To assess a big picture collection, Yang et al. [12] presented the CBIR (Content-Based Image Retrieval) approach. This approach looks for a tumor with the same pathological characteristics by using the tumor area as a query.ThefeatureemployedbythesystemwascalledMID (Margin Information Descriptor). By a tumor's surrounding tissue, it clarifies the image's meaning. Their suggested approach was successful in achieving 89.3% accuracy. However, because their approaches derive a globally linear distance measure, they provide many local predictions for various locations. Additionally, the manual segmentation of the brain tumor was used in the developmentoftheirmethod.
Supportvectormachines(SVM)withtheadaptivityfeature wereusedtoidentifybreastcanceranddiabetes[13].The objective was to provide an automatic, quick, and flexible diagnosticapproachutilizingadaptiveSVM.Thebiasvalue in traditional SVM was modified to provide better results. If-then rules were generated as output from the proposed classifier. Breast cancer and diabetes were both successfully diagnosed using the suggested procedure, which had a 100% accuracy rate for both diagnoses. The developmentofmoreeffectivestrategiesformodifyingthe biasvalueintraditional SVMshouldbe the focus offuture research.
III. SYSTEM DESIGN
A. Proposed System
It is feasible to forecast numerous diseases at once using multiple disease prediction. Therefore, the user does not havetovisitseveralsitestoanticipatetheailments.Weare focusing on the disorders of the heart, brain tumor, Alzheimer, and diabetes. because there is a correlation between the three disorders. We'll employ machine learning methods and Flask-API to create numerous disease analyses. The user must submit both the disease name and its parameters when requesting access to this API. Flask will call the relevant model and deliver the patient'sstatus.
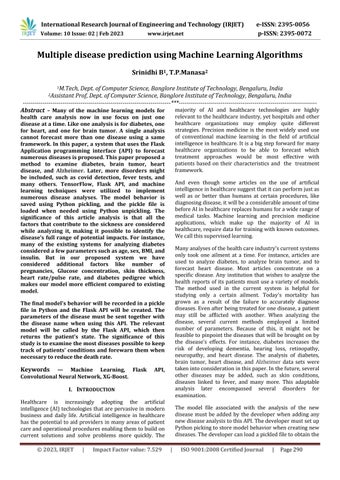
B. Architecture Overview
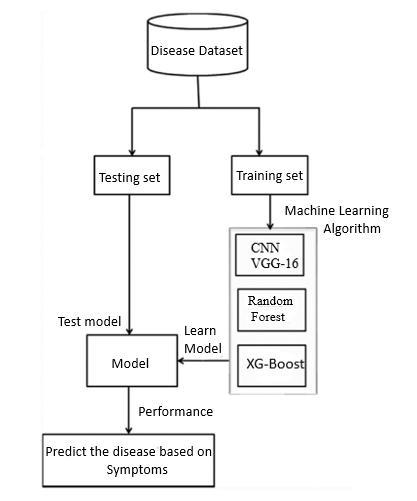
Fig3.1;SystemArchitecture
We conducted experiments on four diseases heart, diabetes, brain tumor and Alzheimer The first step is to import the UCI dataset, PIMA dataset, and Indian liver dataset, respectively, for the datasets for heart disease, diabetes disease, and liver disease. After the dataset has been loaded, each inputted piece of data is shown. After pre-processing the data for visualization, which involves lookingforoutliers,missingvalues,andscalingthedataset, thedataisdividedintotrainingandtesting.Next,weused the CNN, XG-Boost, and random forest algorithms on the training dataset before applying what we learned about the classification method to the testing dataset. We will select the algorithm with the highest accuracy for each ailment after applying our expertise. Then, we created a picklefileforeachailment andcombinedit withthe Flask frameworktoprovidethemodel'soutputonthewebsite
C. Algorithms
CNN Algorithm
Step 1: The dataset is first transformed into a vector format.
Step 2: Following that, word embedding was completed, using zero values to fill in the data. Word embedding producesaconvolutionallayerasitsresult.
Step3:Weconductthemaximumpoolingoperationonthe convolutionallayeraftertakingitasaninputtothepooling layer.
Step4:Convertthedataset intoafixed-lengthvectorform for Max pooling. The entire connected neural network is coupledtothepoolinglayer.
Step 5: The classifier, a SoftMax classifier, is linked to the completeconnectionlayer.
XG-Boost Algorithm
TheXG-Boostalgorithmoperatesasfollows:
Step1:Creatingasingleleaftreeisthefirststep.
Step 2: After computing the average of the target variable as prediction for the first tree, we must determine the residuals using the specified loss function. The residuals for future trees are then derived from the predictionfrom thefirsttree.
Step3:Usingtheformulatodeterminethesimilarityscore.
Step 4: Using the similarity score, we choose the correct node.Morehomogeneityisseenwhenthesimilarityscore isgreater.
Step5:Thefifthstepinvolvesapplyingthesimilarityscore tothe informationacquired. Informationgain revealshow much homogeneity is obtained by dividing the node at a specific place and helps to distinguish between old and newsimilarities.Theformulausedtocomputeitis:
InformationGain=LS+RS–SimilarityforRoots
WhereLS=LeftSimilarity&RS=RightSimilarity
Step6:Usingthetechnique,youmaypruneandregularize the tree to the appropriate length by adjusting the regularizationhyperparameter.
Step 7: Using the Decision Tree you created, we can then forecasttheresidualvalues.
Step8:Thelearningrateisusedtocalculatethenewsetof residuals.
NewResidual=OldResidual+δ∑PredictedResidual
Step 9: Next, go back to step 1 and carry out step 1 again foreachtree.
Random Forest Algorithm
A random forest may be constructed by merging N decisiontrees,andthenitcanbeusedtomakepredictions foreachtreethatwasproducedinthefirststep.
Therandomforestoperatesasfollows:
Step-1: First, it will choose K data points at random from thetrainingset.
Step 2: After choosing k data points, create decision trees linkedtothechosendatapoints(Subsets).
Step3: Afterthat, pick the Nthnode for the decision trees youwishtoconstruct.
Step-4:Repeatsteps1and2instep4.
Step-5: Finding each decision tree's predictions and allocating the fresh data points to the category with the mostsupportisstepfive.
VGG-16 Algorithm
Step 1: The 16 in VGG16 stands for 16 weighted layers. Thirteen convolutional layers, five Max Pooling layers, three Dense layers, and a total of 21 layers make up VGG16, although only sixteen of them are weight layers, alsoknownaslearnableparameterslayers.
Step2:TheinputtensorsizeforVGG16is224,244andhas threeRGBchannels.
Step 3: The most distinctive feature of VGG16 is that it prioritized convolution layers of a 3x3 filter with stride 1 rather than many hyper-parameters and consistently employed the same padding and maxpool layer of a 2x2 filterwithstride2.
Step 4: Throughout the whole design, the convolution and maxpoollayersareuniformlyordered.
Step5:Thereare64filtersintheConv-1Layer,128filters in Conv-2, 256 filters in Conv-3, and 512 filters in Conv-4 andConv-5.
Step6:Astackofconvolutionallayersisfollowedbythree Fully Connected (FC) layers, the third of which conducts 1000-way ILSVRC classification and has 1000 channels. The first two FC layers have 4096 channels each (one for eachclass).Thesoft-maxlayeristhelastone.
To conclude with, the CNN algorithm, the xg-boost algorithm, and the random forest algorithm were utilized in the system prediction model since they each provided the highest levels of accuracy. When the patient adds the disease-specific parameter, it will indicate whether the
patient has the ailment in question. The parameters will display the necessary value range, and if the value is outside of that range, is invalid, or is empty, a warning message will appear, advising the user to input a proper value.
IV. RESULTS AND DISCUSSION
A. Experimental Setup
All the experimental cases are developed in Python in a congested environment using Anaconda tools. The competing classification approach and various feature extraction techniques are also used, and the system is configured withanIntel Corei5-6200U processor running at2.30GHzand8GBofRAM.
B. Dataset
The disease dataset are downloaded from Github, kaagle andotherMLwebsite.Andasperindustrystandardstrain set and test are prepared. By using Scikit learn train, test, splitmethodtosplitthedataas70%fortrainingand30% fortestingaredivided.
ExampleofDiabeticDisease:
Diabetesfeaturetrain,diabetesfeaturetest,
Diabetes label train, diabetes label test=train test split (diabetes features, diabetes label, test size=0.3, train size=0.7)
C. Evaluation Methods
For the experiment's performance assessment. First, we identify True Positive (TP), False Positive (FP), True Negative (TN), and False Negative (FN). True positive refers to the number of cases successfully forecasted as necessary, false positive refers to the number of instances mistakenlypredictedasrequired,andsoon.Thefollowing arethefourmeasurementsthatmaybeobtained:accuracy, precision,recall,andF1-measure.
Accuracy=(TP+TN)/(TP+TN+FP+FN)
Precision=TP/(TP+FP)
Recall=TP/(TP+FN)
F1Score=TN/(TN+FP)
D. Result
When the patient adds the disease-specific parameter, it will indicate whether the patient has the ailment in question. The parameters will display the necessary value range,andifthevalueisoutsideofthatrange,isinvalid,or isempty,awarningmessagewillappear,advisingtheuser toinputapropervalue.
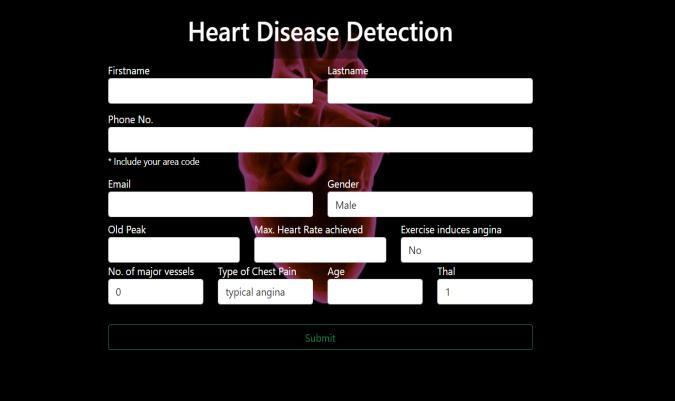
When the Flask API is created. The front end can devour themodel.Itwillbeconfirmedbycreatingatestwebpage, hereheartdiseaseinputscreenisshownasanexamplein Fig 4.1. Once the user hits "Submit Button," whether the patienthasheartdiseaseornotwillbereturned.
understanding the degree of disease risk prediction, we were able to produce an accurate general disease risk prediction. Because of this technique, disease and risk prediction may be accomplished with little effort and expense. We compare the outcomes of the different algorithms in terms of accuracy and processing time. The accuracy of the CNN algorithm is higher than that of the other machine learning algorithm, and CNN's processing time is lower than that of others. So, in terms of accuracy and timing, CNN is superior to other machine learning algorithm
In the future, we'll include more diseases and forecast the likelihoodthatapatientwoulddevelopeachone.
ACKNOWLEDGMENT
Fig4.1:HeartDiseaseInputScreen
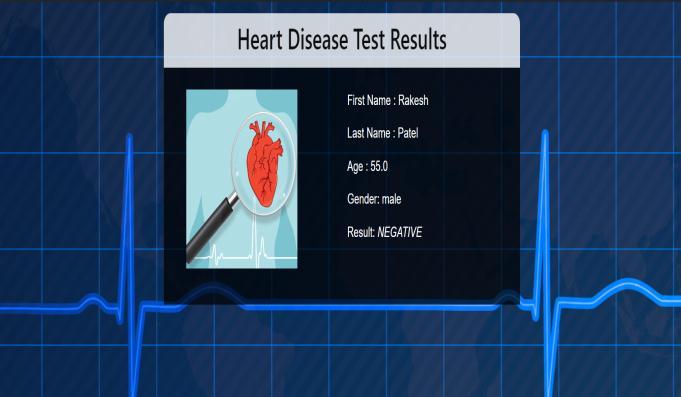
The results of the heart disease prediction are shown in Figure 4.2 Once the user has finished filling out the form and clicked "Submit." When the relevant model has been loaded,theuserwillseetheresultofheartillness.
We would like to express our gratitude to our college, BangaloreInstituteofTechnology,forprovidinguswiththe means to prepare a project on the subject of "Multiple DiseasePredictionSystemUsingMachineLearning,"aswell asto our principal, Dr.M.U.Aswath, forprovidingus with the time and resources to do the necessary research. SincerethanksgoouttoDr.J.Girija,HeadoftheComputer Science Department, and Assistant Professor T.P. Manasa for their assistance during our study, which would have been challenging without their inspiration, persistent support, and insightful suggestions. Furthermore, without the cooperation, advice, and assistance of our friends and family, the complexity of this study article would not have beenachievable.
REFERENCES
[1] M. Chen, Y. Hao, K. Hwang, L. Wang and L. Wang, "Disease Prediction by Machine Learning Over Big Data From Healthcare Communities," in IEEE Access, vol. 5, pp. 8869-8879, 2017, doi: 10.1109/ACCESS.2017.2694446.
Fig4.2:OutputofpatientStatus
In this way, Multiple diseases can be predicted simultaneously using a multi-disease prediction model. Here,adiseasepredictionismadebasedonuserinput.The userwillbeofferedtheoption.Arelateddiseasemodelwill beactivatedandpredictedbasedontheuser'sgiveninputs if they wish to forecast a specific disease or if they don't enter any disease types. The benefit of using a multidiseasepredictionmodelinadvanceisthatitcanestimate the likelihood that numerous diseases will manifest themselveswhilealsoloweringthemortalityrate.
V. CONCLUSION
We used standard machine learning algorithms to categorizepatientdatasince,inthemodernmedicalworld, medical data is expanding greatly and must be processed toprovideprecisediseasepredictionsbasedonsymptoms. By providing the input of patient records, which aid in
[2] Qian,Buyue&Wang,Xiang&Cao,Nan&Li,Hongfei& Jiang, Yu-Gang. (2014). A relative similarity based method for interactive patient risk prediction. Data Mining and Knowledge Discovery. 29. 10.1007/s10618-014-0379-5.
[3] M. Chen, Y. Ma, Y. Li, D. Wu, Y. Zhang and C. -H. Youn, "Wearable 2.0: Enabling Human-Cloud Integration in Next Generation Healthcare Systems," in IEEE Communications Magazine, vol. 55, no. 1, pp. 54-61, January2017,doi:10.1109/MCOM.2017.1600410CM.
[4] Y. Zhang, M. Qiu, C. -W. Tsai, M. M. Hassan and A. Alamri, "Health-CPS: Healthcare Cyber-Physical System Assisted by Cloud and Big Data," in IEEE Systems Journal,vol.11, no.1,pp.88-95,March2017, doi:10.1109/JSYST.2015.2460747.
[5] Gai, K., Qiu, M., Sun, X.et al.Smart data deduplication for telehealth systems in heterogeneous cloud
computing.J. Commun. Inf. Netw. 1, 93–104 (2016). https://doi.org/10.1007/BF03391583.
[6] Kunjir, Ajinkya & Sawant, Harshal & Shaikh, Nuzhat. (2017).Dataminingandvisualizationforpredictionof multiple diseases in healthcare. 329-334. 10.1109/ICBDACI.2017.8070858.
[7] Sharmila, Leoni. (2022). A Comparative Study of Neural Network and Fuzzy Neural Network for Classification.Volume10.1371-78.
[8] Sarker, I.H.MachineLearning:Algorithms,Real-World Applications and Research Directions.SN COMPUT. SCI. 2, 160 (2021). https://doi.org/10.1007/s42979021-00592-x.
[9] S, Vinitha & S, Sweetlin & Vinusha, H.M. & S, Sajini. (2018). Disease Prediction Using Machine Learning Over Big Data. Computer Science & Engineering: An International Journal.8. 01-08. 10.5121/cseij.2018.8101.
[10] Mrs. K. Uma Maheswari, Ms. J. Jasmine, 2017, Neural NetworkbasedHeartDiseasePrediction,International journal of engineering research & Technology (IJERT) RTICCT
2017(Volume5
Issue17),
[11] Krishnaiah, V. & Narsimha, G. & Chandra, N.. (2015). Heart Disease Prediction System Using Data Mining Technique by Fuzzy K-NN Approach. Advances in Intelligent Systems and Computing. 337. 371-384. 10.1007/978-3-319-13728-5_42.
[12] Xiaoqing Li, Jiansheng Yang, Jinwen Ma,Recent developments of content-based image retrieval (CBIR),Neurocomputing,Volume 452,2021,Pages 675689,ISSN,https://doi.org/10.1016/j.neucom.2020.07.1 39
[13] Gürbüz, Emre & Kilic, Erdal. (2013). A new adaptive support vector machine for diagnosis of diseases. ExpertSystems.31.10.1111/exsy.12051.
[14] S.Narayanan,N.M.Balamurugan,M.KandP.B. Palas, "Leveraging Machine Learning Methods for Multiple Disease Prediction using Python ML Libraries and Flask API," 2022 International Conference on Applied Artificial Intelligence and Computing (ICAAIC), Salem, India, 2022, pp. 694-701, doi: 10.1109/ICAAIC53929.2022.9792807.
[15] V. Sharma, S. Yadav and M. Gupta, "Heart Disease Prediction using Machine Learning Techniques," 2020 2nd International Conference on Advances in Computing, Communication Control and Networking (ICACCCN), Greater Noida, India, 2020, pp. 177-181, doi:10.1109/ICACCCN51052.2020.9362842.