Bioindicators in Heavy Metal Detection
1Student, Department of Biotechnology, School of Bio Sciences and Technology, Vellore Institute of Technology, Vellore, Tamil Nadu, India***
Abstract - Heavy metals pose a threat to plant and humanlife,becauseoftheirtoxicity,bioaccumulation,and non-biodegradability. Metal contaminants have two significanteffects:pollutionoftheenvironmentandhealth concerns.Theuse ofbioindicatorsasobservationdevices to monitor natural pollution with hazardous metals has grown in popularity. To measure the build-up of heavy metals, bioindicators, such as flora and animals, are collectedandevaluated.Toscreendangerousmetalsfrom air, water, soil, and other sources, different living creatures from the five kingdoms – Monera, Protista, Fungi,Plantae,Animalia – areused.Theyshouldbeableto concentratethepollutantintheirtissuestoalevelthatis higher than the permissible limit for the surrounding environment. Here, we are surveying bioindicators and biological impacts of 11 heavy metals-Copper (Cu), Mercury(Hg),Chromium(Cr),Manganese(Mn),Cadmium (Cd), Lead(Pb), Zinc (Zn), Iron(Fe), Arsenic (As), Cobalt (Co)andNickel(Ni).
Key Words: Heavy metal detection, bio accumulation bioindicators, pollution, environment, heavy metal toxicity, harmful effects, bioremediation, biological impact.
1.INTRODUCTION
Living creatures such as plants, planktons, animals, and bacteria are used as bioindicators to monitor the health of the natural ecosystem in the environment [1]. The worldwide increase in environmental pollutants requires new and optimized methods of detection and control. Heavy metals are one form of hazardous industrial contaminant that can have long-term consequencesforecosystemsandspecies.
Detecting environmental contamination with biological material as indicators is a low-cost, dependable, and straightforward alternative to traditional sampling approaches. Several organisms such as green algae, arthropods, lichens, and hydrophytes have been successfullyusedtodetectheavymetalsfromindustries.
Effective and reliable bioindicators of heavy metal pollution should react with the contaminant in a quantitative manner such that the measured strength of the biomarker response is proportionate to the amount of pollutant present. They should be easy to test and should accumulate the contaminant in their tissues to a

much greater concentration than the surrounding environment. Lastly, they should be able to distinguish between excess synthetic compounds and natural ecological stresses and also measure potentially toxic substances[1].
The advantages associated with the use of bioindicators arethattheyareusefulinquicklyascertainingbiological impacts, both on the environment and on specific organisms, abundantly prevalent and easy to utilise as well as much cheaper alternative to specialized measuringsystems[2].
This review classifies bioindicators based on the heavy metals they accumulate and detect. Each metal contains examples of bioindicator organisms belonging to different kingdoms and ecosystems from around the world. Many of them can detect multiple heavy metals. Finally, these bioindicators have been compared to ascertain their suitability under different conditions. Thus, this review covers a wide variety of bioindicators andmentionsthebioindicationprocessestakingplacein theseorganismsundervariedenvironmentalconditions.
2.BIOINDICATORS OF COMMON HEAVY METAL POLLUTANTS
2.1 Bioindicators of Copper
Compounds containing copper (Cu) metal have been widely used in the agricultural fields and systems in the form of ingredients of fertilizers and fungicides [3] and has thus resulted in the accumulation of the metal in soils. This accumulation of copper results in the generation of various types of stresses posing on the environment which leads to display of specific injury symptoms or shifts in the community composition in various communities of organisms [4]. Research has found that certain organisms can be used as a bioindicator to detect the levels of copper in the environmentinwhichtheyarefound.
In a metal smelting plant in the Plateau state of Bukuru, study have found that mango plant can be efficiently used as a bioindicator for detecting copper metal (27µg/g)[5].ThestudyatUsmanuDanfodiyoUniversity, Sokoto revealed that the concentration of copper metal (30.41 µg/g) was higher close to the road than away from the road edges in Acacia nilotica [6]. Arthropods
such as spider and Rambur’s forktail found in Legnica, Western Poland and Hawr Al Azim wetlands, respectively,confirmedthatthesmelterspresentintheir areas indicated high air pollution and high copper (112.45 µg/g) and lead concentrations in the environment [7] respectively. In Cairo, Egypt, it was observedthatthefungi Aspergillusflavus,inthepresence ofcoppermetal(32.1µg/g)coulddecolourizethetextile wastewater[8].InthePointLomokelpforest,SanDiego, studies have found that giant kelp by bioaccumulating copper (100 µg/g) and zinc from the water column can respond to heavy rainfall and storm events resulting to whichthetissueconcentrationofthesemetalsincreases [9].
Table1denotesthecommonlyusedbioindicatorsfound in the different parts of the world for the detection of copper metal. From the bioaccumulation values for various bioindicators as seen in table 2, it can be concluded that among animals, arthropods are good bioindicators of copper while among plants giant kelp can be very useful to detect surrounding copper concentrationinµg/g.
Table-1: Commonlyusedbioindicatorsforcopper detection
Plants
Mango (Mangifera indica)
Plateau state [5]
GumArabicTree (Acacia nitolica) UDU, Sokota [19]
Spider (Agelena labyrinthica)
Rambur’s forktail (Ischnura ramburii)
Mediterranean greencrab (Carcinus aestuari)
Legnica, western Poland [20]
HawrAl Azim wetlands. [21]
Narta Lagoon, Albania [22]
Fungi Aspergillus flavus Cairo, Egypt [8]
Algae GiantKelp (Macrocystis pyrifera)
Parasite Spinyheaded worm (Acanthocephala ns)
PointLoma kelpforest [23]
Antarctica [24]
Niletilapia (Oreochromis niloticus)
Nakivubo wetland, Uganda [25]
Huaiquil (Micropogonias manni) LakeBudi, Chile [26]
Table-2: Bioaccumulationlevelsofcopperindifferent organisms
2.2. Bioindicators of Mercury
Mercury (Hg) metal was found from the natural sources which include emissions from the geothermal and volcanic activity. It is also formed due to anthropogenic sources wherein the largest source is the combustion of coal and other fossil fuels including forest fires, waste disposal, metal, and cement production etc. [10]. MeHg poisoning have been observed in humans in various parts of the world [11]. Thus, mercury and its compounds can lead to harmful effects and present potential hazards to the environment even at very low concentrations.
Arthropod Ligiaitalica, found in the supralittoral zones of the Sicilian ecotones is observed to be a good bioindicator for detection of mercury pollution [12]. It was carried out in one of the most industrialized and affected region in Poland (Upper Silesia), which was a continuation of an investigation already going on the metal accumulationinthenativeand transplanted moss Pleuroziumschreberi [13,14]. Waterbirds were useful as bioindicators of wetland heavy metal pollution, especially mercury since their presence in the environment influenced the survival and reproduction rate in them [15]. Selectivity of the heavy metal cations by algae Cladophora sp. was observed in various competitive adsorption studies. In the Acid Mine Drainage (AMD) waters, algae were found to be capable ofbeingagoodbioindicatorofthemercurymetalaswell as it is suitable for its removal [16]. Trace metal concentration of mercury in Patella caerulea was investigated to provide information on the pollution of theIonianSea(MediterraneanSea-Italy)[17].According
to various research studies, it is concluded that the carnivorous (piscivorous) fishes are the most common bioindicator for the detection of mercury metal accumulation in the environment. Earthworms can also be used as a viable alternative bioindicator for the detection of mercury due to its ability to accumulate heavy metals from the polluted salts and other media [18].
Table3denotesthecommonly usedbioindicatorsfound in the different parts of the world for the detection of mercurymetal.
Table-3: Commonlyusedbioindicatorsformercury detection
Category Bioindicator
Location of Study References
Arthropod a RockLice (Ligia italica) Sicilian ecotone [12]
Moss
Redstemmed feathermoss (Pleurozium schreberi)
Poland (Upper Silesia) [28]
research on marine bivalve (Ruditapes decussates) specimens show that metallothionein (MT) synthesis responds to modest changes in metal concentrations [35].
Another study carried out in Cerastoderma glaucum showed significant fluctuations in the MTLP concentrations [36]. Among 12 common species of hydrophytes chosen, roots and shoots of Mentha aquatica was found to be the most promising single indicatorofthepollutionofheavymetalslikeNi,Cdand Cr.
This study carried out in water-scarce and budgetlimited countries like Lebanon has various ethnobotanical uses [37]. Medicago sativa cultivated in variousheavymetalconcentrationsdisplayedreductions in chlorophyll content, increased liquid peroxidation, increased glutathione reductase activity. The plant development slowed dramatically as the metal concentrationsgrew[38].
Birds
Mollusca
Waterbirds Wetlands [29] Penguin (Spheniscidae sp)
Algae Greenalgae (Cladophorasp)
Mediterranean Limpet (Patella caerulea)
Kerguelen Islands, southern IndianOcean [30]
AcidMine Drainage (AMD) waters,South Africa
[31]
Mediterranea narea [17]
Annelids ManureWorm (Eisenia foetida) Cachoeirado piriá,Brazil [18]
Red-eyed piranha (Serrasalmus rhombeus) TapajósRiver
Due to their high cation exchange capacity and long deciduousperiods,mossesareusefulplantsforscanning heavy metal deposition according to a study conducted inSerbia[39].
Barley seeds grown in varying levels of cadmium displayed a lower root growth at higher levels of metal concentration [40]. The sea urchin embryo (Paracentrotus lividus) is a major invertebrate that has been used as a bioindicator of heavy metal contamination and a model organism in developmental biologythroughalteredlevelsofHSP70.Anotherspecies of sea urchin, (Anthocidaris crassispina), is also an important model to study cadmium induced stress. Reduced sperm motility and fertilization and increased eggsizecanbeobservedathighcadmiumlevels[41].
Fish
Europeanperch (Perca fluviatilis)
Commonroach (Rutilus rutilus)
Reptiles Watersnakes (Nerodia taxispilota)
PluszneLake, Poland [32]
Savannah River,United States [33]
2.3 Bioindicators of Cadmium
Cadmium (Cd) is a heavy metal that is becoming increasingly prevalent in our environment as a result of industrial production and usage [34]. The findings of
Flying foxes (Pteropus poliocephalus) can also serve as potential bioindicators for environmental metal exposure through tissue, urine, and fur samples. Specimen samples collected from the Sydney basin, Australia,wereusedtodeterminecadmium,arsenic,and variousothertracemetals[42].
Table 4 showcases the findings from research aimed at examining the correlation between the bioaccumulation of cadmium in organisms and the levels of cadmium in theirsurroundings.
Table-4: Commonlyusedbioindicatorsforcadmium detection
Lagooncockle (Cerastoderma glaucum) GulfofGabès, Tunisia [50,36]
Fish Acanthocephala ns
Baíaand Paranárivers, Brazil [51]
Lamiaceae Watermint (Mentha aquatica) Lebanon [37]
Fabaceae Alfalfa (Medicago sativa) Not Mentioned [38]
Bryophyta Brachythecium sp.,Hypnum moss(Hypnum cupressiforme),
Obrenovac (Serbia) [39]
regularly used to predict environmental risk. The freshwater snail (Pomacea canaliculate) selectively accumulates metal contaminants at high levels in the kidney, and symbiotic corpuscles. In arsenic-exposed apple snails, preferential accumulations in the digestive gland were 9 and 276 times larger than in nonexposed snails [44]. Ant colonies belonging to different microhabitats may have diverse responses to environmental effects because they are exposed to different habitat conditions and resource availability [45].
Echinoder mata
CommonSea Urchin (Paracentrotus lividus)
PurpleSea Urchin (Anthocidaris crassispina)
Mediterranea nSeaand eastern Atlantic Ocean.
[41]
Tropicaland subtropical coastal waters [41]
Arthropod a
Antlion (Myrmeleontidae )
NearLocal Steel Factories [52]
Aquatic bryophytes have also been used to study the heavymetalcontaminationofcertainareas.Theamount of arsenic in the biotope is reflected in the amount of arsenic in the investigated aquatic bryophytes. Water analyses are less reliable than these plants in determining the presence of arsenic [46]. Some plants canactasbioindicators withrespect to their absorption spectrum. A study on Vallisneria gigantean and Azolla filiculoides showed an increase in absorption in the 400 to 500 nm region. There was an additional increase in the 530 nm region for Azollafiliculoides. As a protective reaction to arsenic activity, this shows an increase in flavonoid production [47]. The basis of another study was the nodule bacteria of the genus TrifoliumL. genus as bioindicators. Lower clover nodule bacteria colonies were formed in soil that had a higher metal concentration[48].
Chordata
Greyheaded flyingfox (Pteropus poliocephalus) andBlack headedflyingfox (Pteropus alecto)
Sydneybasin, Australia [42]
Magnolio phyta Seedlingsof Barley (Hordeum vulgare) InLaboratory Experiment [40]
Nematoda
Parasitic Roundworm Larvae (Hysterothylaciu m sp.)
2.4 Bioindicators of Arsenic
SeaofOman [53]
Arsenic(As)isrecognisedtobetoxicto bothplantsand mammalsduetoitsaffinity forprotein,lipids,andother biological components. Specimens of testate lobose amoeba collected from 59 lakes in Canada displayed various assemblages. The specific spatial pattern obtained suggests the presence of industrially derived arsenic[43].
Because they are at low trophic levels and act as the trophic web's entrance doorway, molluscs have been
Blood and excrement samples from birds are used to detect internal metal concentrations. Clear relationships betweenAs,Cd,andPbwereobservedinliverandblood. Thisprovedthatbloodcanbeusedasabeneficialtoolto determineheavymetalconcentrations[49].Thefindings of investigations that sought to establish the connection between the bioaccumulation of arsenic in various organisms and the arsenic concentrations in their environmentaredemonstratedinTable5.
Table-5: Commonlyusedbioindicatorsforarsenic detection
Category Bioindicators Location of Study References
Amoeba
Arthropoda
Testatelobose amoebae (Lacustrine arcellinina)
Arborealand epigaeicants
Yellowknife, Northwest Territories, Canada [43]
NovaLima, MinasGerais, Brasil [45]
Bryophyta
Aquaticbryophytelike PaleLiverwort (Chiloscyphus pallescens)
[46]
Pteridophyta
Mollusc
Birds
Fabaceae
Brachythecium sp., Hypnummoss (Hypnum cupressiforme), SilvergreenBryum moss(Bryum argenteum)
Eelgrass (Vallisneria gigantean)and WaterFern(Azolla filiculoides)
Obrenovac (Serbia) [54]
LatinAmerica [47]
Channeledapple snailorgolden applesnail (Pomacea canaliculata) Laboratory [44]
Migratorybirds likeEuropeanpied flycatcher (Ficedula hypoleuca)
Nodulebacteriaof redclover (Trifolium praténse),Alsike clover(Trifolium hibridum),
2.5 Bioindicators of Zinc
SaharanAfrica orUK [49]
North Caucasus Research Instituteof the Vladikavkaz Scientific Centerofthe Russian Academyof Sciences.
Metal compounds are researched in green algae (Ulva rigida), mussels (Mytilusgalloprovincialis), and molluscs (Tapes philippinarum), three species found in marine biological systems. The elements under consideration areHg,Cu,Pb,As,Zn,Ni,andCr.Zincexhibitsastandard deviation of 6% [55]. Concentrations of persistent organochlorines (OCs) such as polychlorinated biphenyl (PCBs), dichloro diphenyl trichloroethane (DDTs), chlordanes(CHLs),andHCHsfoundintheliverofbluefin fish (Thunnus thynnus) are gathered. The amounts of PCBs, DDT, and CHL in bluefin fish increased considerablywithbodylength(30–190cm).
TherewasasignificanceofdietaryintakeofPCBs,DDTs, and CHLs in comparison to gill entry. The straight relapseconditionobtainedfromtheplotoffixationsand body length was used to determine the Body-Length Standardized Qualities (BLNV) of PCBs, DDTs, and CHLs fixationsinbluefinfish.
suggest that bluefin tuna is a suitable bioindicator for assessing OC pollution in the wild ocean biological system[56].
ICP-MS (Inductively Coupled Plasma-Mass Spectrometry)wasusedtoanalyseheavymetalfixations in ocean water and accumulation in the tissues of Haliclona tenuiramosa. Sponges living near the shore amassed more concentrations of heavy metals ranging from 2 to multiple times higher fixation than that observedfurtherawayfromtheshore.
The fixation levels in water and bioaccumulation in tissueswasobservedincertainfish.Thecurrentfindings suggested that a more complete examination of the concentration of heavy metals in Haliclonatenuiramosa from the surroundings is required to aid in a better resolutionoftheproblem[57].
Algae,bivalves,Cnidaria,Nematoda,amphipoda,andfish aresomeofthebioindicatorsusedtodetectzinc(Zn)as denotedintable6.
Table-6: Commonlyusedbioindicatorsforzinc detection
[48]
Algae Tropicalwaters
GreenAlgae,Sea lettuce (Ulva lactuca), Brown algae(Lobophora variegate)
Bivalves Coastof ArabianGulf ofMauritania
Venusverrucos, Bluemussel (Mytilus edulis), Crassostrea gigas, Crassostrea virginica, Crassostrea corteziensis,
[55]
Cnidaria
WaterColumn Sessile Estuarine Sediments
Jellyfish (Aurelia aurita), Snakeslocks, Anemone (Anemona viridis), Starletsea anemone (Nematostella vectensis).
Turbot (Scophthalmus maximus), Gilt-head (sea)bream(Sparus aurata), Trachus trachus, American alligator(Alligator mississippiensis). International Research Journal of Engineering and Technology (IRJET) e-ISSN: 2395-0056
The BLNV demonstrated the current condition of PCB, DDT, and CHL contamination in water. These findings
International Research Journal of Engineering and Technology (IRJET) e-ISSN: 2395-0056
Amphipoda Mediterranean coast,marine andestuarine
sediments
Corophium volutator, Echinogammarus pirloti, Gammarus salinus, Artemia salina, Ostracoda cypris sp., Cyprideis torosa, Leptocythere psammophila,
Niletilapia (Oreochromis niloticus), Red Mullet (Mullus barbatus), Brown Comber (Serranus hepatus),
2.6 Bioindicators for Lead
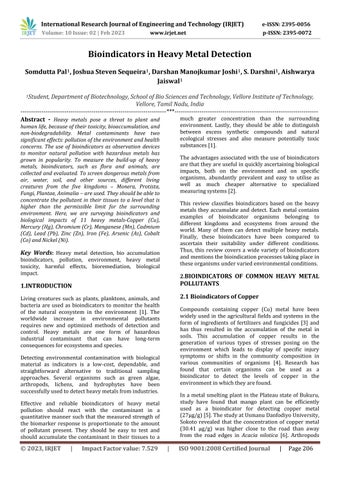
Sunflowers, lichens, trees, birds, honeybees, aquatic animals, insects, and annelids are some of the bioindicators utilised in lead (Pb) detection as mentioned in table 7. Insects can be used as natural bioindicators of contamination. One of the most adaptable and effective bioindicators is honeybees. Deformations in hatchlings from a few genera in the Chironomidae family (e.g., Procladius, Chironomus, and Cryptochironomus) have been seen in numerous studies, and the results show that the anomalies are strongly linked to dirty silt. Honeybees, on the whole, have a better lattice for detecting metal contamination than honey.Thehigheramountsofeachofthethreemetalsin honeybees in rural areas may indicate that these metals are diffused in the air and do not seep into or store on the natural parts visited by honeybees, implying that they are not ingested. Thus, it was concluded that honeybees can be used to detect metal pollution. Live honeybees are better than dead honeybees at detecting [58]. Gerridae are used to find varied iron and manganese concentrations, however it appears that it is less appropriate for nickel and lead collection [59]. Wasps are used for lead biomonitoring since their bulk larval excrement can accumulate to many times the size oftheadultbody.
Metal accumulation in plants can also be influenced by soil particles. Ficus leaves have the potential to screen for heavy metal contamination in urban areas. Lead fixations in Ficus leaves remained fundamentally higher across the polluted areas. Vehicles are the principal sourceofleadpollutioninplants,asseenbythepositive linkbetweenleadfixationandthickness[60].
Chart 1 denotes the bioaccumulation levels of Lead and Zincindifferentorganismsmeasuredinµg/g.Thegraph shows a comparative analysis using the same bioindicator for both the metals Lead and Zinc. It is inferred that the bioaccumulation has been the greater for Zinc in all the 5 cases It is seen that the maximum
bioaccumulation happened in Corallina officinalis/tafsoutwithahighestinZinc.Aminimumhas occurredin Ulvalactuca/Ouledsalehforlead.
Chart-1: ComparisonofbioaccumulationlevelsinLead andZincinvariousspecies.[68]
Category Environment Bioindicator References
Flowers Landterrain Sunflower (Helianthus) [64]
Lichens FogBelts Scriptlichen (Graphis scripta) [65]
Trees Landyterrain Sacredfig (Ficus religiosa) [60]
Birds UrbanTerrain Housesparrows (Passer domesticus) [66]
Honeybees Mediterranean area
Westernhoneybee (Apis mellifera L), Italianbee (Apis mellifera ligustica spinola),
[58]
Aquatic Animals Marine Starfish (Asteroidea) [67]
Insects Forestterrain Warps (Polistes) [59]
Annelida Sediments, Coasts
ArenicolaMarina (Hediste diversicolor) Hediste diversicolor
2.7 Bioindicators of Chromium
[61]
Cr (III). Chromium interferes with several metabolic processes, modifies the activities of antioxidants and enzymes like ribonuclease and causes oxidative damage to biomolecules. It is also toxic to plants and results in reduced growth, foliar chlorosis, stunting, and plant mortality[69,70].ExposuretoCr(VI)hasbeenrelatedto nasal mucosa damage, allergic contact dermatitis, renal, gastrointestinal, and cardiovascular effects, haematological effects, and liver necrosis. The Cr (III) valence states are also reactive and soluble, causing damagetoDNA,proteins,andlipids[71].
Theusualpracticeofbioindicationistotestthecollected samples of biomass for chromium ions. In an early statistical evaluation, a dozen common hydrophytes werecomparedfromtwodifferentlocationsintheBekaa valley, Lebanon. The concept of bioconcentration factor (BCF) served as a numerical bioindicator. After a period of 21 days, 9 out of 12 plants showed a chromium accumulation suitable for use as bioindicators [37]. A recentexperimentwascarriedoutbyPerilloetal.[72]to determine the amounts of chromium and other heavy metals in the hair of Holstein dairy cows. The main advantage of this method is that it is bloodless and simple to obtain hair samples and analyse them. All six examined herds showed a similar concentration of chromium except one which had almost double. This revealed that excess fertilizers were being used in the province of Ragusa, Italy which may have been subsequentlyreduced[72].
The hydrophytes in table 8 were also found to be suitable bioindicators for chromium. Leaf or stem samples were extracted and tested for chromium ions. These hydrophytes exhibited all required properties of bioindicators and some also displayed linear relationshipsbetweentheforthepresenceofchromium ions with high positive correlation coefficients between chromium accumulation and the amount present in the soilsandenvironment.
Table-8: CommonlyusedbioindicatorsforChromium detection
2.8 Bioindicators of Manganese
Manganese (Mn) is an essential micromineral for both plantsandanimals.Ithasvariousfunctionssuchasbeing an important part of the enzymatic systems while also beinginvolvedinthesynthesisofvitaminB1andinsulin. ItisalsoacriticalelectrontransporterinphotosystemII. Exposure to Mn (II), Mn (III), or Mn (IV) ions has been shown in animals and people to have negative neurological consequences. Manganese poisoning can cause manganism, a long-term neurological condition characterised by tremors, difficulty walking, and facial muscle spasms. It has also been associated with Parkinson’sdiseaseandothercognitivedisorders[73].
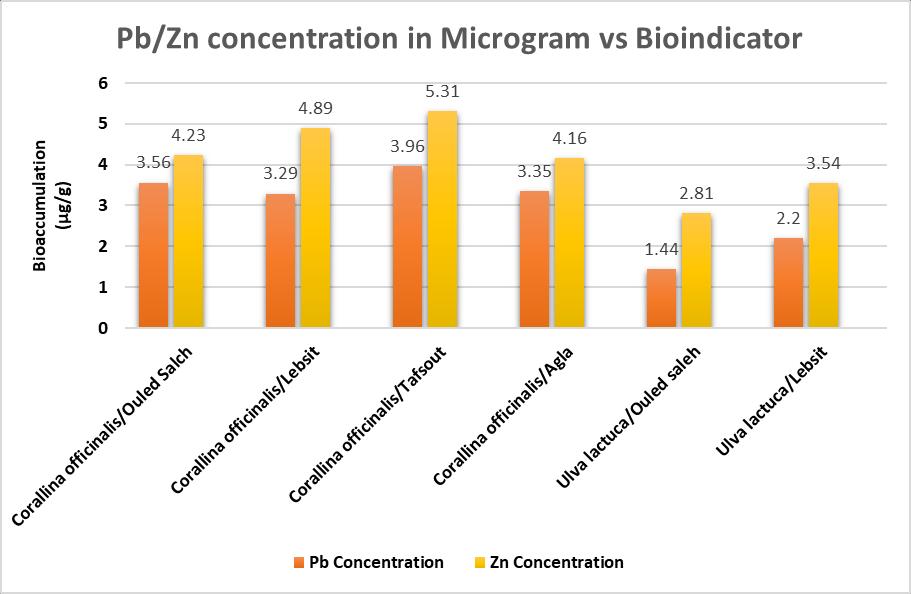
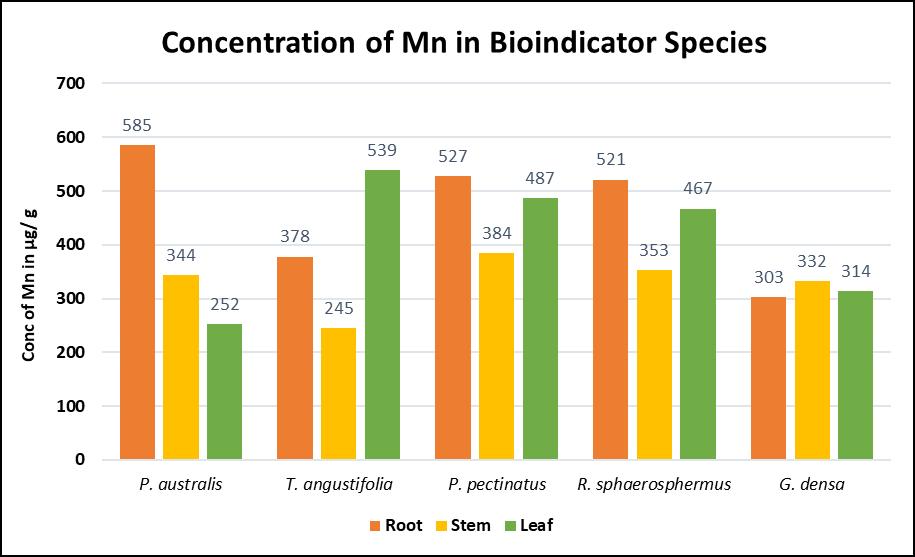
In a study which observed the seasonal variations of manganese in the environment, Catsiki et al. [56] made use of Mytilus galloprovincialis, as an estuarine bioindicator near the Thermaikos gulf in Greece. Seasonal variations in Manganese were lowest during the summer season and highest at the start of spring. It was concluded that mussels bioaccumulate less during warm periods than during the winter based on their reproductivecycles[56].InanotherstudybyDemirezen et al. [74] five aquatic hydrophytic species Phragmites australis, Ranunculus sphaerosphermus, Typha angustifolia, Potamogeton pectinatus, and Groenlandia densa werefoundtobesuitableindicatorsofmanganese contamination after being tested for relations between theirindicatorvalueandactualdegreeofcontamination.
Table9illustratestheresultsofstudiestodeterminethe relationbetweenthebioaccumulationofmanganeseina variety of organisms and the actual concentrations of manganese in their environment. The dual properties of high bioaccumulation along with a linear relation betweenmetalconcentrationintheplantandthesoilas illustratedinchart2.These make Typhaangustifolia the most suitable bioindicator while Groenlandia densa can alsobeusedduetoitslinearbioaccumulation.
Table-9: CommonlyusedbioindicatorsforManganese detection
Algae
Antithamnion cruciatum BlackSea coastof Samsunin Turkey [79]
Corallina panizzoi
Insects
Waterstriders (Gerris argentatus) Ironandsteel factory [52]
Dragonflylarvae (Odonata)
Plants Paperflower (Bougainvillea glabra)
Industrial Zone [80]
Residential Zone
International Research Journal of Engineering and Technology
(IRJET) e-ISSN:
thesepotentialbioindicatorsarefoundasshownintable 11.
Table-10: CommonlyusedbioindicatorsforIron detection Category
References
Plants
2.9 Bioindicators of Iron
Iron (Fe) is a heavy metal which is necessary for the propergrowthofthoseorganisms.Incertainregionsdue tothepresenceoffactories,especiallysteelfactoriesand coal minestheironcontentinthesoilandsurroundings increase above safety levels which becomes detrimental for organisms living in such environments. The iron content in the environment needs to be detected and certainorganismswhichliveinsuchenvironmentcanbe used as bioindicators. Experiments conducted in different places across the globe has led to discovery of manysuchbioindicators.
Ina Brazil pelletizingfactorytwoplantsSurinamcherry (Eugeniauniflora) and Clusiahilariana showed necrosis, chlorosis,purplespotsonleaves[81].IntheThermaikos Gulf, Greece, neptune grass (Cymodocea nodosa) iron contentinleaveswasanalysedbyMaleaandHaritonidis [82]. In Africa, African catfish (Clariasgariepinus) show suppressed growth, high concentration of malondialdehyde in liver [83]. In Australia, mussels show reduction in responsiveness to ambient iron concentration changes [84,85]. In Malaysia, clams show hemochromatosis as an indication of iron accumulation [86].InRSAandCIchannel,ArgentinaChineseHatSnail (Bostrycapulus odites) show thicker shells with microstructure malformations due to excess iron accumulation [87]. In Iran, reaction of honeybees to changesinenvironmentalironcontentisdepictedinthe ironlevelsintheirbodies[88].
Table 10 shows the bioaccumulation values in different organismsunderstudyinatabularform.Fromthistable we can infer which bioindicator is most effective. Since Clarius gariepinus shows a maximum of 6000 µg/g it is the most effective bioindicator out of the lot. The effectiveness of the bioindicator is proportional to its bioaccumulation capability. Finally, the bioaccumulation levelsalsogiveabriefidea abouttheironcontentinthe environment cross different parts of the world where
SurinamCherry (Eugenia uniflora) Brazil-pelletizing factory [81]
Clusia hilariana Brazil-pelletizing factory
NeptuneGrass (Cymodocea nodosa)
Seawaterandin sedimentfrom theThermaikos Gulf(Greece) [82]
Fishes
Bivalves (Oysters, molluscs)
African catfish (Clarias gariepinus)
Floodplain Mussel(Velesunio ambiguous)
SydneyRock Oyster (Saccostrea glomerata)
Mangroveclam (Polymesoda expansa)
Chinesehatsnail (Bostrycapulus odites)
Insects Honeybee (Apis mellifera)
Aquatic ecosystemsof AfricaandMiddle East. [83]
RiverMurray, SouthAustralia [85]
SeaPortsofNew South-Wales (NSW),Australia [84]
Aquatichabitatof KualaKemaman, Terengganu, Malaysia [86]
RíaSanAntonio channel(RSA) andCanaldel Indiochannel (CI),Argentina
Markazi Province,Iran: varyingdegrees ofanthropogenic impact
[87]
[88]
Table-11: Bioaccumulationlevelsofironindifferent organisms
Species Bioaccumulation (µg/g) References
Eugenia uniflora 895 [81]
Clusia hilariana 596
Cymodocea nodosa 2466 [82]
Clarias gariepinus 6000 [83]
Earthworms
Earthorm (Hyperiodrilus africanus)
2.10 Bioindicators of Cobalt and Nickel
Cobalt (Co) and nickel (Ni) are trace elements that are requiredintraceamountsbyplantsandanimalstogrow normally. The MPA (Maximal Permissible Addition) of cobalt in soil is 24 µg/g while that of nickel is 2.6 µg/g [89]. Mosses (Bryum argenteum, Bryum capillare) are employed in Serbia as cobalt bioindicators using atomic absorbancespectrophotometerprinciple[39].InNigeria earthworms (Hyperiodrilus africanus) are used as bioindicators as they show changes in alimentary tract [90]. Plants like Gum Arabic tree (Acacia nilotica) are also used in Nigeria for bioindication where tree barks areanalysedbyAAS[19].
Freshwater silver catfish (Chryshchythys nigrogitatus) are used in Nigeria as cobalt accumulation in liver and gills can be detected by AAS [91]. In Santos Bay, Brazil, Madamango sea catfish (Cathorops spixii) show altered growthrate,reproductivephases,cellularmutationsand even death due to cobalt accumulation [92]. Hydrophytes are used as bioindicators of Nickel in Mediterranean region by inductively coupled plasma mass spectrometry analysis of roots and shoots [37]. In Baghdad,molluscs(Bellamyabengalensis,Physellaacuta) are used as bioindicators as Ni accumulation affects growth,feeding, reproduction, physiological activityand maturity [93]. In estuaries of Australia, microalgae (Catenella nipae) epiphytes grow on aerial roots of mangroves as bioindicator of Ni [94]. In Egypt, Bougainvillea glabra is used since Ni accumulation causes increase in flavonoid and phenolic content analysedby AAS [80]. In Serbia, Pygmy iris(Irispumila) was found to have a considerable block effect on nickel concentrationinitsleaves[95].Table12givesaninsight on the potential indicators of nickel and cobalt found in differentregionsoftheworld.
Table-12: CommonlyusedbioindicatorsforCobaltand Nickeldetection
Category Bioindicator Environment
Cobalt Mosses
Silvergreen byrummoss (Bryum argenteum), Bryummoss (Bryum capillare)
References
Countyof Obrenovac (Serbia) [39]
Plants
Lafarge,WAPCO CementFactory, Ewekoro, Nigeria [90]
Fish
Hydrophytes
GumArabic Tree(Acacia nilotica)
Fresh-water silvercatfish (Chryshchythys nigrogitatus)
Madamangosea catfish (Cathorops spixii)
Nickel
Nasturtium officinale, Cardamine uliginosa, Mentha longifolia, M. aquatica, M. sylvestris
Usmanu Danfodiyo University, Sokoto-Nigeria [19]
CrossRiver, south-eastern partofNigeria [91]
SantosBay, Brazil [92]
Aquatic ecosystemin Mediterranean (Lebanon) [37]
Molluscs
Freshwatersnail (Bellamya bengalensis), Bladdersnail (Physella acuta)
Algae Nipaepalm (Catenella nipae)
Paper flower (Bougainvillea glabra)
Plants
Tigrisriver, Baghdad [93]
Estuariesinthe vicinityof Sydney, Australia. [94]
SadatCity, WesternNile Delta,Egypt [80]
Pygmyiris (Iris pumila) Belgrade,Serbia [95]
3. COMPARATIVE STUDY OF BIOINDICATOR ORGANISMS
3.1 Plants
Organisms like micro and macroalgae, lichens, mosses, tree bark, fungi and leaves of higher plants have shown to detect the accumulation, deposition of metal and distribution of the metal pollution in water, soil and air. This accumulation and distribution of metal pollution depends upon the levels of the metals in the soil, water and air, the element species and the bioavailability, pH, vegetationperiod,cationexchangecapacityandmultiple otherfactors.
Somealgaelike Macrocystispyrifera, Cladophorasp.,Ulva lactuca, Lobophora variegate, Antithamnion cruciatum, Catenellanipae areusedasstandardbioindicatorswhich represent the primary producers. For instance, the presence of algae Fucusvesiculosus is observed to show heavy metal pollution in marine environment whereas thepresenceof Klebsormidium dominatedalgalmatsare foundtobegoodindicatorsofhighconcentrationofiron inwater.
Mosses such as Pleuroziumschreberi,Bryumargenteum, Bryum capillare are useful plants for scanning heavy metal deposition.Theycanaccumulatelargeamountsof heavymetalswithoutanysignificantdamageduetotheir deciduous periods and their high cation exchange capacity.
Higher plants have also been used as bioindicators in areas with significant amount of pollution in the detection of heavy metals like Cd, Zn, Pb, As, Cu, Hg etc. Inhigherplants,distributionofheavymetalsisfoundto be unequal with the maximum found to be in the tree bark. After the tree bark, heavy metals are accumulated intheroots,thenleavesandfinallyinthefruits.
Hydrophytes are used as bioindicators of nickel in Mediterranean region as nickel gets accumulated in roots and shoots. They are also very useful for monitoring environmental pollution at the interface between aquatic and terrestrial ecosystems which is where heavy metals such as chromium from industries usuallyendsup.
3.2 Terrestrial Animals
Different categories of animals have been used as bioindicatorsbasedoncertaincharacteristicstheyshow in response to accumulation of heavy metals in their systems. Most commonly found bioindicators include insects,earthworms,birdsandevenhigheranimals.
Insects like spiders, bees, ants, wraps and flies are used for bioindication of different heavy metals like Cu, Hg, Cd, As, Zn, Pb, Mn and Fe. Heavy metal accumulation in their systems change their responsiveness and growth and the bioaccumulation can be analyzed using analyticalmethods.
Different types of worms like roundworms and earthwormsare alsousedasbioindicators astheyshow changes in their alimentary tract and responsiveness to environmentalchangeonaccumulationofmetalslikeHg, Cd,Zn,andCo.
Birdslikesparrows,waterbirds,flycatchersarealsoused as bioindicators as they show detrimental effects in growthandreproduction onaccumulationofHg,Asand Pb.
Chordates like flying fox (Pteropus poliocephalus and Pteropus alecto) are also used for bioindication of cadmium. Blood proved to be an indispensable test sample for determination of heavy metal concentration. Cows were also used for bioindication of Cr and some otherheavymetalsbasedonassessmentofhairsamples.
3.3 Aquatic animals
Intheaquaticenvironmentdifferentvarietiesfisheslike piranha, mullets, combers, huaiquils, perchs, roaches, catfishes and acanthocephalans are used for bioindication as metals like Hg, Cd, Zn, Fe and Co get accumulated in liver and gills and can be analyzed to obtainlevelsofthosemetals.
Other aquatic animals like water snakes, crabs, snails, starfishes, limpets, shellfishes, sea urchins, bivalves, amphipods,oysters,mussels,jellyfish,seaanemonesare also used for bioindication of Hg, Cd, As, Zn, Fe and Ni. They show changes in their shells, larval development, growth and other physiological factors which can be usedforindication.
Heavy metal deposition in aquatic creatures around a gold mining location in Thailand is shown in one case study. Three different fish species Rasbora torneiri, Brachydanio albolineata and Systomus rubripinnis accumulate metals like Fe, Zn, Cr, Mn, Ni, As etc. This bioaccumulation level in turn provides for the bioindicationinthesefishes[96].
Another case study in the Gulfs of Oman and Persian demonstrated the use of marine species such as ghost shrimps, barnacles, polychaetes, and bivalves for the bioindication of metals such as Pb and Cd. The bioaccumulation levels in these animals made them applicable for further monitoring programs that could helpdetecttheleveloftheseheavymetalpollutions[97].
3.4 Microorganisms
AmoebaisusedasabioindicatorforArsenicasdifferent concentrations leads to formation of assemblages which can be studied to determine levels of arsenic in the environment.
Cyanobacteria like Oscillatoria tenuis and Phormedium bohneri are used as bioindicators of chromium and the bioaccumulation levels were determined. Thus, we observe each category has a wide variety of organisms which can be used as bioindicators in their natural habitat.
Responses of certain microorganisms to heavy metal pollution make them ecologically significant. Certain bacteria show resistance to heavy metals and this property is due to resistant genes in their plasmids. Thus,theycanserveasusefulbioindicators[98].
4.DISCUSSION
All of the research in the last few decades has been focused on finding bioindicators such as microbes, plants, and animals that collect harmful metals. Bioindicators are useful for defining natural environment characteristics as well as detecting and assessing human impacts. Because bioindicators are particularly sensitive to contaminants in their environment, if pollution is present, the organism may change its morphology, physiology, or behavior, or even perish. Heavy metal bioindicators include a variety of microorganisms, plant, and animal species. In areas where mosses are absent, higher plants can be used as bioindicatorstodetectairpollution.
The use of flora for heavy metal contamination bioindication isn't always done. Some higher plant responses to heavy metals as bioindicators of soil contamination have that potential. Insects and animals from the Arthropoda class, such as spiders, honey bees, ants, worms, and flies, are used to detect Cu, Hg, Cd, As, An, Pb, Mn, and Fe. On accumulation of metals such as Hg, Cd, Zn, and Co, many nematodes display alterations intheiralimentarytractandreactivitytoenvironmental change.
Aves have also been employed as bioindicators because they have negative impacts on Hg, As, and Pb accumulation during growth and reproduction. Chordates such as the flying fox are also utilized for cadmium bioindication. Hg, Cd, Zn, Fe, and Co are detected using organisms from the Pisces class because they accumulate in the liver and gills and may be examined to determine amounts of those metals. Microbes also have physiological and structural reactions.Lichensserveasgoodpollutionbioindicators.
Heavy metals are thus discharged into the air, surface water, and soil, and consequently into groundwater and crops; once in the environment, they do not dissipate, but rather accumulate in soils, sediments, and biomass. Metal content in bioindicators is influenced not only by metal concentrations in air, water, soil, and sediment, but also by environmental factors and biological factors intheorganisms.Asa result,the impactofthesefactors inthiscomplexecosystem mustbemonitored.All ofthe research in the last few decades has been focused on finding bioindicators such as microbes, plants, and animalsthatcollectharmfulmetals.
5. CONCLUSION
All heavy metals even though naturally present in the environment can cause toxicity to organisms if their concentration rise above safety levels. These metals get accumulated in the systems of these organisms due to the lack of metabolism mechanisms. After certain concentrations they show notable changes in their
physiological characteristics. On proper monitoring, these characteristics can be analysed to determine the concentration of these metals in the surrounding environment.
Asaresult,speciesthatlivenativelyinthoseecosystems can be employed as bioindicators for heavy metals like Cu,Cr,Fe,As,Zn,Hg,Cd,Pb,Mn,Co,andNi.Wecantake further actions to lower heavy metal concentrations in certainplacesbasedonthelevelsdeterminedfromthese creatures. This in turn prevents irreversible damage to the ecosystem and humans which would have occurred due to excessive contamination by heavy metals. This alsoleadstoeconomicgrowthandsocialdevelopmentin thoseregionsbyimprovingtheenvironment.
ACKNOWLEDGEMENT
WeareextremelygratefultoourprofessorDr.S.Mythili along with her research scholar Saheli Sur for their constantguidancethroughoutthestudy.
REFERENCES
[1] Holt EA, Miller SW. Bioindicators: using organisms to measure. Nature 2011;3(10):8-13. http://www.nature.com/scitable/knowledge/library /bioindicators-using-o
[2] Parmar TK, Rawtani D, Agrawal YK. Bioindicators: the natural indicator of environmental pollution. Frontiersinlifescience 2016;9(2):110-118. https://doi.org/10.1080/21553769.2016.1162753
[3] Flores‐Vélez LM, Ducaroir J, Jaunet AM, Robert M.Studyofthedistributionofcopperinanacidsandy vineyard soil by three different methods. European Journal of Soil Science 1996;47(4):523-532. https://doi.org/10.1111/j.13652389.1996.tb01852.x
[4] ChaphekarSB.Biologicalindicators:Theconcept and new additions. International Journal of Ecology andEnvironmentalSciences 1978;4:45-51.
[5] Salami SJ, Oyere AJ. Mangifera indica as a bioindicatoroflead,copperandironinthevicinityof a metal smelting plant, Bukuru Jos, Nigeria. Global JournalofPureandAppliedSciences 2010;16(4):417421.
[6] JarvisSC,JonesLH,HopperMJ.Cadmiumuptake from solution by plants and its transport from roots to shoots. Plant and soil 1976;44(1):179-191. https://doi.org/10.1007/BF00016965
[7] Alhashemi AH, Sekhavatjou MS, Kiabi BH, Karbassi AR. Bioaccumulation of trace elements in water, sediment, and six fish species from a
freshwater wetland, Iran. Microchemical Journal 2012;104:1-6.
https://doi.org/10.1016/j.microc.2012.03.002
[8] Gomaa OM, Azab KS. Biological indicators, genetic polymorphism and expression in Aspergillus flavus under copper mediated stress. Journal of radiationresearchandappliedsciences 2013;6(2):4955.https://doi.org/10.1016/j.jrras.2013.10.006
[9] Anderson BS, Hunt JW, Turpen SL, Coulon AR, Martin M. Copper toxicity to microscopic stages of giant kelp Macrocystis pyrifera: interpopulation comparisonsandtemporalvariability. MarineEcology Progress Series 1990;15:147-156. http://www.jstor.org/stable/44634886
[10] Kalisinska E, Lisowski P, Kosik-Bogacka DI. Red fox Vulpes vulpes (L., 1758) as a bioindicator of mercury contamination in terrestrial ecosystems of north-western Poland. Biological trace element research 2012;145(2):172-180. https://doi.org/10.1007/s12011-011-9181-z
[11] Stankovic S,Stankovic AR.Bioindicatorsoftoxic metals. In: Green materials for energy, products and depollution; 13 June 2013; Springer, Dordrecht;p. 151-228. https://doi.org/10.1007/978-94-0076836-9_5
[12] LongoG,TrovatoM,MazzeiV,FerranteM,Conti GO. Ligia italica (Isopoda, Oniscidea) as bioindicator of mercury pollution of marine rocky coasts. PLoS One.2013Mar5;8(3):e58548.
[13] Michalska A. Analysis of mercury content in the environment in the Silesian Voievodeship. Journal of EcologyandHealth.2010;14:168.
[14] SztylerA.Relationships betweenaerosol optical depthandsurface-layerextinctioninthecentralpart ofthe Upper Silesia industrial regionovertheperiod of 1983–1994. Atmospheric Environment 2005;39(8):1513-1523.
https://doi.org/10.1016/j.atmosenv.2004.11.033
[15] Dauwe T, Janssens E, Kempenaers B, Eens M. The effect of heavy metal exposure on egg size, eggshellthicknessandthenumberofspermatozoain bluetitParuscaeruleuseggs. EnvironmentalPollution 2004;129(1):125-129.
https://doi.org/10.1016/j.envpol.2003.09.028
[16] Holler JS, Fowler BA, Nordberg GF. Silver. Handbook on the Toxicology of Metals. Academic Press;2015.p.1209-1216.
[17] Storelli MM, Marcotrigiano GO. Bioindicator organisms: heavy metal pollution evaluation in the Ionian Sea (Mediterranean Sea Italy). Environmental Monitoring and Assessment 2005;102(1):159-166.
https://doi.org/10.1007/s10661-005-6018-2
[18] Hinton J Earthworms as a bioindicator of mercur pollution in an artisanal gold mining communit , achoeira do Piria, razil [Master’s Thesis],Canada:UniversityofBritishColumbia;2002.
[19] Attahiru U, Birnin-Yauri UA, Muhammad C. Acacia nitolica as bioindicator of copper and cobalt pollution due to vehicular emission along the main entrance road of Usmanu Danfodiyo University, Sokoto-Nigeria. Int.J.Adv.Res.Chem.Sci. 2015;2:1-8.
[20] Stojanowska A, R bak J, oż m M, Olszowski T, ihałowicz JS. Spider Webs and Lichens as BioindicatorsofHeavyMetals:Acomparisonstudyin the vicinity of a copper smelter (Poland). Sustainability 2020;12(19):8066.
https://doi.org/10.3390/su12198066
[21] Nasirian H, Irvine KN. Odonata larvae as a bioindicator of metal contamination in aquatic environments: application to ecologically important wetlands in Iran. Environmental monitoring and assessment 2017;189(9):1-18.
https://doi.org/10.1007/s10661-017-6145-6
[22] Aliko V, Hajdaraj G, Caci A, Faggio C. Copper induced lysosomal membrane destabilisation in haemolymph cells of Mediterranean green crab (Carcinus aestuarii, Nardo, 1847) from the Narta Lagoon (Albania). Brazilian Archives of Biology and Technology 2015;58:750-756.
https://doi.org/10.1590/S1516-89132015050244
[23] Evans LK, Edwards MS. Bioaccumulation of copper and zinc by the giant kelp Macrocystis pyrifera. Algae 2011;26(3):265-275.
https://doi.org/10.4490/algae.2011.26.3.265
[24] Ali D, Almarzoug MH, Al Ali H, Samdani MS, Hussain SA, Alarifi S. Fish as bio indicators to determine the effects of pollution in river by using the micronucleus and alkaline single cell gel electrophoresisassay. JournalofKingSaudUniversityScience 2020;32(6):2880-2885.
https://doi.org/10.1016/j.jksus.2020.07.012
[25] Birungi Z, Masola B, Zaranyika MF, Naigaga I, Marshall B. Active biomonitoring of trace heavy metals using fish (Oreochromis niloticus) as bioindicator species. The case of Nakivubo wetland along Lake Victoria. Physics and Chemistry of the
Earth, Parts A/B/C 2007;32(15-18):13501358. https://doi.org/10.1016/j.pce.2007.07.034
[26] TAPIA J, DURÁN E, PEÑA-CORTÉS FE, HAUENSTEIN E, Bertrán C, Schlatter R, VARGASCHACOFF LU, JIMÉNEZ C. Micropogonias manni as a bioindicator for copper in Lake Budi (IX Region, Chile). Journal of the Chilean Chemical Society 2006;51(2):901-904.
http://dx.doi.org/10.4067/S071797072006000200013
[27] Hose GC, James JM, Gray MR. Spider webs as environmental indicators. Environmental Pollution 2002;120(3):725-33.
https://doi.org/10.1016/S0269-7491(02)00171-9
[28] Samecka-Cymerman A, Kosior G, Kolon K, Wojtuń , Zawadzki K, Rudecki A, Kempers AJ. Pleurozium schreberi as bioindicator of mercury pollution in heavily industrialized region. Journal of Atmospheric Chemistry 2013;70(2):105-114. https://doi.org/10.1007/s10874-013-9256-7
[29] wei Zhang W, zhang Ma J. Waterbirds as bioindicators of wetland heavy metal pollution. ProcediaEnvironmentalSciences 2011;10:2769-2774. https://doi.org/10.1016/j.proenv.2011.09.429
[30] Carravieri A, Bustamante P, Churlaud C, Cherel Y. Penguins as bioindicators of mercury contamination in the Southern Ocean: birdsfromthe KerguelenIslandsasacasestudy. Scienceofthetotal environment 2013;454:141-148. https://doi.org/10.1016/j.scitotenv.2013.02.060
[31] Tshumah-Mutingwende, R.R.M.S. (2014). Assessment ofAlgae as Mercury Bioindicators inAcid Mine Drainage waters and their potential for Phytoremediation [Doctoral dissertation, University oftheWitwatersrand,Johannesberg].
[32] Łucz ńska J,Paszcz k ,Łucz ńskiMJ.Fish asa bioindicator of heavy metals pollution in aquatic ecosystem of Pluszne Lake, Poland, and risk assessment for consumer's health. Ecotoxicologyand environmental safety 2018;153:60-67. https://doi.org/10.1016/j.ecoenv.2018.01.057
[33] Haskins DL, Brown MK, Bringolf RB, Tuberville TD. Brown watersnakes (Nerodia taxispilota) as bioindicators of mercury contamination in a riverine system. Science of the Total Environment 2021;755:142545.
https://doi.org/10.1016/j.scitotenv.2020.142545
[34] Shaikh ZA, Smith LM. Biological indicators of cadmium exposure and toxicity. Experientia
1984;40(1):36-43.
https://doi.org/10.1007/BF01959100
[35] Hamza-Chaffai A, Amiard JC, Pellerin J, Joux L, BerthetB.Thepotentialuseofmetallothioneininthe clam Ruditapes decussatus as a biomarker of in situ metal exposure. Comparative Biochemistry and Physiology Part C: Pharmacology, Toxicology and Endocrinology 2000;127(2):185-197.
https://doi.org/10.1016/S0742-8413(00)00147-X
[36] Machreki-Ajmi M, Rebai T, Hamza-Chaffai A. Variation of metallothionein-like protein and metal concentrations during the reproductive cycle of the cockle Cerastoderma glaucum from an uncontaminated site: A 1-year study in the Gulf of Gabès area (Tunisia). Marine Biology Research 2011;7(3):261-271.
https://www.tandfonline.com/author/HamzaChaffai%2C+Amel
[37] Zurayk R, Sukkariyah B, Baalbaki R. Common hydrophytesasbioindicatorsofnickel,chromiumand cadmium pollution. Water, Air, and Soil Pollution 2001;127(1):373-388.
https://doi.org/10.1023/A:1005209823111
[38] Sobrino-Plata J, Ortega-Villasante C, FloresCáceresML,EscobarC,Del CampoFF,HernándezLE. Differential alterations of antioxidant defenses as bioindicators of mercury and cadmium toxicity in alfalfa. Chemosphere 2009;77(7):946-54.
https://doi.org/10.1016/j.chemosphere.2009.08.007
[39] Vukojević V, Sabovljević M, Sabovljević A, Mihajlović N, Dražić G, Vučinić Ž. Determination of heavy metal deposition in the county of Obrenovac (Serbia) using mosses as bioindicators II: Cadmium (CD), cobalt (CO), and chromium (CR). Archives of Biological Sciences 2006; 58(2): 95-104.
https://doi.org/10.2298/ABS0602095V
[40] Liu W, Li PJ, Qi XM, Zhou QX, Zheng L, Sun TH, Yang YS. DNA changes in barley (Hordeum vulgare) seedlings induced by cadmium pollution using RAPD analysis. Chemosphere 2005;61(2):158-167.
https://doi.org/10.1016/j.chemosphere.2005.02.078
[41] Chiarelli R, Martino C, Roccheri MC. Cadmium stress effects indicating marine pollution in different species of sea urchin employed as environmental bioindicators. Cell Stress and Chaperones 2019;24(4):675-687.
https://doi.org/10.1007%2Fs12192-019-01010-1
[42] Pulscher LA, Gray R, McQuilty R, Rose K, Welbergen J, Phalen DN. Investigation into the utility of flying foxes as bioindicators for environmental
metal pollution reveals evidence of diminished lead but significant cadmium exposure. Chemosphere 2020;254:126839.
https://doi.org/10.1016/j.chemosphere.2020.12683
9
[43] Riou L, Nasser NA, Patterson RT, Gregory BR, Galloway JM, Falck H. Lacustrine Arcellinida (testate lobose amoebae) as bioindicators of arsenic concentration within the Yellowknife City Gold Project, Northwest Territories, Canada. Limnologica 2021;87:125862.
https://doi.org/10.1016/j.limno.2021.125862
[44] Campoy-DiazAD,ArribéreMA,GuevaraSR,Vega IA. Bioindication of mercury, arsenic and uranium in the apple snail Pomacea canaliculata (Caenogastropoda, Ampullariidae): bioconcentration and depuration in tissues and symbiotic corpuscles. Chemosphere 2018;196:196-205. https://doi.org/10.1016/j.chemosphere.2017.12.145
[45] Ribas CR, Solar RR, Campos RB, Schmidt FA, Valentim CL, Schoereder JH. Can ants be used as indicators of environmental impacts caused by arsenic?. Journal of Insect Conservation 2012;16(3):413421.https://doi.org/10.1007/s10841-011-9427-2
[46] Samecka-Cymerman A, Kempers AJ. Aquatic bryophytesasbioindicatorsofarsenicmineralization in Polish and Czech Sudety Mountains. Journal of Geochemical Exploration 1994;51(3):291-297. https://doi.org/10.1016/0375-6742(94)90011-6
[47] IrielA,DundasG,CirelliAF,LagorioMG.Effectof arsenic on reflectance spectra and chlorophyll fluorescence of aquatic plants. Chemosphere 2015;119:697-703.
https://doi.org/10.1016/j.chemosphere.2014.07.066
[48] Bekuzarova SA, Bekmurzov AD, Datieva IA, Lushchenko GV, Salbieva MG. Clover nodule bacteria as bioindicators of soils contaminated with heavy metals. In:IOP Conference Series: Earth and Environmental Science; 2020; IOP Publishing; 421(6).p.062043.
https://doi.org/10.1088/17551315/421/6/062043
[49] Berglund ÅM. Evaluating blood and excrement as bioindicators for metal accumulation in birds. Environmental Pollution 2018;233:1198-1206. https://doi.org/10.1016/j.envpol.2017.10.031
[50] Karray S, Marchand J, Moreau B, Tastard E, Thiriet-Rupert S, Geffard A, Delahaut L, Denis F, Hamza-ChaffaiA,ChénaisB.Transcriptionalresponse ofstress-regulatedgenestocadmiumexposureinthe
cockle Cerastodermaglaucum from the gulf of Gabès area (Tunisia). Environmental Science and Pollution Research 2015;22(22):17290-17302.
https://doi.org/10.1007/s11356-014-3971-8
[51] DuarteGS,LehunAL,LeiteLA,Consolin-FilhoN, Bellay S, Takemoto RM. Acanthocephalans parasites of two Characiformes fishes as bioindicators of cadmium contamination in two neotropical rivers in Brazil. Science of the Total Environment 2020;738:140339.
https://doi.org/10.1016/j.scitotenv.2020.140339
[52] Nummelin M, Lodenius M, Tulisalo E, Hirvonen H, Alanko T. Predatory insects as bioindicators of heavy metal pollution. Environmental Pollution 2007;145(1):339-347.
https://doi.org/10.1016/j.envpol.2006.03.002
[53] Khaleghzadeh-AhangarH,MalekM,McKenzieK. The parasitic nematodes Hysterothylacium sp. type MB larvae as bioindicators of lead and cadmium: a comparative study of parasite and host tissues. Parasitology 2011;138(11):1400-1405.
https://doi.org/10.1017/S0031182011000977
[54] Sabovljević M, Vukojević V, Mihajlović N, Dražić G,VučinićZ.Determinationofheav metaldeposition in the county of Obrenovac (Serbia) using mosses as bioindicators: I. Aluminum (Al), arsenic (As), and boron (B). Archives of Biological Sciences 2005;57(3):205-212.
http://dx.doi.org/10.2298/ABS0904835V
[55] Fernández N, Beiras R. Combined toxicity of dissolvedmercurywithcopper,leadandcadmiumon embryogenesis and early larval growth of the Paracentrotus lividus sea-urchin. Ecotoxicology 2001;10(5):263-271.
https://doi.org/10.1023/A:1016703116830
[56] Catsiki VA, Florou H. Study on the behavior of the heavy metals Cu, Cr, Ni, Zn, Fe, Mn and 137Cs in an estuarine ecosystem using Mytilus galloprovincialisasabioindicatorspecies:thecaseof Thermaikos gulf, Greece. Journal of environmental radioactivity 2006;86(1):31-44.
https://doi.org/10.1016/j.jenvrad.2005.07.005
[57] Ueno D, Iwata H, Tanabe S, Ikeda K, Koyama J, Yamada H. Specific accumulation of persistent organochlorines in bluefin tuna collected from Japanese coastal waters. Marine pollution bulletin 2002;45(1-12):254-261.
https://doi.org/10.1016/S0025-326X(02)00109-1
[58] Girotti S, Ghini S, Ferri E, Bolelli L, Colombo R, Serra G, Porrini C, Sangiorgi S. Bioindicators and
biomonitoring: honeybees and hive products as pollution impact assessment tools for the Mediterranean area. Euro-Mediterranean Journal for Environmental Integration 2020;5(3):1-6.
https://doi.org/10.1007/s41207-020-00204-9
[59] da Rocha JR, De Almeida JR, Lins GA, Durval A. Insects as indicators of environmental changing and pollution: a review of appropriate species and their monitoring. Holos environment 2010;10(2):250-262.
https://doi.org/10.14295/holos.v10i2.2996
[60] AgrahariP,Richa,SwatiK,RaiS,SinghVK,Singh DK. Ficus religiosa Tree Leaves as Bioindicators of HeavyMetalsinGorakhpurCity,UttarPradesh,India. Pharmacog J. 2018;10(3):416-420.
https://doi.org/10.5530/pj.2018.3.68
[61] Vallaeys T, Klink SP, Fleouter E, Le Moing B, Lignot JH, Smith AJ. Bioindicators of marine contaminations at the frontier of environmental monitoringandenvironmentalgenomics. Advancesin Biotechnology&Microbiology2017;4(1):555629.DOI: 10.19080/AIBM.2017.04.555629.
http://dx.doi.org/10.19080/AIBM.2017.04.555629
[62] Wu JT. Phytoplankton as bioindicator for water qualityinTaipei. BotanicalBulletinofAcademiaSinica 1984;25(2):205-214.
[63] Venkateswara Rao J, Srikanth K, Pallela R, Gnaneshwar Rao T. The use of marine sponge, Haliclona tenuiramosa as bioindicator to monitor heavymetalpollutioninthecoastsofGulfofMannar, India. Environmental monitoring and assessment 2009;156(1):451-459.
https://doi.org/10.1007/s10661-008-0497-x
[64] Macek T, Kotrba P, Svatos A, Novakova M, DemnerovaK,MackovaM.Novelrolesforgenetically modified plants in environmental protection. Trends in biotechnology 2008;26(3):146-152.
https://doi.org/10.1016/j.tibtech.2007.11.009
[65] Hasairin A, Siregar R. The analysis of level of lead(Pb)onlichensasabioindicatorofairqualityin Medan Industrial Area and Pinang Baris Integrated Terminal in Medan, Indonesia. In:IOP Conference Series:EarthandEnvironmentalScience;1November 2018; IOP Publishing; 187(1).p.012029
https://doi.org/10.1088/1755-1315/187/1/012029
[66] CidFD,FernándezNC,Pérez-ChacaMV,PardoR, Caviedes-Vidal E, Chediack JG. House sparrow biomarkers as lead pollution bioindicators. Evaluation of dose and exposition length on hematological and oxidative stress parameters. Ecotoxicology and environmental safety
2018;154:154-161. https://doi.org/10.1016/j.ecoenv.2018.02.040
[67] Temara A, Skei JM, GillanD, WarnauM, Jangoux M,DuboisP.Validationoftheasteroid Asteriasrubens (Echinodermata) as a bioindicator of spatial and temporal trends of Pb, Cd, and Zn contamination in the field. Marine environmental research 1998;45(45):341-356. https://doi.org/10.1016/S01411136(98)00026-9
[68] AllamH,AouarA,Benguedda W, BettiouiR.Use of sediment and algae for biomonitoring the coast of Honaïne(FarWestAlgerian). OpenJournalofEcology 2016;6(04):159.
https://doi.org/10.4236/oje.2016.64016
[69] Malaviya P, Singh A, Anderson TA. Aquatic phytoremediation strategies for chromium removal. ReviewsinEnvironmentalScienceandBio/Technology 2020;19(4):897-944.
https://doi.org/10.1007/s11157-020-09552-y
[70] Mohanty M, Patra HK. Attenuation of chromium toxicity by bioremediation technology. Reviews of Environmental Contamination and Toxicology 2011. 2010:1-34.
https://doi.org/10.1007/978-1-44197615-4_1
[71] Shahid M, Shamshad S, Rafiq M, Khalid S, Bibi I, Niazi NK, Dumat C, Rashid MI. Chromium speciation, bioavailability, uptake, toxicity and detoxification in soil-plant system: A review. Chemosphere 2017;178:513-533.
https://doi.org/10.1016/j.chemosphere.2017.03.074
[72] Perillo L, Arfuso F, Piccione G, Dara S, Tropia E, Cascone G, Licitra F, Monteverde V. Quantification of some heavy metals in hair of dairy cows housed in different areas from Sicily as a bioindicator of environmental exposure a preliminary study. Animals 2021;11(8):2268.
https://doi.org/10.3390/ani11082268
[73] Vukojević V, Sabovljević M, Sabovljević A, Mihajlović N, Dražić G, Vučinić Ž. Determination of heavy metal deposition in the county of Obrenovac (Serbia) using mosses as bioindicators, IV: Manganese(Mn),Molybdenum(Mo),andNickel(Ni). Archives of Biological Sciences 2009;61(4):835-845.
http://dx.doi.org/10.2298/ABS0904835V
[74] DemirezenD,AksoyA.Commonhydrophytesas bioindicators of iron and manganese pollutions. Ecological Indicators 2006;6(2):388-393.
https://doi.org/10.1016/j.ecolind.2005.04.004
[75] Tripathi, M. ed. (2019). Microbial Treatment Strategies for Waste Management. OMICS International.
[76] UpadhyayAR,TripathiBD.Principleandprocess of biofiltration of Cd, Cr, Co, Ni & Pb from tropical opencast coalmine effluent. Water, air, and soil pollution 2007;180(1):213-223.
https://doi.org/10.1007/s11270-006-9264-1
[77] DhirB,SharmilaP,SaradhiPP,SharmaS,Kumar R, Mehta D. Heavy metal induced physiological alterations in Salvinia natans. Ecotoxicology and environmental safety 2011;74(6):1678-1684.
https://doi.org/10.1016/j.ecoenv.2011.05.009
[78] Pandey VC. Phytoremediation of heavy metals fromflyashpondby Azollacaroliniana Ecotoxicology and Environmental Safety 2012;82:8-12.
https://doi.org/10.1016/j.ecoenv.2012.05.002
[79] Arici E, Bat L. Red algae as bioindicators of heavymetalpollutionfromSamsuncoastsofTurkey. In: 41st CIESM Congress; September 2016; Kiel,Germany.p.12-16.
[80] Azzazy MF. Plant bioindicators of pollution in Sadat city, Western nile Delta, Egypt. PLoS One 2020;15(3):e0226315.
https://doi.org/10.1371/journal.pone.0226315
[81] da Silva LC, de Araújo TO, Siqueira-Silva AI, Pereira TA, Castro LN, Silva EC, Oliva MA, Azevedo AA. Clusia hilariana and Eugenia uniflora as bioindicatorsofatmosphericpollutantsemittedbyan iron pelletizing factory in Brazil. Environmental Science and Pollution Research 2017;24(36):2802628035.https://doi.org/10.1007/s11356-017-0386-3
[82] Malea P, Haritonidis S. Cymodocea nodosa (Ucria) aschers. as a bioindicator of metals in Thermaikos Gulf, Greece, during monthly samplings. Botanica Marina 1999;42(5):419-430. https://doi.org/10.1515/BOT.1999.048
[83] Baker RT, Martin P, Davies SJ. Ingestion of sublethallevelsofironsulphatebyAfricancatfishaffects growth and tissue lipid peroxidation. Aquatic Toxicology 1997;40(1):51-61. https://doi.org/10.1016/S0166-445X(97)00047-7
[84] JahanS,StrezovV.Assessmentoftraceelements pollutionintheseaportsofNewSouthWales(NSW), Australia using oysters as bioindicators. Scientific reports 2019;9(1):1-10. https://doi.org/10.1038/s41598-018-38196-w
[85] Jones WG, Walker KF. Accumulation of iron, manganese, zinc and cadmium by the Australian freshwater mussel Velesunioambiguus (Phillipi) and its potential as a biological monitor. Marine and Freshwater Research 1979;30(6):741-751. https://doi.org/10.1071/MF9790741
[86] DabwanAH,TaufiqM.Bivalvesasbio-indicators for heavy metals detection in Kuala Kemaman, Terengganu, Malaysia. Indian journal of science and technology 2016;9(9):1-6. http://dx.doi.org/10.17485/ijst/2016/v9i9/88708
[87] Laitano MV, Nunez JD, Cledón M. Shell alterations in the limpet Bostrycapulus odites: A bioindicatorofharbourpollutionandmineresiduals. Ecological indicators 2013;34:345-351. https://doi.org/10.1016/j.ecolind.2013.05.022
[88] Davodpour R, Sobhanardakani S, Cheraghi M, AbdiN,LorestaniB.Honeybees(ApismelliferaL.) asa potential bioindicator for detection of toxic and essential elements in the environment (case study: Markazi Province, Iran). Archives of environmental contamination and toxicology 2019;77(3):344-358. https://doi.org/10.1007/s00244-019-00634-9
[89] Vodyanitskii YN. Standards for the contents of heavy metals in soils of some states. Annals of agrarian science 2016;14(3):257-263. https://doi.org/10.1016/j.aasci.2016.08.011
[90] Olayinka OT, Idowu AB, Dedeke GA, Akinloye OA, Ademolu KO, Bamgbola AA. Earthworm as bioindicator of heavy metal pollution around Lafarge, Wapco Cement Factory, Ewekoro, Nigeria. In: COLERMProceedings;4May2012;2:488-95.
[91] Ayotunde EO, Offem BO, Ada FB. Heavy metal profile of cross river: cross river state Nigeria using bioindicators. Indian Journal of Animal Research 2011;45(4):232-246.
[92] AzevedoJS,FernandezWS,FariasLA,FávaroDT, Braga ED. Use of Cathorops spixii as bioindicator of pollution of trace metals in the Santos Bay, Brazil. Ecotoxicology 2009;18(5):577-586. https://doi.org/10.1007/s10646-009-0315-4
[93] Al-WaridHS,AliHZ,JaffarA,NissanG,HaiderA, Yosef A. Use of Two Aquatic Snail Species as Bioindicators of Heavy Metals in Tigris RiverBaghdad. Iraqi Journal of Science 2020;61(7):15891592.https://doi.org/10.24996/ijs.2020.61.7.6
[94] Melville F, Pulkownik A. Investigation of mangrove macroalgae as bioindicators of estuarine contamination. Marine Pollution Bulletin
2006;52(10):1260-1269.
https://doi.org/10.1016/j.marpolbul.2006.02.021
[95] Miljković D, Avramov S, Vujić V, Rubinjoni L, Klisarić N, Živković U, Tarasjev A. Lead and nickel accumulation in Iris pumila: consideration of its usefulness as a potential bioindicator in the natural protected area of Deliblato sands, Serbia. Archivesof Biological Sciences 2014;66(1):331-336.
https://doi.org/10.2298/ABS1401331M
[96] Intamat S, Phoonaploy U, Sriuttha M, Tengjaroenkul B, Neeratanaphan L. Heavy metal accumulation in aquatic animals around the gold mine area of Loei province, Thailand. Human and Ecological Risk Assessment: An International Journal 2016;22(6):1418-32.
https://doi.org/10.1080/10807039.2016.1187062
[97] Amoozadeh E, Malek M, Rashidinejad R, Nabavi S,KarbassiM,GhayoumiR,Ghorbanzadeh-ZafaraniG, Salehi H, Sures B. Marine organisms as heavy metal bioindicators in the Persian Gulf and the Gulf of Oman. EnvironmentalScience and PollutionResearch 2014;21(3):2386-2395.
https://doi.org/10.1007/s11356-013-1890-8
[98] Thriene, B., Weege, K.H. and Schulz, S. (1990). Heavy Metal Resistance of Bacteria as Biological Indicator for Environmental Pollution. In: Environmental Hygiene II; Springer, Berlin, Heidelberg; p.83-86.
https://doi.org/10.1007/978-3642-46712-7_19