STORMWATER MANAGEMENT FOR PIMPARI CHICHWAD CITY USING GIS
Reshma Jagtap1, Madhuri Nikam2
1Student, Sandip University, Nashik, Maharashtra, India.
2S Ass. Prof., Civil department, Sandip University, Nashik, Maharashtra, India.
Abstract - Oneofthemainchallengesposedbyglobaland localenvironmentalchangesistheInspiteofstep-upefforts atreducingtherisksofflood,thefrequencyandmagnitude ofthefloodshavemorethandoubledinrecentyears.Ithas become more frequent and evident in major Indian cities owingtoseveralreasonslikehaphazardalterationsinland use–land cover (LULC), escalation in the amount of precipitationbyvirtueofclimatechangeandrelatedimpacts due other hydrological changes augmented with deterioration of life and properties. Due to urbanization mostofthecityhasgottenembeddedinconcreteandbythe virtueofwhichtherainfallgetsconvertedtorunoff.Design of Strom water drainage systems in cities are very old unfitting for accommodation of increased runoff as a consequence of which Pimpari Chinchwad city is facing recklessWaterLoggingProblem.So,toeradicateandabolish thisproblemvarioussustainable,eco-friendly,economical and universally accepted techniques are discussed in this paper. Geographic Information System (GIS) is used to integrate the suggested sustainable technologies in the vulnerablefloodspotinPimpariChinchwadcity

Key Words: ArcGIS;SWD;Flooding.
1. INTRODUCTION
Pimparichinchwadisthemostdevelopedindustrialareain MaharashtraState.Itissituatedinthenorthwesternsideof Pune. City is known for its industrial development. It has multipleIT,Manufacturingindustries.Itislocatedat530m above the mean sea level. It is located between north latitudes 18° 37' and east longitudes 73° 48'. It is surrounded by bordering limits of Pune Municipal CorporationintheSouthandSouth-east,ChakaninNorth, Talegaon dabhade in west. Pimpari chinchwad area has three rivers, Indrayani in north, in south it is bounded by pavanariverwhichfurthermeetstoMulariverneardapodi. Atcityhascatchmentareaofthreeriversitbecomescrucial to study the storm water management in PCMC area. In historic period main grounds of flooding used to be the excessive rainfall. But now a days, as the cities increasing andgrowingrapidly,pavedareasarealsoincreasingwhich isresultingintolesserinfiltrationandincreasedrunoffand causing the urban flooding and water logging. Urban flooding is the situation when water overflows from the designed storm water drains and flows on roads, into houses.ThishasbeenwitnessedmultipletimesinPimpari
chinchwad. Pimparichinchwadcityisoneoffastestgrowing urbanizationinIndia.Increasingurbanizationhasgivenrise toincreaseinsurfacerunoff.Inhydrologicalstudies,LULC changeanditshydrological impactsondesignofdrainage systemarethemajortopicsofresearchintherecentyears (Aminietal.2011;Chenetal.2009;Foxetal.2012;Sayalet al.2014;).
The research is to carry out Hydrological analysis and thematic mapping of selected study area in Pimpari chinchwad city. Due to Urbanization, concrete embedded surface has increased enormously in PCMC which has reducedtheinfiltrationofwaterintosubsoilowingtowhich quantum ofsurface runoffhasincreasedinstudyarea. By thevirtueofwhich,thecitygenerallyfacestheproblemof WaterLogging.studyhastocarriedouttheLULCchangeby comparing2003and2022LULCdataforcatchmentareafor studyareatounderstandtheimpactofLULContheincrease surfacerunoffwhichcontributestopeakflooddischargesin catchmentofstudyarea
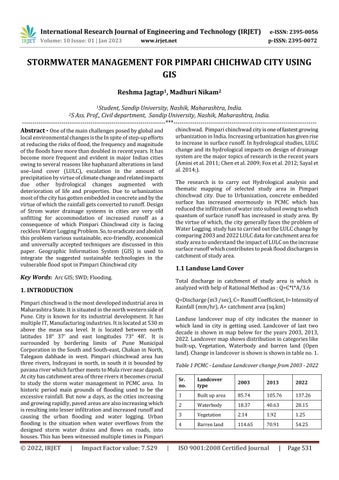
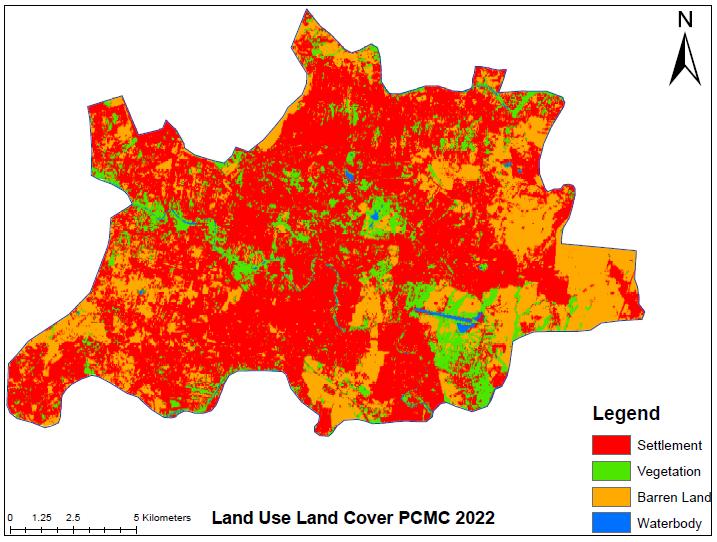
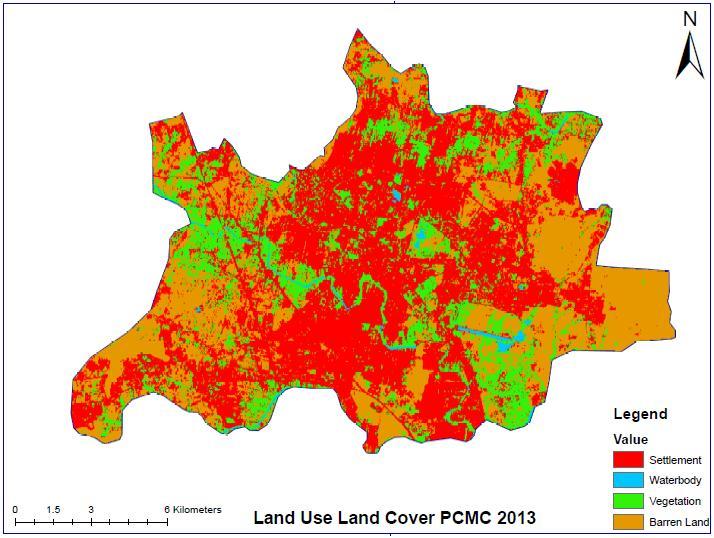
1.1 Landuse Land Cover
Total discharge in catchment of study area is which is analyzedwithhelpofRationalMethodas:Q=C*I*A/3.6
Q=Discharge(m3/sec),C=RunoffCoefficient,I=Intensityof Rainfall(mm/hr),A=catchmentarea(sq.km)
Landuse landcover map of city indicates the manner in which land in city is getting used. Landcover of last two decade is shown in map below for the years 2003, 2013, 2022.Landcovermapshowsdistributionincategorieslike built-up, Vegetation, Waterbody and barren land (Open land).Changeinlandcoverisshownisshownintableno.1
Surface runoff of PCMC city for last two decade shows around 60% increase in surface runoff. This increase in runoffcreatespressureondrainagesystem.AsPCMCcityis growing city and population is expected to grow by 35% from2021to2031(CDP,PCMC).Increaseinpopulationwill resultinincreaseinbuilt-upareascreatingconcernsabout increasing surface runoff. To deal with increasing surface runoff it is necessary to Measure and necessary action to curbthesurfacerunoff.Tocurbthesurfacerunoffstrategies likeretentionpond,greenroofs,useofperviousconcreteetc arenecessary.
1.2 Surface runoff
Surface runoff of PCMC city for last two decade shows around 60% increase in surface runoff. This increase in runoffcreatespressureondrainagesystem.AsPCMCcityis growing city and population is expected to grow by 35% from2021to2031(CDP,PCMC).Increaseinpopulationwill resultinincreaseinbuilt-upareascreatingconcernsabout increasing surface runoff. To deal with increasing surface runoff it is necessary to Measure and necessary action to curbthesurfacerunoff.Tocurbthesurfacerunoffstrategies likeretentionpond,greenroofs,useofperviousconcreteetc arenecessary.
2. STUDY AREA
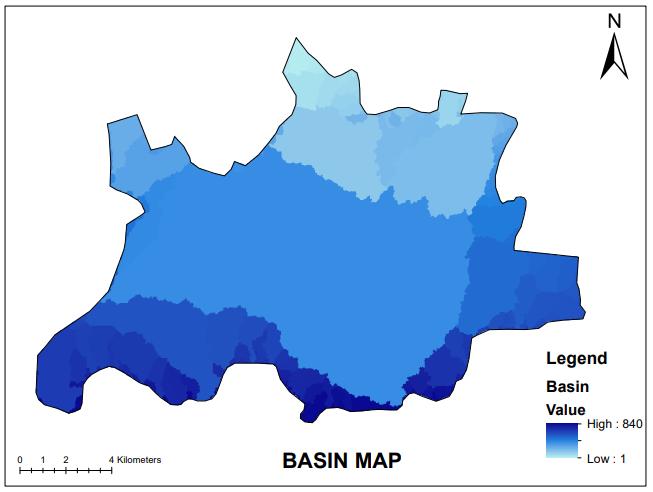
A drainage basin is any area of land where precipitation collectsanddrainsoffintoacommonoutlet,suchasintoa river, bay, or other body of water. City is divided into multiple river basin on basis natural topography and drainagepatternasshowninmapbelow.Pavanariverhas largestriverbasinduetoridgesinsouthernandnorthern partofcity.Multiplesmallbasinsalsocityarea.Toconstraint oftimeandmanpoweritisdifficulttostudyofcitydrainage issuesandurbanfloodingproblemofwholecityindetails. For the purpose of detail analysis and proposals only one riverbasinisselectedasthestudyarea.
oncatchmentofwaterbodies,increaseinbuiltupareas.To improve the situation following proposals can be implemented;
1) Provisionofproperdrainagenetworkinwholecity.
2) Encroachment on the catchment areas should be restrictedbymeansofdemarcatingmultiplecatchment zonesandhighlightingactivitiesallowedandrestricted inthoseparticularzones.
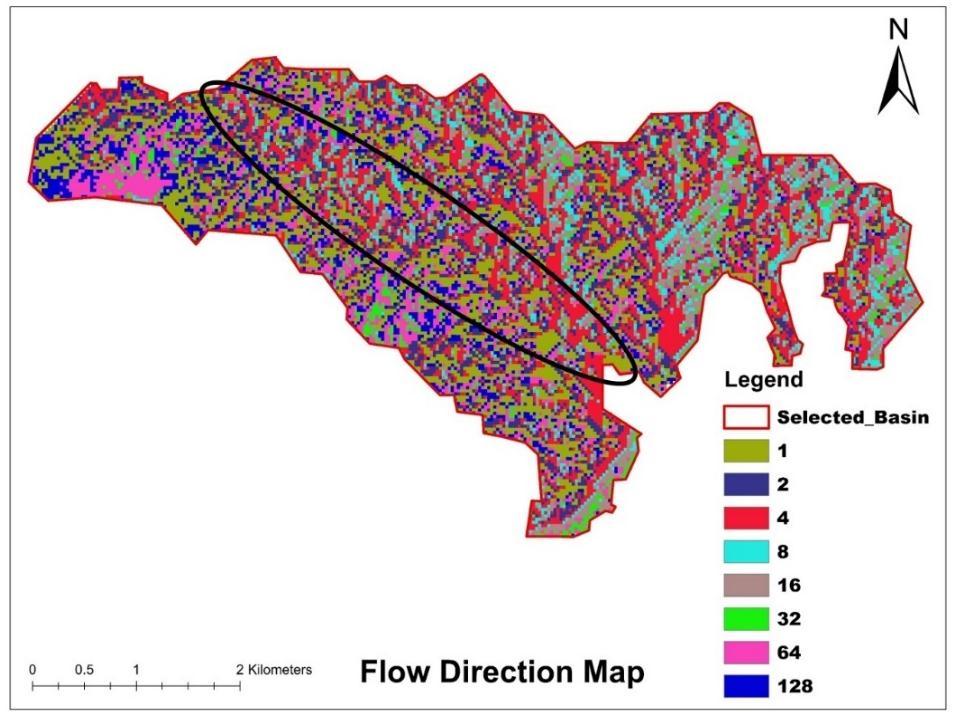
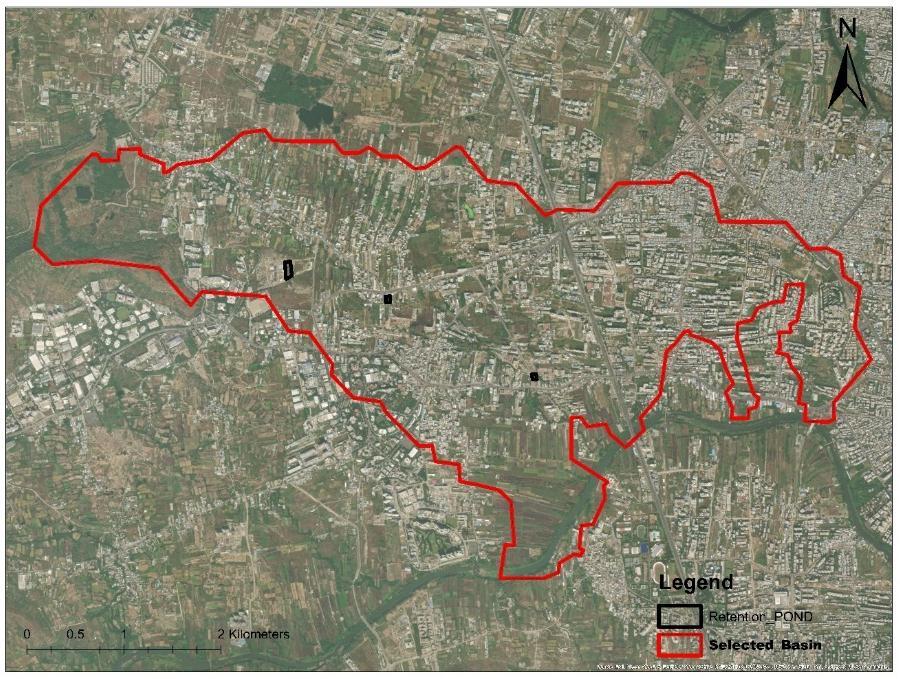
3) Facilities like infiltration zone to be provided. 3 Locationsareidentifiedforproposalofretentionpond inthezoneidentifiedwithhelpofflowdirectionand flowaccumulationasshowninmapbelow.Thetable aboveprovidethedetailsoftranchesprovided.Annual maintenance of trenches will require after monsoon seasontoremovedebrisandmaintaintheefficiency.
2.1 Methodology:
Urban flooding is a natural calamity which cannot be eliminatedcompletelytopreventthelossesoccurredfromit alternativesolutioncanbeprovided.Thedatacollectedwith regard to PCMC and selected basin area comprises of satelliteimages,toposheets,drainagenetworkofcity.QGIS softwareisutilizedforhydrologicalanalysisofstudyareato generate Contour map of area with interval of 1 m, Flow direction map, Flow accumulation map and base map of studyarea.Thesemapsandanalysisareusedtounderstands thevulnerableareasinselectedbasinandishighlightedin themapshownbelow.
2.2 Result and analysis:
In PCMC city, multiple reasons are contributing to storm water problems and urban flooding like lack of drainage network,lackofproperstormwaterdrains,encroachment
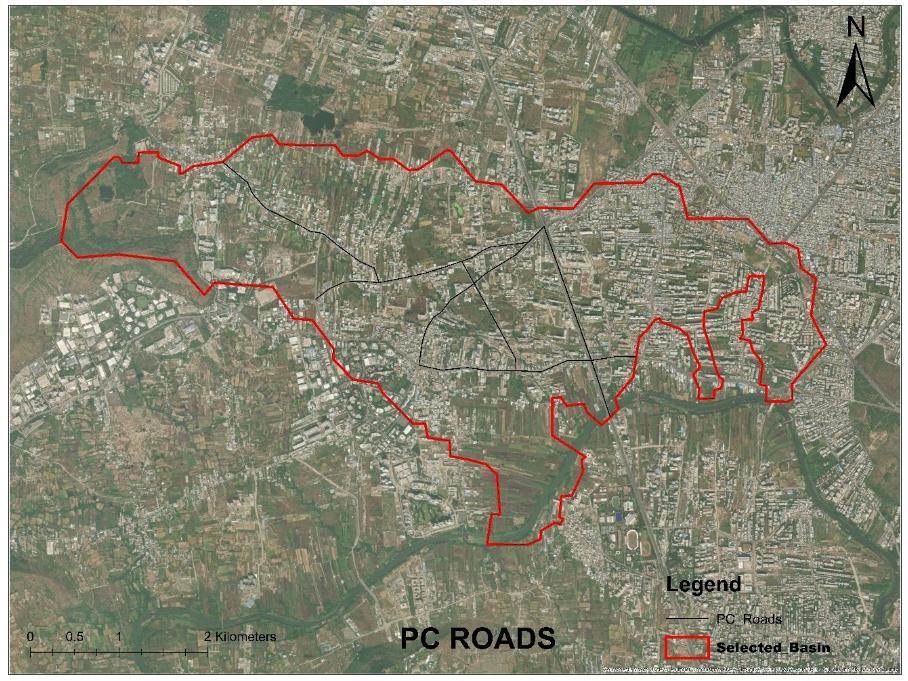
4) Withincreasingbuiltupareanonpervioussurfaceis increasing,soalongwithfacilitieslikeretentionponds, useofperviousconcreteshouldalsobepromoted.On all the roads falling within identified zone must be providedwithperviouscementconcretecurbs.Some oftheroadsareidentifiedformandatoryprovisionof perviouscementconcreteasshowninmapbelow.
3. CONCLUSIONS
As a result of growth in population, urbanization and industrialization,citiesaregettingconvertedintoconcrete jungle.Thisrapidlychanginglandcoverinconjunctionwith limitations of drainage system and changing climatic condition are giving rise to condition like urban flooding. Difficulties in changing the infrastructure of citywide or restricting the growth of city is suggesting the need for alternatefacilities.Toreducethesurfacerunoffinthecity multiple alternatives like percolation tank, infiltration trenches, use of pervious concrete can be implemented.
Locationswherethesefacilitiescanbeimplementedareby understanding topography, contour, slope, different hydrologicalanalysislikeflowdirection,flowaccumulation etc.Thisstudywasfocusedongenerationoftheseanalysis for PCMC city with help of QGIS software where different locationwherethealternativescanbeplacedareidentifies. Thismethodologycanbeimplementedinothercitiesalsoto identifylocationotimplementalternativestrategies.
REFERENCES
[1]Barroca,B.,Bernardara,P.,Mouchel,J.M.andHubert,G. (2006), Indicators for identification of urban flooding vulnerability.Nat.HazardsEarthSyst.Sci.,6,553–561.
[2] Farhat Rafiq, Sirajuddin Ahmed, Shamshad Ahmad (2016), Urban floods in India, International Journal of Scientific & Engineering Research, Volume 7, Issue 1, January-2016
[3]CPREEC(2008),UrbanFloodStudiesforChennaiunder NIDM Project, CPR Environmental Education Centre, Chennai.
[4] Calder, I. R. and Ailward, B. (2010), Forest and floods: moving to an evidence-based approach to watershed and integratedfloodmanagement.WaterInt.,31(1),1–13
[5]Gupta,A.K.,Nair,S.S.,Chopde,S.andSingh,P.K.(2010), Risk to resilience: strategic tools for disaster risk management. NIDM, ISET-US, US-NOAA and DFID, International Workshop Proceeding Volume, NIDM, New Delhi,p.116
[6]Environmentalstatusreport,2016,Pimparichinchwad municipalcorporation,Maharashtra.
[7]LeopoldBL(1968).Hydrologyfor-UrbanLandPlanningAGuidebookontheHydrologicEffectsofUrbanLandUse. U.S.GeologicalSurvey,Washington,D.C
[8]Mirza,M.M.Q.,Warrick,R.A.,Ericksen,N.J.andKenny, G. J. (2001), Are floods getting worse in the Ganges, BrahmaputraandMeghnabasins?Environ.Hazards,3,37–48.
[9]UNDP-India,(2010).Paneldiscussiononurbanfloodsin India (Background note). UNDP-India and NDMA, GovernmentofIndia,E-circulation
[10]Ramachandra,T.V.andVarghese,S(2003),Exploring possibilities of achieving sustainability in solid waste management.IndianJ.Environ.Health,45(4),255–254.
[11] City development plan (2006), Pimpari chinchwad MetropolitanArea-2016,PimpariChinchwadMetropolitan DevelopmentAuthority,Annexures.
[11] Sundaram AM (2009). (MIT, Manipal). GIS model to assess Chennai city’s environmental performance, using green-cover as the parameters. Map World Forum. Hyderabad,GIS@development(website).
[12] Srinivasan RK (2008). White Foam: The Chennai Riverbed does not have space to breathe. Down to Earth, February2008
[13]Turner,B.L.(2003)etal.,Aframeworkforvulnerability analysisinsustainabilityscience.Proc.Natl.Acad.Sci.USA, 100(14),8074–8079.
[14]Roxy,M.K.;Ghosh,Subimal;Pathak,Amey;Athulya,R.; Mujumdar, Milind; Murtugudde, Raghu; Terray, Pascal; Rajeevan,M.(2017-10-03)."Athreefoldriseinwidespread extreme rain events over central India". Nature Communications.8(1).doi:10.1038/s41467-017-00744-9. ISSN2041-1723.
[15] Simpkins, Graham. "Hydroclimate: Extreme rain in India". Nature Climate Change. 7(11): 760. doi:10.1038/nclimate3429
[16]HydrologyforUrbanlandPlanningAGuidebookonthe HydrologicEffectsofUrbanlandUse,LunaB.Leopold,2004.
[17] Dr. Rajshree Kamat,2019, Urban flood vulnerability AssessmentofBhopal,M.P.,India.