International Research Journal of Engineering and Technology (IRJET)

Epilepsy is a common brain disorder. Approximately 1% of global population suffers from this disease. Epilepsy is characterized by a transient disorder of the neuronal system and its unpredictable nature. Epileptic seizures falls under two categories: partial and generalized, the difference lies in the occurrence region of the brain. Seizures can occur for all races, ages, but they are more common in younger and older demographics. Epileptic seizures not only harm the sensory, motor, and functional aspects of the body, but they also affect the consciousness, memory, and cognitive activities of epileptic patients. Therefore, it is of great practical significance to develop an effective prediction and detection approach for epileptic seizures to save the life of the people. EEG is painless and convenient; it is the most popular detection approach for epilepsy diagnosis. The detection of epileptic seizures involves the manual scanning of EEG signals, which is error-prone and time-consuming. Hence, it is urgent to develop effective and reliable techniques for seizure detection via EEG signals. Selection of feature is an important step in developing reliable models. Therefore, understanding signals’ statistical properties is very important as data recording or using the different datasets setting the paramteres in each case is different. Several classifiers have been tested and evaluated for EEG epileptic seizure detection to discriminate between seizure and non-seizure states. SVM classifier is the most common technique; the evaluations indicated that our model achieved the more effective classification than some previously studied methods. Hence, it can be said as computer-assisted clinical diagnosis of seizures bears a potential, which not only relieves the suffering of patient with epilepsy to improve quality of life, but also helps the neurologists, clinicians to reduce their workload and help them to make decisions more quickly, accurately, and effectively. Both traditional feature extraction techniques statistical and machine learning classifiers are considered for study and successfully classified the data as spike or non spike with higher efficiency. Conventional feature extraction techniques commonly used are statistical parameters as mean, median, mode average etc. time domain
features. EEG is a signal acquisition tool from cerebral electric discharges. In this paper, we have used Support Vector Machines (SVM) for classification of spike signals morphology The SVM is a supervised classification method using kernel functions. It could help in improvement of diagnosis of Epilepsy.
Key words: Electroencephalogram, Support Vector Machine, Epileptic seizure, Machine Learning, Spikes
Humanbrainprocessesandcoordinatestheinformationof huge activities of the body. Electroencephalogram (EEG) is the recording of electrical activity of the brain by attaching some electrodes on the scalp that records the potential difference between the electrodes which is called electroencephalography[1]. It is painless and harmless as it doesnotpassanyelectricityintothebrainorourbody[2].
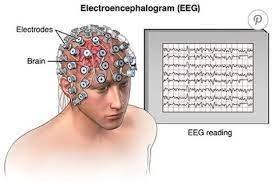
Spikes are transient signals that range from 20 milliseconds to 70 milliseconds and having amplitudes greaterthan100[3].
Epileptic seizures falls under two categories: partial and generalized, the difference lies in the occurrence region of thebrain.Seizurescanoccurforallraces,ages,buttheyare morecommoninyoungerandolderdemographics.Epileptic seizures not only harm the sensory, motor, and functional aspects of the body, but they also affect the consciousness, memory,andcognitiveactivitiesofepilepticpatients.
EEG is a useful medical tool as it has the ability to record both normal and abnormal electrical activity of the brain. The EEG signals are classified in five different frequency bands as shown in Table 1.
Generalisedseizuresoccur whenthewholebrainisaffected by abnormal electrical activity. The young person becomes unconscious, if sometimes only briefly. Partial or Focal seizures occur when one area (or lobe) of the brain is affected by abnormal electrical activity. The symptoms and level of consciousness depend on the area of the brain involved.
Avarietyoftechniquesweredevelopedforepilepticseizure detection using EEG signals in previous research. The basic two steps involved in seizure detection using the various proposed methods are feature extraction and classification techniques. Extracting important features from EEG signals is very crucial step to improving classification performance. Relevant features can be extracted from different domains, including the time domain, frequency domain, and/or timefrequencydomain.
Thereareseveralmethodsthatextracttimedomain featuresforepilepticseizuredetectionincludingradialbasis function neural networks based on principal component analysis(PCA)[6] [7]extractedtimedomainfeaturesusing amplitude and phase coupling measures based on three different coupling approaches. [6] presented a PCA-based neural network to detect epileptic seizures. [8] used fractional linear prediction to discriminate non-seizure and seizure EEG signals. In frequency domain analysis, the main methods include fast Fourier transform[9], higher-order spectra [10] , power spectral analysis [11] , eigenvectors [12], [9] extracted the relevant features from raw EEG signals using fast Fourier transform, and built a hybrid systemtodetectepilepticseizures.[10]madeacomparative studyofthefeatureextractionfromthepowerspectrumand
the higher-order spectra, and the experimental results showed that the selected higher-order spectra features outperformedthepowerspectrum.13]extractedcontinuous wavelet transforms (CWT) and bi-spectrum features, and built a number of classifiers to perform both two-way and three-way classifications. [10] evaluated an EEG spectrum from 4 to 24 Hz with univariate comparisons and multivariate comparisons, and the experimental results demonstrated that EEG spectral analysis could be used to demonstrateawarenessinpatientswithseverebraininjury. [12] extracted features using eigenvector methods, and the experimental results demonstrated that the features obtained by the eigenvector methods could adequately representEEGsignals.
In the time-frequency domain, the main methods include wavelet transform [14], wavelet packet decomposition[15];[16], multi-wavelet transform[17], Stockwell transform[18], empirical mode decomposition (EMD) [19], and so on. [14] used empirical wavelet transform to divide raw EEG signals into rhythms and extract relevant features. [16] transformed EEG signals into sub-signals using wavelet packet decomposition, and wavelet packet coefficients were then fed into the autoregressive model to compute autoregressive coefficients,whichwereusedasextractedfeatures. Pekeret
al., (2015)19 extracted relevant EEG features using a dualtree complex wavelet transform at various levels of granularitytoobtainsizereduction.[17]usedmulti-wavelet transformsandextractedfeaturestoidentifyseizuresinEEG signals. [18] transformed raw EEG signals into the timefrequency domain using Stockwell transform, and the amplitudes of Stockwell transform in five sub-bands were extracted to construct feature vectors. [20] employed EMD to decompose raw EEG signals, and the second-order difference plot of the decomposed components was utilized asafeatureforseizuredetection.
Apart from the time-frequency domain analysis, several approaches based on non-linear features were applied to EEG signals after decomposition. [21] assessed the diagnostic performance of Lyapunov exponents in EEG signals. [22] applied recurrence quantification analysis to
raw EEG signals and sub-bands for epileptic seizure detection. [23] combined correlation dimension with standard deviation and the largest Lyapunov exponent for epilepticseizuredetection.
Regarding classification, the detection results or output is decided by the performance of the selected classifiers. In previous studies, the most frequently used classifiersincludeddecisiontrees [24],randomforests[25], artificial neural networks [26], support vector machines (JaiswalandBanka,2017)27,extremelearningmachines[16], ensembles of gradient-boosted decision trees [28] convolutional neural networks [29] long short-term memory networks [30], etc. Among these classifiers, artificial neural networks are frequently used due to their good adaptability,
generalizationcapability,andeasyimplementation[31]Deep learning-based approaches were also applied to EEG signal classification in recent years [29;32]. In automated epilepsy detectionsystems,generallyMachinelearningalgorithmsare used(Table2).
Epilepsy is a unpredictable neurological disease that is accompanied by disturbed movements of the body, loss of consciousness,andalsolossofmusclecontrol[34].Inmostof the cases for epileptic patients, seizures are controlled by
givinganticonvulsanttherapy. Butforabout25%ofepileptic cases, no treatment is available +yet. Hence, a reliable and effectivepredictionmethodtopredicttheonsetofseizuresis very important as it could improve the life of epileptic patients who are constantly under pressure of the random seizureoccurrences.Hencethepresentworkwasundertaken withfollowingobjectives.
Recording&evaluationofdruginducedEEGspikes andtransientwaves.
Analysisandidentificationoffeaturesfor classificationofEEGspikes.
Epileptic seizures not only harm the sensory, motor, and functional aspects of the body, but they also affect the consciousness, memory, and cognitive activities of epileptic patients.
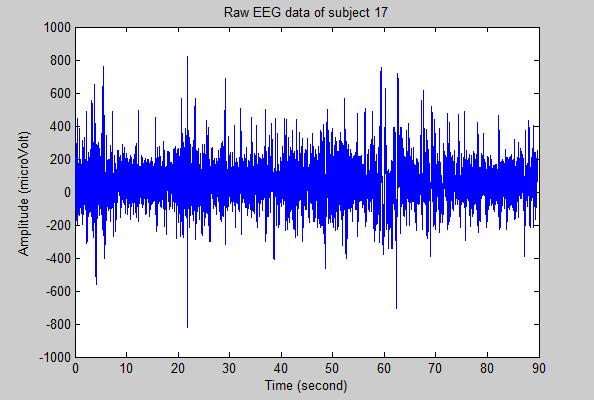
Ablockdiagramofthekeystagesofthis researchis shown in Figure3. The methodology followed a traditional
machine learning approach: (1) data were collected and labeled; (2) the data were appropriately preprocessed; (3) features were selected and extracted; (4) a classifier was trained;and(5)theperformanceofthesystemisevaluated.
2.1
This section provides a general overview of an epileptic seizure detection system. A typical system consistsofthefollowingstages,asshowninFigure3:
1.Dataacquisition,
2.preprocessing,
3.Featureextraction,
4.Classification
5.Performanceanalysisandevaluation.
3. MATERIALS & METHODS
Subject: Young White Rats are considered for the study, (Permission from Ethical committee wastakenearlier).
Development of EEG spikes and Transients: (ByintracranialinjectionofPenicillin),Stainless steel screw electrodes were attached on to the scalpandsignalswererecorded.
Recording of brain signals: The brain signals was digitally acquired with the help of “Biopac student lab software” available in the Bio MedicalInstrumentationLaboratory.
.
Feature Extraction (both time and frequency domain features) were extracted.(statistical parameters and power spectrum are considered)
Classification: Support Vector Machine (SVM) is used to classify the given EEG signal as epilepticornonepileptic.
In order to record the signal, 350 gm and 270gm wt.of white rats were used for experimentation, (Permission from Ethical Committee was taken earlier). Forthis,1.6gm/kg bodyweighturethanewasgivenas anesthesiawhichwasirreversible.SingledosePenicillin (25 units in 5 µL of saline) was prepared and injected using 1ml insulin disposable syringe, intracranial at
depth of 2mm in the cortical region to induce seizure after15minofgivinganesthesia.
SamplingFrequencywas250samples/sec. Bandpassfilterwasapplied(0.5-40Hz).
Feature processing refers here to feature selection, transformation, and extraction. The selection and extraction of “good” features, is an important machine learningtopicwhichdirectlyinfluencestheperformance of a classification system in terms of its accuracy, The features used in this research were selected after a literature review. However, these features have been reportedinsuccessfulseizuredetectionalgorithms.
Data processing is a decisive step to extract meaningful information from the collected raw dataset. As such, diferent feature extraction techniques have been used; as shown in Table3 These methods are generally applied to the extracted EEG signal dataset. Afterfeatureextractionprocessing,thedatasetbecomes moreinformativethatitultimatelyhelpstheclassiferfor retrieving better information. Feature extraction techniques commonly include time domain, frequency domain and time–requency analyses, entropy and waveletanalysisetc.[35].
RawEEG epileptic signals are a function of time. So, features extracted and calculated on these signals are called time domainfeatures.
Statistical parameters being used are mean, median, mode, standard deviation etc. These are the features calculated to differentiatebetweennormalandaseizureevent[36].
Here, X bethesequenceusedforfeatureextraction, X=[x[0],x[1]……x[N−1]] equ. (1)
Where, N isthelengthofthesequence. Themostcommonstatisticalparametersusedinextracting featuresareasfollows:
Signal transformation is actually conducted to describe the details of the frequency of the signal to get some useful information. The power spectral density (PSD) method is usedtocalculateandanalyzethefeatures[37].
• The power spectral density (PSD)represents the power distribution of EEG series in the frequency domainand used to evaluate the abnormalities of thebrain.
• The power spectral density (PSD) of the signaldescribesthepowerpresentinthesignalasa functionoffrequency,perunitfrequency.
• Power spectral density is commonly expressed in wattsperhertz(W/Hz).
• The FFT samples the signal energy at discrete frequencies whereas PSD deals with stochastic signals(arandomsignal).
To achieve a high accuracy of seizure detection rate and explorerelevantknowledgefromtheEEGprocesseddataset, different supervised and unsupervised machine learning have been used. The following classifiers have been popularly used in seizure detection. SVM, is applied to the processedEEGdatasetforseizuredetection
The accuracy of the obtained results is used to evaluate performance of different methods. The most popular training approach is tenfold cross-validation, where each fold,i.e.,onehorizontalsegmentofthedatasetisconsidered to be the testing dataset and the remaining nine segments areusedasthetrainingdataset[38].
Exceptfortheaccuracy,theperformanceoftheclassifiersis commonly measured by the following metrics as Precision, Recall, and F-measure. These are based on four possible classifcation outcomes True-Positive (TP), True-Negative (TN), False-Positive (FP), and FalseNegative (FN) as presentedinTable4.
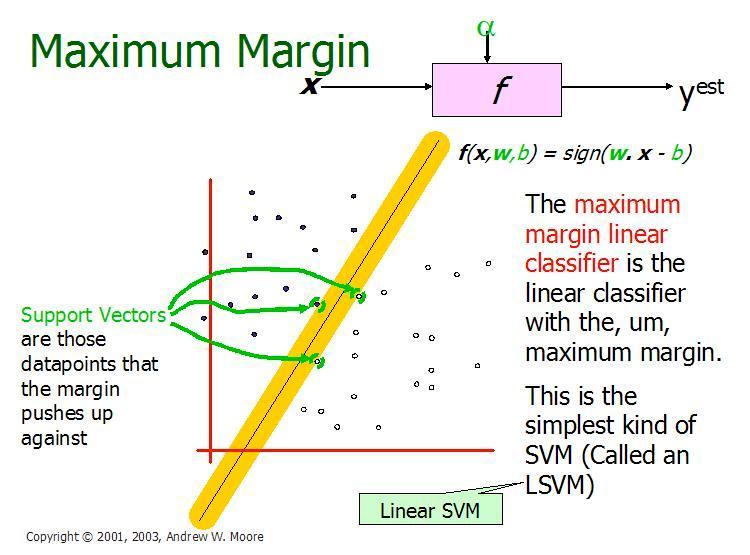
SupportVectorMachineisamachinelearningclassifierused in biomedical signal processing, suitable for binary classification. It is a discriminative classifier which intakes trainingdata(supervisedlearning),thealgorithmoutputsan optimal hyperplane which categorizes new examples. Here, Margin is actually the perpendicular distance between the closest data points and the hyperplane on both sides. The best optimized line (hyperplane) with maximum margin is termed as Margin Maximal Hyperplane. The closest points where the margin distance is calculated are the support vectors. Kernels are mathematical functions for transforming data using some linear algebra. Different SVM algorithmsusedifferenttypesofkernelfunctions[39].
Acronym Detectiontype Realworldscenario
TP Truepositive Ifapersonsuffersto‘seizure’andalsocorrectlydetectedasa‘seizure’
TN Truenegative Thepersonisactuallynormalandtheclassiferalsodetectedasa‘non-seizure’
FP Falsepositive Incorrectdetection,whentheclassiferdetectsthenormalpatientasa‘seizure’case
FN Falsenegative Incorrectdetection,whentheclassiferdetectsthepersonwith‘seizure(s)’asa normalperson.Thisisasevereprobleminhealthinformaticsresearch
Thistabledescribeseachparametermetricconsideringseizureandnon-seizurecase
Precisionistheratiooftrue-positivestothetotalnumberofcasesthataredetectedaspositive(TP+FP)(Siddiquietal.2020). Itisthepercentageofselectedcasesthatarecorrect,asshowninEquation Precision= TP/TP+FP×100%
Highprecisionmeansthelowfalse-positiverate.Recallistheratiooftrue-positivecasestothecasesthatareactuallypositive. Equation2showsthepercentageofcorrectedcasesthatareselected.
Recall= TP/TP+FN×100%
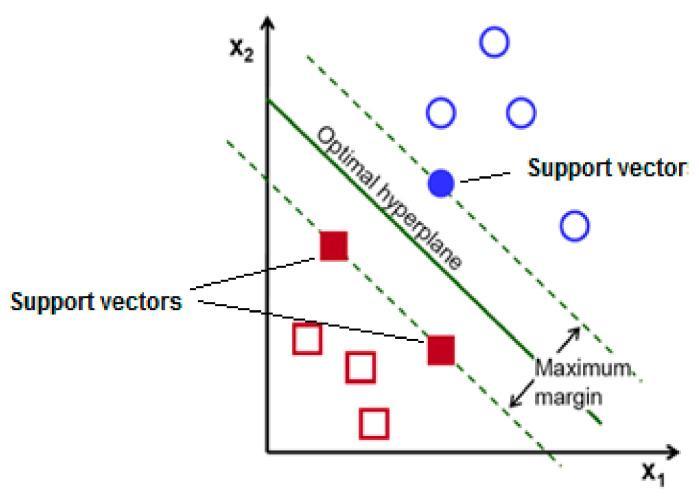
SVMisausefultechniquefordataclassification.
TheSVMisasupervisedlearningalgorithmthat uses a kernel trick to transform input data into higher dimensional space, after which it segregates the data via a hyper-plan with maximalmargins.
Due to its ability to manage large datasets, the algorithm is widely used for binary classification problems in machine learning [40].
Theoptimumhyperlaneisfoundasfollows:
W.xi +b≥+1,ifyi =+1
W.xi+b≤+1,ifyi =-1
Where, xi is the ith input vector (x ∈ RN), yi is the classlabeloftheith input(y ∈{-1, +1}),
w is the weight vector which normal to the hyperplane,andthebisthebias.Optimalhyperlane is found by two margins which parallel to the optimalhyperplane.
W.xi +b≤±1
The input vectors that determine the margins are calledassupportvectors.
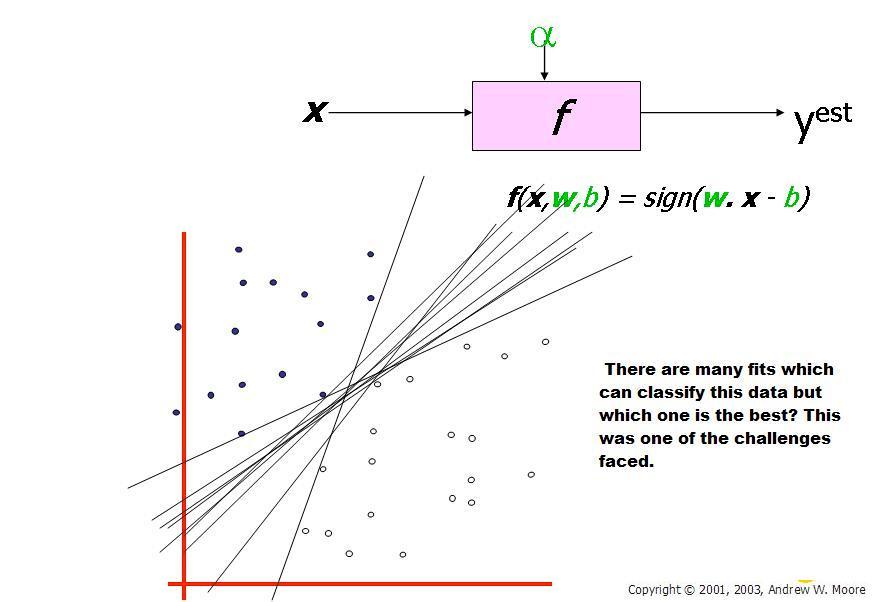
Fig. 5 There are many linear classifiers (hyper planes) that separate the data. However only one of these achieves maximum separation. It gives the maximum margin classifier (Taken from Andrew W. Moore slides 2003).
It gives the maximum margin classifier (Taken from Andrew W. Moore slides 2003)
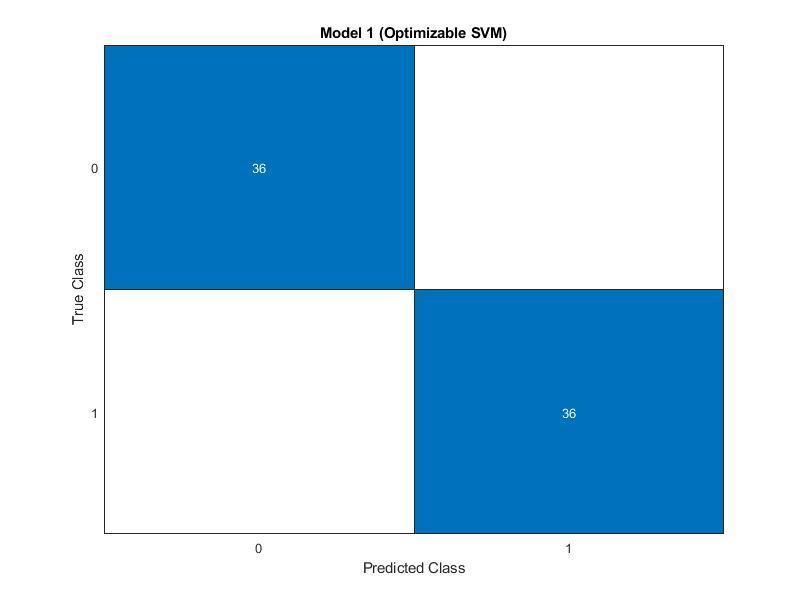
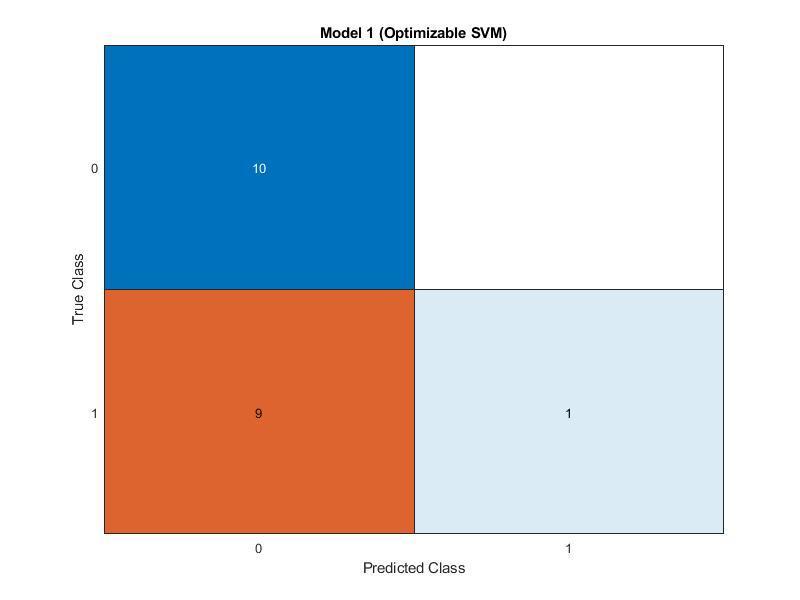
WhenaMachineLearningmodelisbuiltvariousevaluation metricsareusedtocheckthequalityortheperformanceof a model. For classification models, metrics such as Accuracy, Confusion Matrix, and ROC curve are used. It
measures the performance of Machine Learning classification model and looks like a table-like structure. This is how a Confusion Matrix of a binary classification problemlookslike:
Actual Values
Predicted Values
1 0
Elements of Confusion Matrix
TP: True Positive: The values which were actually positiveandwerepredictedpositive.
FP: False Positive: The values which were actually negativebutfalselypredictedaspositive.
FN:FalseNegative:Thevalueswhichwereactually positivebutfalselypredictedasnegative.
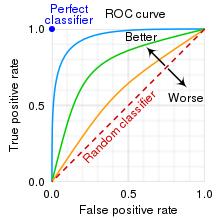
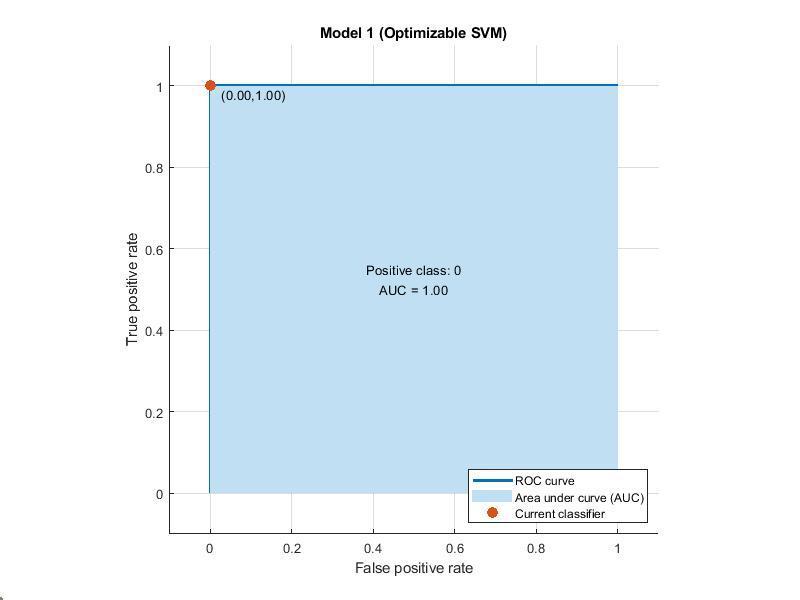
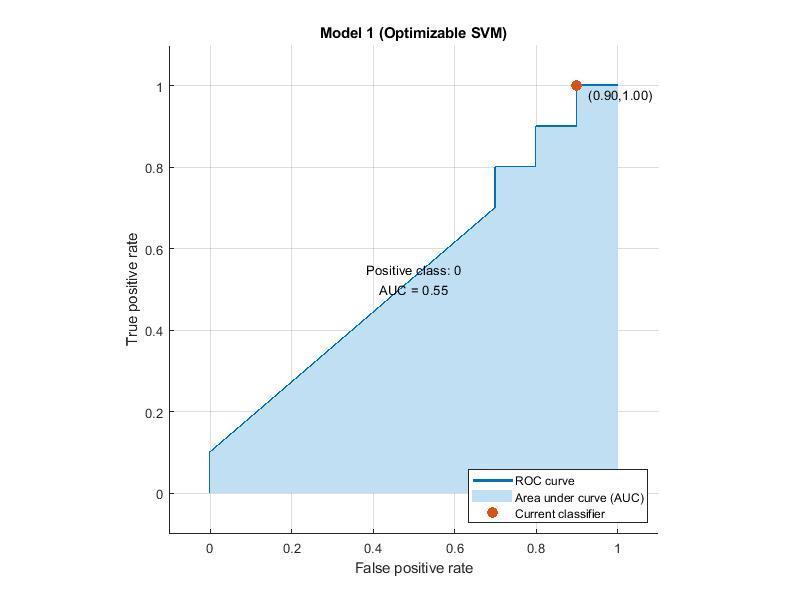
Receiver operating characteristic curve (ROC)


ROCgraphs(receiveroperatingcharacteristic curve)areusefulfororganizingclassifiersand visualizingtheirperformance.
Classifiersthatgivecurvesclosertothetop-left cornerindicateabetterperformance
(Injecting Penicillin 25 units in 5 µL of saline water to anesthetic rats)
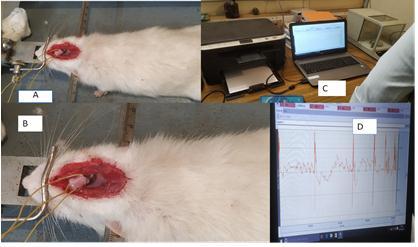
Datarecorded(0.5-40Hz), (Sampling Frequency 250/sec)

Forextractingthefeaturesofthesignalpowerdivisionat eachfrequency,thepowerspectraldensity(PSD)iscalculatedand analyzed.
SpikeSignalshavingamplitudes(µvolt)greaterthannormalEEGsignal.Spikeisatransientsignalswithashortspikeonthe EEG ranging from 20 milliseconds to 70 milliseconds with amplitudes greater than 100. Studies have shown that spike numbersvarysignificantlyafewminutesbeforeepilepticseizuresbegin(Slimenetal.2020).
Power spectral density (PSD) analysis is a method for evaluating the distribution of power in a signal over a range of frequencies.
Researchers have been using the statistical parameters such as mean, median and mode, standard deviation etc. to differentiate between non-epileptic and epileptic conditions because the statistical analysis and recording of EEG signal, parameters of EEG signals for various conditions is different. Therefore, these parameters are calculated as features to differentiatebetweennonepileptic and epilepticevent.
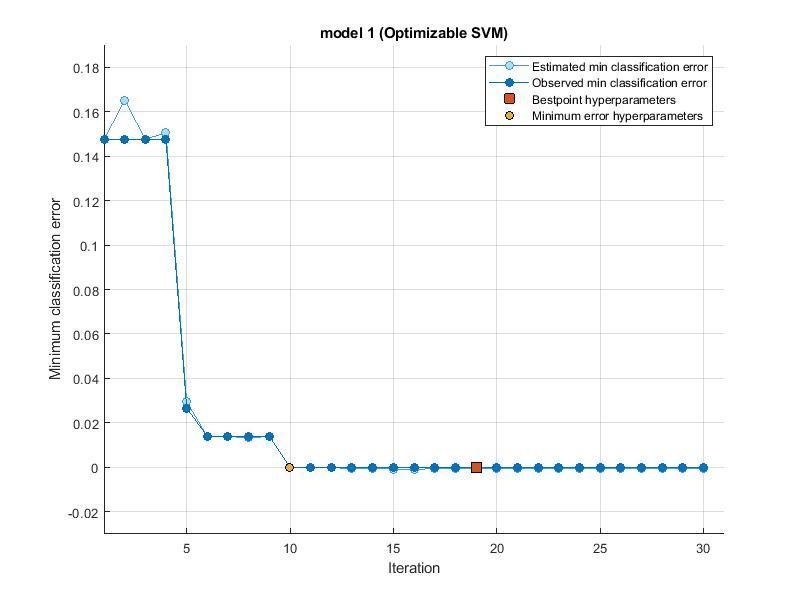
Minimum classification error is well known criterion in pattern classification systems
Accuracy validation
100%
Total cost validation 0
prediction speed3700obs/sec
Training time 46.495 sec
kernel function
Gaussian
Selection of feature is an important step in developing reliable models. Therefore, understanding signals’ statisticalpropertiesisveryimportantasdatarecordingor using the different datasets setting the parameters in each case is different. Several classifiers have been tested and evaluated for EEG epileptic seizure detection to discriminate between seizure and non-seizure states. ANN andSVMclassifiersarethe mostcommon techniques;SVM is easy and fast as compared to ANN. But ANN is more robust technique during the training of ANN under supervised learning,the input vector is presented to the network, which will produce an output vector. This output vectoriscomparedwiththedesired/targetoutputvector.
Theevaluationsindicatedthatourmodelachievedthemore effective classification than some previously studied methods. Hence, it can be said as computer-assisted clinical diagnosis of seizures bears a potential, which not only relieves the suffering of patient with epilepsy to improve quality of life, but also helps the neurologists, clinicians to reduce their workload and help them to make decisions morequickly,accurately,andeffectively.
To understand the spikes morphology, classification tools are required. [42] in their studies reported that with each kernelthereisatleastoneclassifierwhichexactlypredicts theclassofmorphologyofthetestsample.Thepolynomial and sigmoidal kernels were the best because the best classifiers of these kernels have the smallest number of support vectors (19 for the polynomial kernel and 20 for the sigmoidal kernel). [43] developed a tool for preprocessing of Brain Computer Interface (BCI) data that classified threshold crossings in a tunable manner and it was beneficial for decoding. Neural network-based spike classifier has the potential to reduce the need of human interventioninremovingnoisefromtheneuronaldata.The tunable classifier is a step toward preprocessing methods that optimize and stabilize online decoding performance. [44] demonstrated an efficient VLSI implementation of a spike-based learning algorithm that solves both memory encoding and memory preservation problems, by using binary synaptic weights that are updated in a stochastic manner. The results reported demonstrate the correct functionality of the spike-based learning circuits for the
difficult case of random patterns. [45] reported machine learning approach for personalized detection of focal EEG abnormalities, such as spikes and sharp waves, necessary fortheautomatedassessmentoftheclinicalimplicationsof arecording.Despitenotdirectlycomparable,thepresented methodhashighersensitivity(=97 %) andsmaller FP rate (=0.1 min-1) than most approaches proposed in the literature, thus constitutes a useful tool for automated assessment of interictal discharges in sleep EEG. [46] reported the method for converting an ANN into an SNN (Spiking neural networks)that enables low latency classification with high accuracies. It yields improved performance without increased training time. The presented analysis and optimization techniques boost the valueofspikingdeepnetworksasanattractiveframework for neuromorphic computing platforms aiming for fast and efficient pattern recognition. Futher, we need to increase the number of dataset and to introduce the characteristic ''SLOWWAVES''whichwedidnottakeintoaccountinthis work.
Data set was very small, hence, it needs further studies to evaluate and compare the performance of different classifiers. In the future, we intend to further optimize our model to achieve the classification of multiple-levels of epilepticseizure.Futureworkmightlookintotheprospects ofDeeplearningclassifiersandcomparingtheperformance analysis.
Theauthor(SawaryaChandra)isthankfultotheBITMesra, Ranchiforprovidingtheinfrastructuralfacilities.
[1] R.Mukherjee,S.S.DharandK.Tara,"Predictionof Disorder of Brain using EEG Signal Processing in MATLAB GUI Platform,"2017 2nd International Conference on Electrical & Electronic Engineering (ICEEE), 2017, pp. 1-4, doi: 10.1109/CEEE.2017.8412847.
[2] M. Kalaivani, V. Kalaivani,, V. Anusuya Devi. Analysis of EEG Signal for the Detection of Brain Abnormalities. International Journal of Computer Applications® (IJCA) (0975 – 8887) International Conference on Simulations in Computing Nexus, ICSCN-2014.
[3] I. B. Slimen, L. Boubchir and H. Seddik, “Epileptic seizure prediction based on EEG spikes detection of ictal-preictal states”, J. Biomed. Res.., 34, 3, pp. 162–169,2020.
[4] German Neuroscince Centre: Electroencephalogram, URL: https://www.gncdubai.com/treatments/neurologi cal-eeg/,(AccessedonNov.5,2021)
[5] C.-K. A. Lim and W. C. Chia, “Analysis of SingleElectrode EEG Rhythms Using MATLAB to Elicit Correlation with Cognitive Stress,” International Journal of Computer Theory and Engineering, vol. 7,pp.149-155,2015.
[6] G.D. Samanwoy, A. Hojjat, D. Nahid, “Principal component analysis-enhanced cosine radial basis function neural network for robust epilepsy and seizuredetection.”IEEETrans.Biomed.Eng.,2008, pp.55,512–518.
[7] Q. Wei, Y. Wang, X. Gao, S. Gao, “Amplitude and phase coupling measures for feature extraction in an EEG-based brain–computer interface.” J. Neural Eng.,2007,pp.4,120–129.
[8] V. Joshi, R.B. Pachori, A. “Classification of ictal and seizure-free EEG signals using fractional linear prediction.”Biomed.SignalProcess.Control.,2014, pp.9,1–5.
[9] K. Polat, S. Günes, “Classification of epileptiform EEG using a hybrid system based on decision tree classifier and fast Fourier transform.” Appl. Math. Comput.,2007,187,pp.1017–1026.
[10]C.K. Chua, V. Chandran, R.U. Acharya, C.M. Lim, “Application of higher order spectra to identify epileptic EEG.” J. Med. Syst., 2011, 35, pp.1563–1571.
[11] A.M. Goldfine, J.D. Victor, M.M. Conte, J.C. Bardin, N.D. Schiff, “Determination of awareness in patientswithsevere braininjuryusingEEG power spectral analysis.” Clin. Neurophysiol., 2011, 122, pp.2157–2168.
[12]E.D. Übeyli, “Analysis of EEG signals by implementing eigenvector methods/recurrent neural networks.” Digit. Signal Prog., 2009, 19, pp.134–143.
[13]C. Ieracitano, N. Mammone, A. Hussain, F.C. Morabito. “A novel multi-modal machine learning basedapproachforautomaticclassificationofEEG recordings in dementia”, Neural Networks, 2020, pp.123,176–190.
[14] A. Bhattacharyya, M. Sharma, R.B. Pachori, P. Sircar, U.R. Acharya, “A novel approach for automated detection of focal EEG signals using empirical wavelet transform.”, Neural Comput. Appl.,2016,pp.29,47
57.
[15]T.LiandM.Zhou,“ECGclassificationusingwavelet packet entropy and random forests”, Entropy, 2016,pp.18,285.
[16] Y. Wang, Z. Li, L. Feng, C. Zheng, W. Zhang, “Automatic Detection of Epilepsy and Seizure Using Multiclass Sparse Extreme Learning Machine Classification”, Comput. Math. Method Med.,2017,pp.6849360.
[17] L. Guo, D. Rivero, A. Pazos, “Epileptic seizure detection using multiwavelet transform based approximate entropy and artificial neural networks”, J. Neurosci. Methods, 2010, 193, pp.156–163.
[18] H. Kalbkhani and M.G. Shayesteh, “Stockwell transform for epileptic seizure detection from EEG signals”, Biomed. Signal Process Control, 2017,38,pp.108–118.
[19] M. Peker, B. Sen, D. Delen, “A Novel Method for Automated Diagnosis of Epilepsy using ComplexValued Classifiers”, IEEE J. Biomed. Health Inform., 2015, 20, pp.108–118. Entropy 2020, 22, 14022
25.
[20] R.B. Pachori and S.Patidar, “Epileptic seizure classification in EEG signals using second-order difference plot of intrinsic mode functions”, Comput. Meth. Programs Biomed., 2014, pp.113, 494–502.
[21] N.F. Güler, E.D. Übeyli, I. Guler, “Recurrent neural networksemployingLyapunovexponentsforEEG signalsclassification”ExpertSyst.Appl.,2005,29, pp.506–514.
[22] M. Niknazar, S.R. Mousavi, B.V. Vosoughi, M.
Sayyah, “A new framework based on recurrence
quantification analysis for epileptic seizure detection” IEEE J. Biomed. Health Inform., 2016, 11,pp.572–578.
[23] G.D. Samanwoy, A. Hojjat, D. Nahid, “Mixed-band wavelet-chaos-neural network methodology for epilepsy and epileptic seizure detection” IEEE Trans.Biomed.Eng.,2007,54,pp.1545–1551.
[24]H.W.Hu,Y.L.Chen,K.Tang,“Anoveldecision-tree method for structured continuous-label classification”, IEEE Trans. Cybern., 2013, 43, pp.1734–1746.
[25] M. Mursalin, Y. Zhang, Y. Chen, N.V. Chawla, “Automated epileptic seizure detection using improvedcorrelation-basedfeatureselectionwith random forest classifier” Neurocomputing, 2017, 241,pp.204–214.
[26] O. Kocadagli, R. “Classification of EEG signals for epileptic seizures using hybrid artificial neural networks-based wavelet transforms and fuzzy relations”, Expert Syst. Appl., 2017, 88, pp.419–434.
[27]A.K. Jaiswal,H.Banka,“Epilepticseizuredetection in EEG signal with GModPCA and support vector machine”,Bio-Med.Mater.Eng.,2017,28,pp.141–157.
[28] M. Shoaran, M. Farivar, A. Emami, “Hardwarefriendly seizure detection with a boosted ensemble of shallow decision trees”, In Proceedings of the 38th Annual International Conference of the IEEE Engineering in Medicine and Biology Society (EMBC 2016), Orlando, FL, USA,16August2016;pp.1826–1829.
[29]F.Achilles,F.Tombari,V.Belagiannis,A.M.Loesch, S.Navab,“Convolutionalneuralnetworksforrealtime epileptic seizure detection”, Comput. Methods Biomech. Biomed. Eng. Imaging Vis., 2016,6,pp.264–269.
[30]K.M. Tsiouris, V.C. Pezoulas, M. Zervakis, S.
Konitsiotis,D.D.Koutsouris,D.I. Fotiadis,“ALong Short-Term Memory deep learning network for the prediction of epileptic seizures using EEG signals”,Comput.Biol.Med.,2018,99,pp.24–37.
[31]W.Ren,M.Han,“ClassificationofEEGSignalsUsing HybridFeatureExtractionandEnsembleExtreme LearningMachine”NeuralProcess.Lett.,2019,50, pp.1281–1301.
[32]A.Craik,Y.He,J.L.Contreras-Vidal,“Deeplearning for Electroencephalogram (EEG) classification tasks: A review” J. Neural Eng. 2019, pp.16, 031001.
[33] S. Saminu et al., Application of Deep Learning and WT-SST in Localization of Epileptogenic Zone Using Epileptic EEG Signals. Appl. Sci., 12, pp. 4879. 2022, https://doi.org/10.3390/app1210 4879
[34]NoorKamalAl-Qazzaz,SawalHamid,BinMohdAli , Siti Anom Ahmad , Mohd Shabiul Islam and Javier Escudero. Selection of Mother Wavelet Functions for Multi-Channel EEG Signal Analysis duringaWorkingMemoryTask.Sensors2015,15, 29015-29035;doi:10.3390/s151129015.
[35] S. Saminu et al., “Hybrid feature extraction techniqueformulti-classificationofictalandnonictal EEG epilepsy signals”,Elektrika, J. Electr. Eng., 19 pp. 1–11, 2020, doi:10.11113/elektrika.v19n2.219.
[36] S. Saminu,et al., A Recent Investigation on Detection and Classification of Epileptic Seizure Techniques Using EEG Signal. Brain Sci. 20;11 (5):pp.668. 2021, doi: 10.3390/brainsci11050668.
[37] L. Orosco, A.G. Correa and E.L. Leber, “Epileptic seizures detection based on empirical mode decomposition of EEG signals”, In M.K. Günel, edt.,Management of Epilepsy-Research, Results and Treatment.In-Tech Publishing, Vienna, Austria,pp.3–20,2011.
[38] Siddiqui, M.K., Morales-Menendez, R., Huang, X.et
al.A review of epileptic seizure detection using machinelearningclassifiers.BrainInf. 7,5(2020). https://doi.org/10.1186/s40708-020-00105-1.
[39] E. Alickovic, J. Kevric and A. Subasi, “Performance
evaluation of empirical mode decomposition, discrete wavelet transform, and wavelet packed decomposition for automated epileptic seizure detectionandprediction”,Biomed.SignalProcess. Control.,39,pp.94–102,2018.
[40]Amin HU, Mumtaz W, Subhani AR,SaadMNM and Malik AS (2017) Classification of EEG Signals Based on Pattern Recognition Approach. Front. Comput. Neurosci. 11:103. doi: 10.3389/fncom.2017.00103.
[41] Fawcett, T. (2006) An Introduction to ROC Analysis. Pattern Recognition Letters,27,861874.https://doi.org/10.1016/j.patrec.2005.10.01 0
[42] Ousmane Khouma et al. Novel Classification MethodofSpikesMorphologyinEEGSignalUsing
Machine Learning. Procedia Computer Science 148(2019)70–79.
[43] Issar et al. A neural network for online spike classification that improves decoding accuracy. J Neurophysiol 123: 1472–1485, 2020. doi:10.1152/jn.00641.2019.
[44] Mitra, S; Fusi, S; Indiveri, G (2009). Real-time classification of complex patterns using spikebased learning in neuromorphic VLSI. IEEE Transactions onBiomedical Circuits and Systems, 3(1):32-42. DOI: https://doi.org/10.1109/TBCAS.2008.2005781.
[45] Zacharaki et al. (2016). Spike pattern recognition by supervised classification in low dimensional embeddingspace.BrainInformatics,3:73–83;DOI 10.1007/s40708-016-0044-4.
[46] PeterU.Diehll etal.(2015).Fast-Classifying,HighAccuracySpikingDeepNetworksThroughWeight and Threshold Balancing. DOI: 10.1109/IJCNN.2015.7280696.