International Research Journal of Engineering and Technology (IRJET) e-ISSN: 2395-0056

Volume: 10 Issue: 01 | Jan 2023 www.irjet.net p-ISSN: 2395-0072
International Research Journal of Engineering and Technology (IRJET) e-ISSN: 2395-0056
Volume: 10 Issue: 01 | Jan 2023 www.irjet.net p-ISSN: 2395-0072
Student, M.E, Dept. of Civil Engineering, Trinity College of Engineering and Research, Pune 1 Professor, Dept. of Civil Engineering, Trinity College of Engineering and Research, Pune2
Abstract Bridgesspanhorizontallywiththeirtwoends restricted, hence the dynamic properties of bridges vary dependingonthestructure.Nonlinearstatictechniques,such as displacement-based processes, have been consistently enhanced and improved in recent years as a supplement, if not a replacement, to dynamic time history analysis. The workaddressesthetopicofoverpressureanalysisoftorsionsensitivebridgesbyusingastraightcrossingbridgewithtwo equal spans whose basic mode is exclusively torsional as a case study. This chapter provides a summary of the many parameters that define the computational models, basic assumptions, and bridge shape used in this work. Loads and load combinations on the bridge are investigated, and the bridge is modelled in SAP 2000 for linear static, modal, and seismic (response spectrum) analysis to determine the maximum bending moments and dynamic properties of the bridge. MPA is utilized in this work to investigate the nonlinearbehaviourofbridgeswithvaryingpierspans.
Keyword: RCC, Bridge, SAP2000, Pushover, Response Spectrum
Themoderntransportationsystemhasagreatinfluenceon the national economy, and bridges are an important part of alltypesofmoderntransportationsystems.Differenttypesof bridges have simple geometry, yet they attract the attention ofstructuraldesignersbyhavingdifferenttypesofgeometry and type of their structures. Bridges have been observed to perform very poorly due to lack of attention in structural details.Anumberofbridgesweredesignedaroundtheworld in a period when bridge codes contained no provisions for seismic loads, or when such provisions were insufficient by current standards. San Fernando earthquake (1971), Loma Prieta earthquake (1989), Northridge earthquake (1994), Hanshin-Awaji Kobe earthquake (1995) and Tohoku (Japan) earthquake (2011) are few earthquakes that caused drastic damageasignificantnumberofbridgesduetolackofdesign considerationsforseismicresistingforces.
The Bhuj earthquake in India was considered the deadliest earthquake ever. Recently, the Nepal earthquake damaged severalpoorlybuiltandweakmasonrystructures.
A large number of bridges are designed and built without considering seismic forces. In addition, the linear elastic procedures used for bridge analysis remain effective when thestructurebehaveswithintheelasticlimits.Iftheresponse of the structure is beyond the elastic limit, the elastic procedureisnotsufficienttoassessthestructures.Thisleads to overestimation of the structures, thereby attracting more seismic forces. Currently, there are no comprehensive guidelines to assist the practicing structural engineer in evaluating existing bridges and their retrofits. In order to solvethisproblem,theobjectiveofthisstudyistoperforma seismic evaluation for RC bridges with short and long piers usingnonlinearanalysis(pushover).
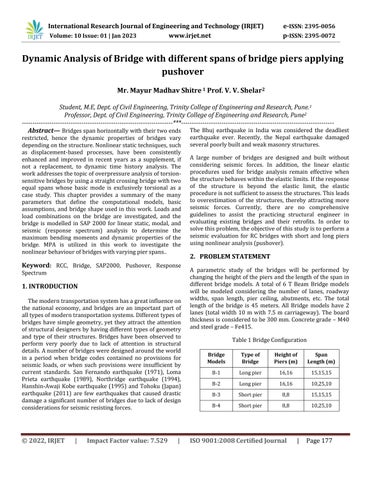
A parametric study of the bridges will be performed by changingtheheightofthepiersandthelengthofthespanin different bridge models. A total of 6 T Beam Bridge models will be modeled considering the number of lanes, roadway widths, span length, pier ceiling, abutments, etc. The total length of the bridge is 45 meters. All Bridge models have 2 lanes (total width 10 m with 7.5 m carriageway). The board thicknessisconsideredtobe300mm.Concretegrade –M40 andsteelgrade–Fe415
Bridge Models Type of Bridge Height of Piers (m) Span Length (m)
B-1 Longpier 16,16 15,15,15
B-2 Longpier 16,16 10,25,10
B-3 Shortpier 8,8 15,15,15
B-4 Shortpier 8,8 10,25,10
International Research Journal of Engineering and Technology (IRJET) e-ISSN: 2395-0056
Volume: 10 Issue: 01 | Jan 2023 www.irjet.net p-ISSN: 2395-0072
SeismicZone–Zone4(SeismicCoeff.Factor=0.24)
Poisson’sratio–0.2 Typeofsoil–Medium ImportanceFactor–1 ResponseReductionFactor–5 DampingofStructure–5%
Clear width of roadway = 7.5mSpan of the bridge =16m
Averagethicknessofthewearingcoat=80mmGrade ofconcrete=M25 Gradeofsteel=Fe415
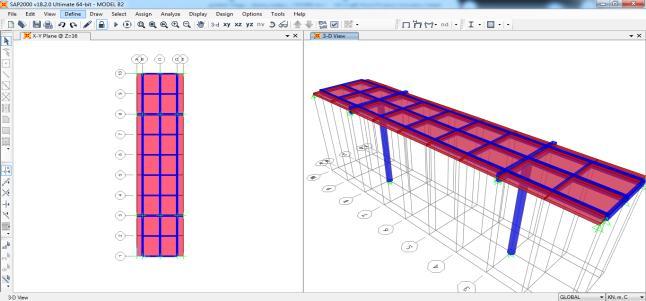
Fig.1.ModelB1 Fig.2.ModelB2
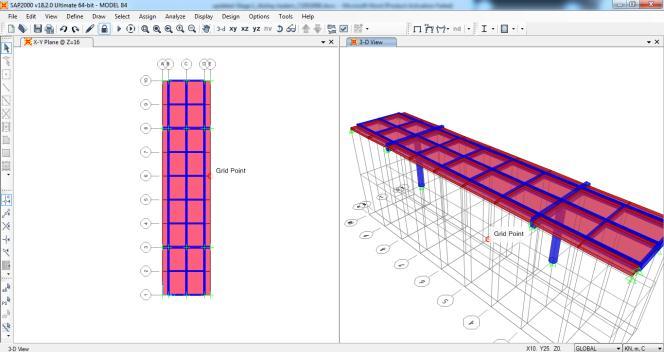
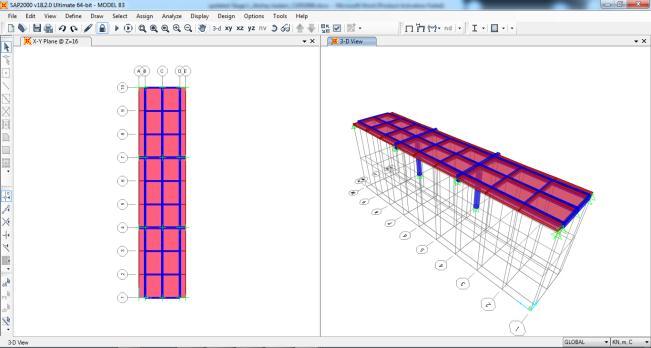
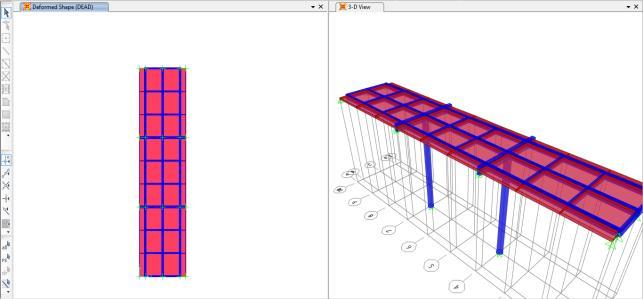
Fig.4.ModelB4
A. Time Period
Table2.TimePeriod(SPAN15,15,15)
SPAN 15, 15, 15
Mode Long bridge pier (B1) Short bridge pier (B3) 1 0.439 0.296 2 0376 0261 3 0287 0203 4 0266 0188 5 0265 0187 6 0.22 0.155
Graph.1.TimePeriod:Span15,15,15
As we can see in the above chart, it shows approximately span time period of 15, 15, 15 for long bridge pillar (B1), shortbridgepillar(B2).Themaximumtimeperiodshowsfor the long bridge pier (B1) and the minimum results for the shortpier
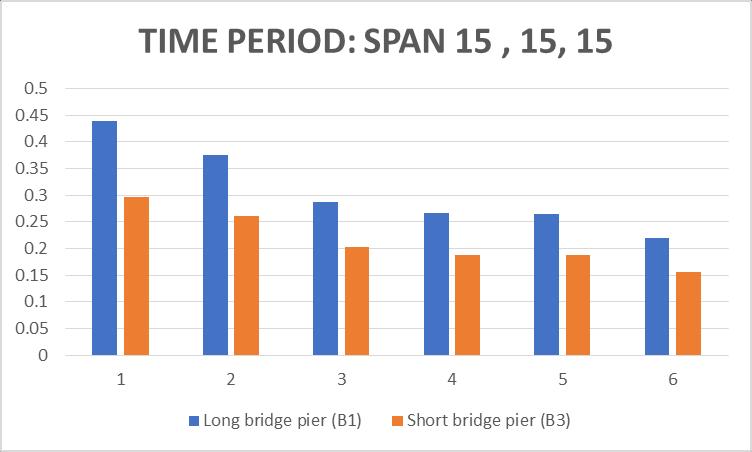
Fig.3.ModelB3
Factor value: 7.529 | ISO 9001:2008 Certified Journal | Page178
International Research Journal of Engineering and Technology (IRJET) e-ISSN: 2395-0056
Volume: 10 Issue: 01 | Jan 2023 www.irjet.net p-ISSN: 2395-0072
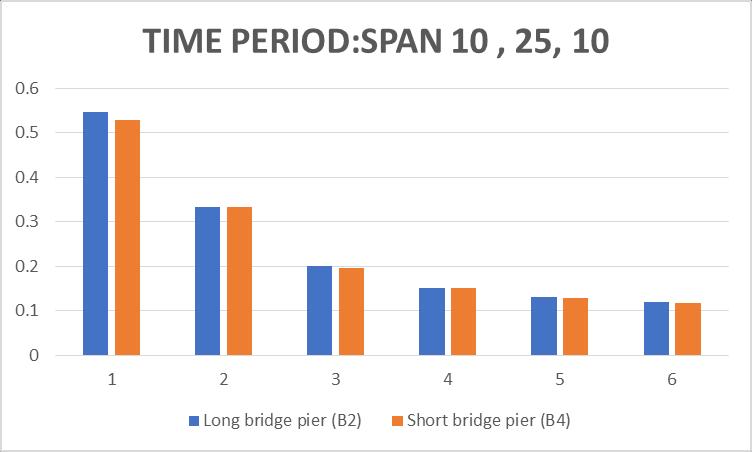
Table3.TimePeriod(SPAN10,25,10)
SPAN 10, 25, 10
Mode Long bridge pier (B1) Short bridge pier (B3)
1 0547 0529 2 0.334 0.334 3 02 0195 4 015 015 5 0131 0129 6 0119 0118
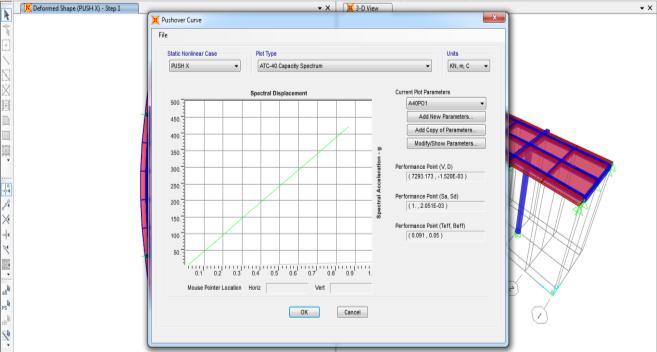
Fig6ModelB1:Push-overcurve
Fig7ModelB2:Push-overcurve
Graph.2.TimePeriod:Span10,25,10
As we can see in the above chart, it shows approximately spantime period 10,25,10 forlong bridge pillar(B2),short bridge pillar (B4). Almost all bridges report results for the sametimeperiod
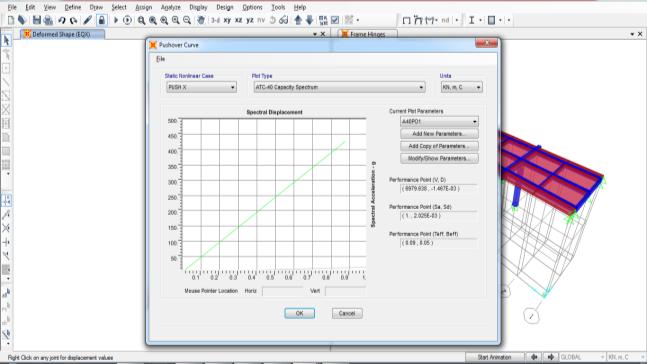
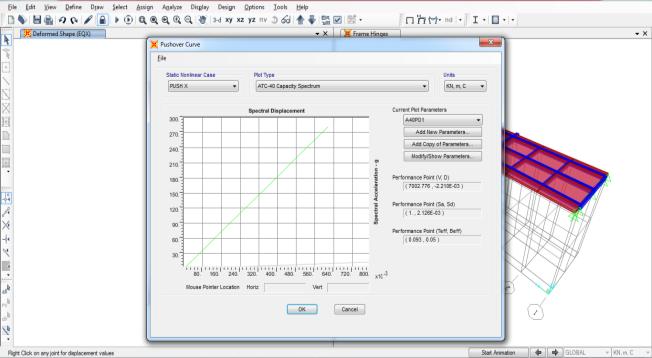
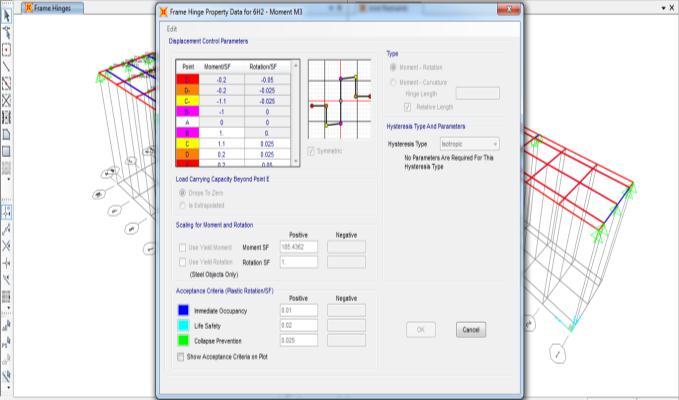
B. Pushover
Fig8ModelB3:Push-overcurve
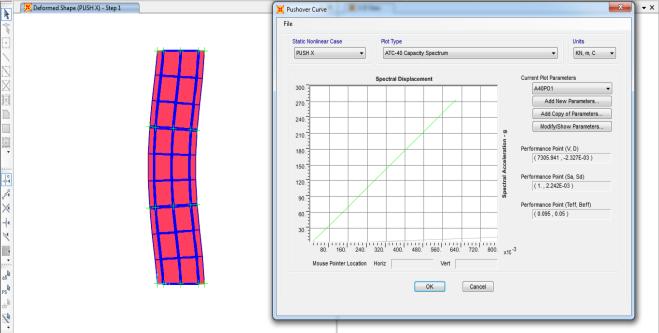
Fig5Framehingepropertydata
Fig9ModelB4:Push-overcurve
International Research Journal of Engineering and Technology (IRJET) e-ISSN: 2395-0056
Volume: 10 Issue: 01 | Jan 2023 www.irjet.net p-ISSN: 2395-0072
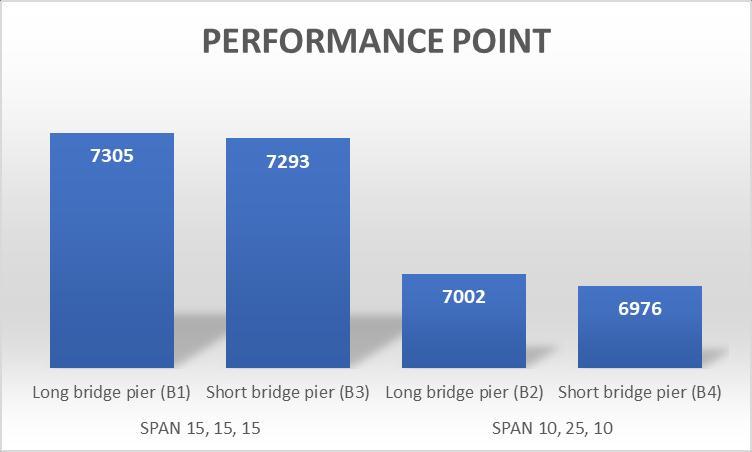
Table4.PerformancePoint
PerformancePoint
SPAN15,15,15
SPAN10,25,10
Longbridge pier(B1) Shortbridge pier(B3) Longbridge pier(B2) Shortbridge pier(B4) 7305 7293 7002 6976 Graph.3.PerformancePoint
A parametric study of bridges performed by varying pier heightandspanlengthinvariousbridgemodels. Atotal of6 TBeamBridgemodelswithbearinganddesignofthebridge andbearingsareanalysed.Atotalofsixmodelsofthebridge modelareconsideredwithequalandunequalspansandpier heights and analyse these modes in FEM software SAP2000 for various seismic analysis methods such as response spectrum, time history analysis, etc. to investigate and measuretheperformanceofthebridge.bridgewithdifferent span and pier condition, the analysis concluded that short pier height models are economical than unequal and long pier model in comparison, but compared to unequal pier models, they have equivalent results with short pier model, so bridge with unequal span and pier conditions are recommended for seismic design purposes, all final conclusionsaremadefromthefollowingresults
In the seismic coefficient method, the time period and the natural frequency of the bridge are compared, compared to the time period results for equal andunequal spans,thelongspanpiershaving a longer period than the Short and Irregular piers, the differences in the time period of the Short and Irregularpiersarearound15-20%.
slidingcapacitiesofthepiers.Theslidingcapacityis greater than all other models, the difference is around15-20%
[1] Ranjit S. Abeysinghe, EvgeniaGavaise, Marco Rosignoli, and TheodorosTzaveas, “PUSHOVER ANALYSISOFINELASTICSEISMICBEHAVIOROF
[2] GREVENIOTIKOSBRIDGE”, AmericanSocietyofCivil Engineers(ASCE),August2002
[3] Mohammad Farhan and MohdTasleem, “PUSHOVER ANALYSISOFREINFORCED
[4] CONCRETE BRIDGE PIER DESIGNED AS PER IRC-6 CODALPROVISION”,
[5] JournalofCivil&EnvironmentalEngineering,August 2020
[6] AmitKatkar,P.M.Kulkarni,“PARAMETRICSTUDYOF BRIDGEPIERS”,
[7] International Research Journal of Engineering and Technology(IRJET),Jan2018
[8] NileshShadunkey, RashmiSakalle, “COMPARATIVE STUDYOFEFFECTOF
[9] VARYING SPAN LENGTH ON MAJOR ELEMENTS OF METROBRIDGE”,
[10] International Research Journal of Engineering and Technology(IRJET), Sept.2019
[11] Chopra, A., Goel, R., and Chintanapakdee, C. (2003). ”StatisticsofSingle-Degree-of-
[12] Freedom Estimate of Displacement for Pushover Analysis of Buildings.” J. Struct. Eng., 129(4), 459–469.
[13] IS1893(Part1)–2002,“IndianStandardCriteriafor Earthquake Resistant Design of Structures, Part 1: General Provision and Buildings”, Bureau of Indian Standards,NewDelhi.
i. IS 456 : 2000 -Plain and Reinforced Concrete Code of Practice. - BUREAU OF INDIAN STANDARDS, NEW DELHI.
ii. IS 1893 : 2000 - Criteria For Earthquake Resistant Design Of Structures
In the Push-over analysis method, the bridge's sliding capacity is compared with the results of the