International Research Journal of Engineering and Technology (IRJET) e-ISSN: 2395-0056 Volume: 10 Issue: 01 | Jan 2023 www.irjet.net p-ISSN: 2395-0072

International Research Journal of Engineering and Technology (IRJET) e-ISSN: 2395-0056 Volume: 10 Issue: 01 | Jan 2023 www.irjet.net p-ISSN: 2395-0072
1
, Dr. Ramakrishna Hegde2
1Research Scholar, Dept. of Civil Engineering, Srinivas University Institute of Engineerng and Technology, Karanataka, India
2Professor, Dept. of Civil Engineering, Srinivas University Institute of Engineerng and Technology, Karanataka, India ***
Abstract - EARTHQUAKES POSE A SIGNIFICANT THREAT TO HUMAN ACTIVITY IN MANY PARTS OF THE WORLD, NECESSITATING CAREFUL CONSIDERATION WHILE BUILDING STRUCTURES AND VITAL INFRASTRUCTURE. ABUILDINGORFACILITYSHOULDBEABLETOSUSTAIN
A CERTAIN AMOUNT OF SHIFTING WITHOUT SUFFERING SIGNIFICANT DAMAGE. THIS IS THE GOAL OF EARTHQUAKE-RESISTANT DESIGN. A DESIGN GROUND MOTION PARAMETER DESCRIBES THE DEGREE OF SHAKING THE QUANTITATIVE ASSESSMENT OF THE RISKS ASSOCIATED WITHGROUNDSHAKINGATACHOSENSITEISACOMPONENTOFSEISMIC
HAZARD ANALYSIS WHEN EVALUATING SEISMIC HAZARDS, UNCERTAINTIES REGARDING THE SIZE, LOCATION, FREQUENCY, AND IMPACTS OF EARTHQUAKES CAN BE EXPLICITLY TAKEN INTO ACCOUNT USINGAPROBABILISTICSEISMICHAZARDANALYSIS
Key Words: Probabilistic Seismic Hazard Analysis, Ground motion parameter, Quantitative estimation
In the past century, India has had some of the largest earthquakesintheworld.TheentireHimalayanbeltmakes the north-eastern part of the country susceptible to large earthquakes with a magnitude greater than 8.0. It is impossibletochangetheseismicrisk,orthepossibilitythat a place would suffer ground motion as a result of an earthquake. Making artificial systems and structures less vulnerableandmorerobusttowithstandthebottommotion frequentlyreducestheprobabilitythathumanhabitatwould experienceearthquakes.Acharacteristicofseismicdangeris thatitgrowsovertime.
Quantifying the rate (or chance) of surpassing different groundmotionlevelsatalocation(oramapofsites)given all potential earthquakes is the aim of seismic hazard analysis(SHA).Cornellwasthefirsttoformallyestablishthe numerical/analyticalmethodtoPSHA(1968).
2003's(Parvezetal.)Aseismichazardmapoftheterritory ofIndiaandtheadjacentterritorieshasbeenmadeusinga deterministic approach based on the computation of syntheticseismogramscompletewithallnecessaryphases. Inordertocreateadeterministicseismichazardmapforthe Indian region, this effort is the first to use realistic strong ground. For the Indian subcontinent, there aren't many probabilistichazardmapsavailableSyntheticseismograms
withafrequencyof1Hzhavebeencreatedonaregulargrid of0.20.2usingthemodalsummationtechnique.Overthe area under consideration, the maximum displacement (Dmax), maximum speed (Vmax), and design ground acceleration(DGA)oftheseismichazardhavebeengathered anddisplayedonaregulargrid.Theestimatedpeakground accelerationvaluesmatchtheHimalayanregion'sobserved dataextremelyclosely.TheDGAlevelsarehigherthan0.6g inafewareasoftheHimalayanregion.Theepicentralareas ofthebigAssamearthquakesof1897and1950innortheast India suggest the most danger with DGA levels exceeding 1.2-1.3g.
(2007) Anbazhagan Panjamani et al. The results of the probabilisticseismichazardanalysis(PSHA)forBangalore, SouthIndia,arepresentedinthispaper.Theseismotectonic characteristicsofthe350kmradiusencirclingBangaloreas thecentrewereusedintheanalyses.Inlightofthecurrently availableearthquakedata,theseismichazardparameter"b," whichmakesuseofstrictandextensivecatalogues,hasbeen evaluatedusingtheGutenberg-Richter(G-R)connectionand the Kijko and Sellevoll (1989, 1992) approach. The G-R relation and the Kijko and Sellevoll technique both gave estimatesforthe'b'parameterof0.62to0.98and0.870.03, respectively. The results are marginally better than the previously published "b" values for southern India. Six seismogenic sources were considered in a probabilistic estimateoftheseismicthreatintheBangalorearea.Fora 10% probability of surpassing in 50 years, the quantified hazard values for the rock level peak ground acceleration (PGA)areshownonagridwithasizeof0.5kmby0.5km.
Factor value: 7.529 | ISO 9001:2008 Certified Journal
International Research Journal of Engineering and Technology (IRJET) e-ISSN: 2395-0056
Volume: 10 Issue: 01 | Jan 2023 www.irjet.net p-ISSN: 2395-0072
ofpastearthquakes(circles).Thecolouranddiameterof thecirclessignify,respectively,depthandmagnitude.Red starsdenotesignificantoccurrencesfromtheprevious50 years.
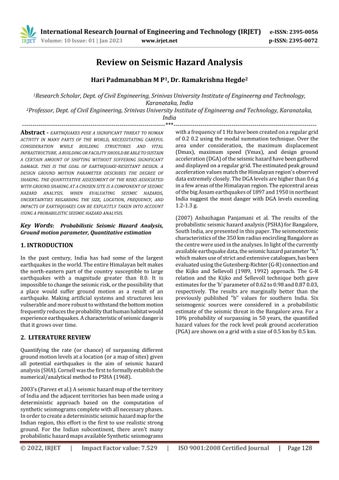
(2008) Boominathan et al. a thorough investigation to evaluate Chennai's seismic risk using a deterministic methodologyWithina100kmradiusofthestudylocation, seismicityandseismotectonicfeatureshavebeentakeninto consideration.Theequivalentlineartechniquewasusedin conjunctionwiththeSHAKE91programmetoestimatethe groundmotionparameterswhiletakingintoaccountlocal site effects for the one-dimensional ground response analysis for 38 typical sites. Corrected blow counts were used to infer the shear wave velocity profile, and the Multichannel Analysis of Surface Wave (MASW) test on a typicalsitewasusedtocorroborateit.
Figure - 1: PeninsularIndiaisthestudyarea,and geotectonicfeaturesarepresent.
2007; Lindholm et al. Peninsular India is given a new probabilistic seismic hazard assessment (PSHA). Three distinctrecurrencemodels agridmodel,afaultmodel,and a traditional seismic zonation model have been used to performthePSHA.Thecreationofagridmodelbasedonan adaption of the Kernel-based method and a nonparameterizedrecurrencemodel,whichhaven'tbeenusedin thisfieldbefore.Forboththestablecontinentalcrustandthe activecrustintheGujaratregion,threerelevantattenuation relationshavebeentakenintoaccountintermsofspectral acceleration.(AlthoughPeninsularIndiahasseenafewlarge earthquakes, like those at Latur and Jabalpur, it typically representsastablecontinental zonewithlittleearthquake activity,asshownbyourhazardresults.Ontheotherhand, ouranalysisrevealsthatboththeKoynaandGujaratregions haveasizableriskofearthquakes.a10%overage'smaximum groundacceleration.
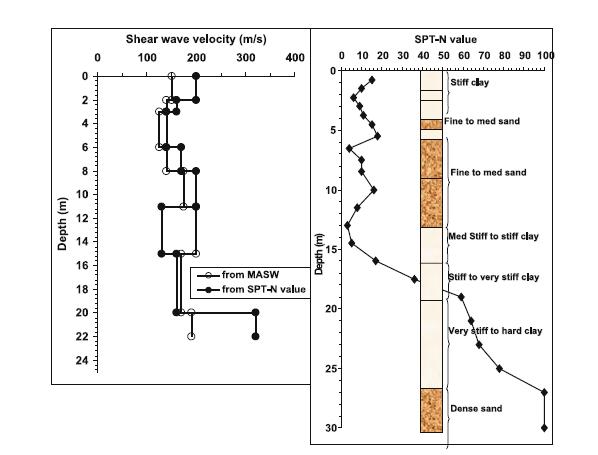
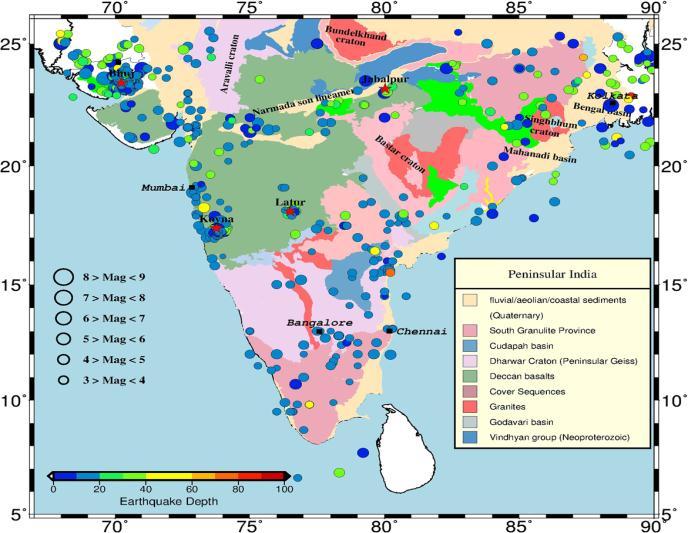
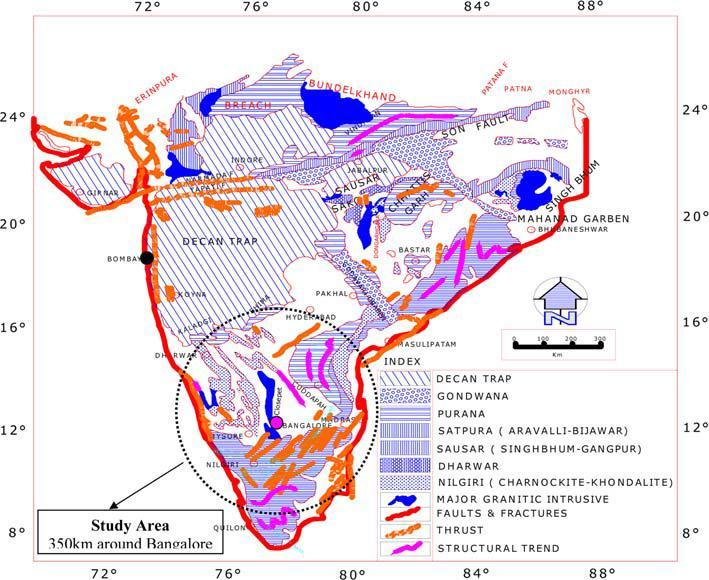
Figure - 3: Shearwavevelocitychangeswhenthesite's borelogchanges.
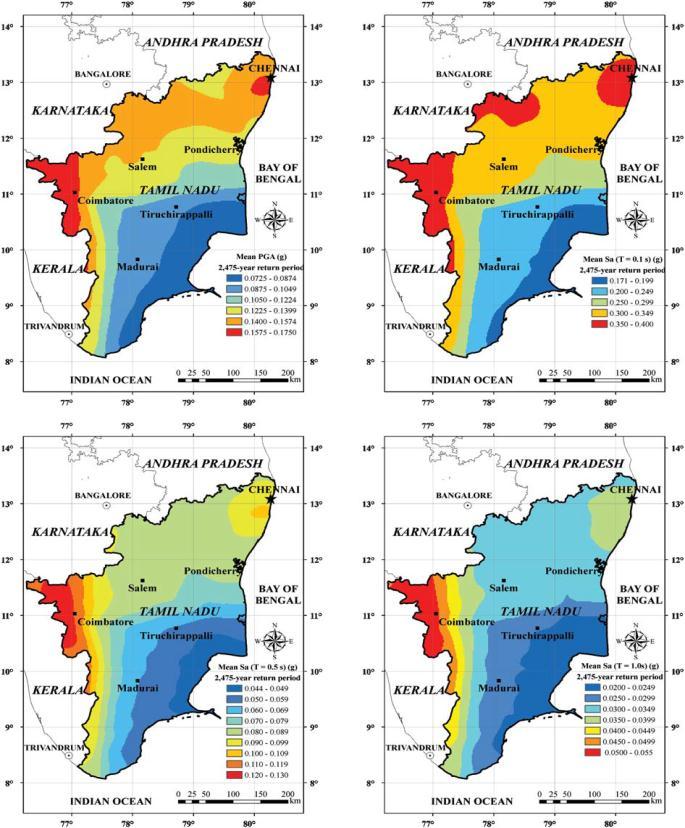
(2010)Menonetal.Aprobabilisticseismichazardcontour mapisproducedforTamilNaduandtheunionterritoryof Pondicherrybasedontheground-motionparameters,PGA and spectral accelerations, at 0.1, 0.5, and 1.0 sec for 2 percent,5percent,and10percentlikelihoodofexceedance duringa50-yearperiod.Agridofplacesspaced0.2degrees apart has been used to calculate the area's hazards. A thoroughdatabaseofearthquakesthatoccurredbetween68 and88°Elongitudeand2to20.7°Nlatitudeovera950-year periodhasbeenassembled.Theground-motionpredictive equations for shallow crustal intraplate environments, catalogue completeness estimation methods, maximum cutoffmagnitude,andprobabilityhazardanalysistechniques are all taken into consideration when creating the hazard maps.Theseismiccode'srecommendedzoningiscontrasted with the danger maps. According to the most recent estimates,theIndianStandards'broadzoningsignificantly understatestheseismicriskinmanyareasofthestate.
Figure - 2: TheGeologicalMapofIndia(GSI2000),which depictsthegeologyofPeninsularIndia,includingthesites
International Research Journal of Engineering and Technology (IRJET) e-ISSN: 2395-0056
Volume: 10 Issue: 01 | Jan 2023 www.irjet.net p-ISSN: 2395-0072
Figure 4 - : TNhazardmapswitha10%chanceof surpassingin50yearsforPGAandspectralaccelerations at0,5,and1secstructuralperiods.
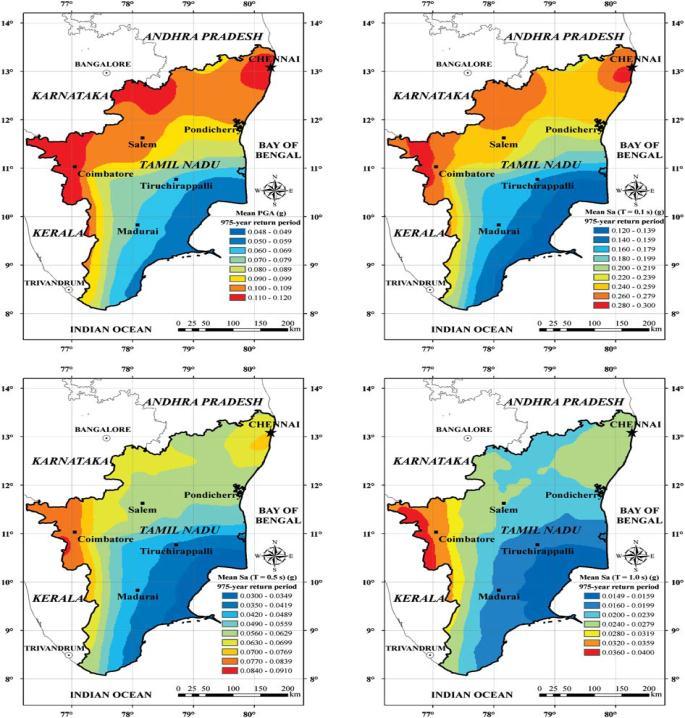
Figure 5 - : TNhazardmapswitha5%likelihoodof surpassingin50yearsforPGAandspectralaccelerations at0.1,0.5,and1.0secstructuralperiods.
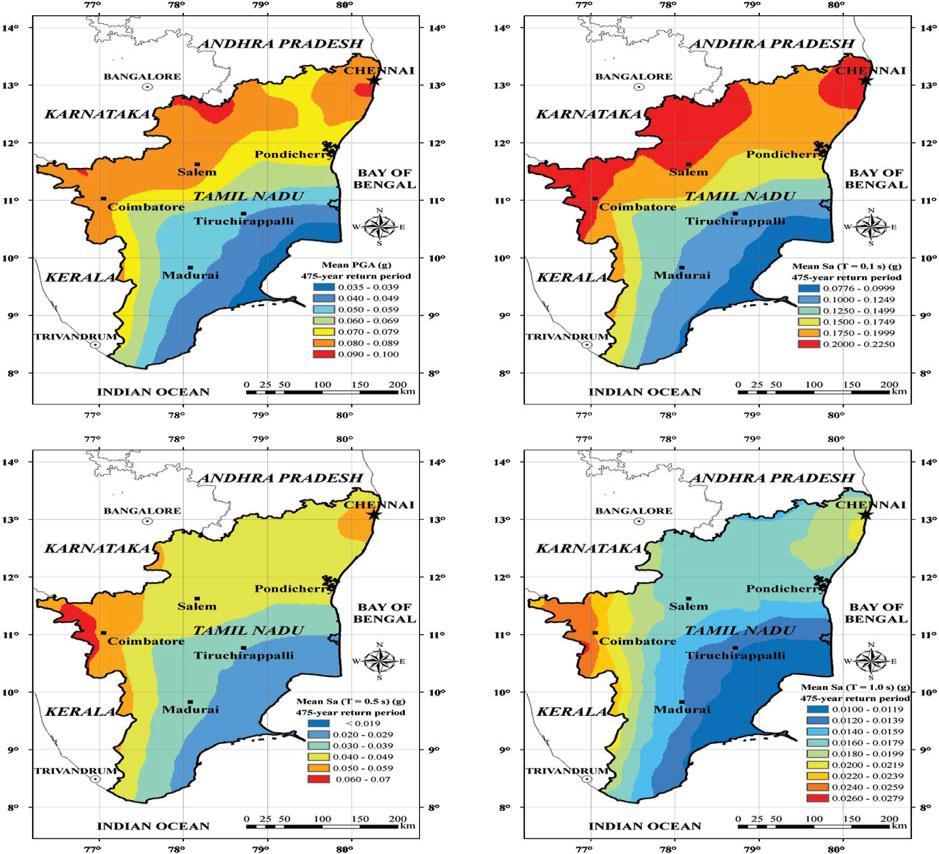
Figure 6 - : TheTNhazardmapsforPGAandspectral accelerationsat0.1,0.5,and1.0secstructuralperiods showthatthereisa2%chanceofsurpassingin50years. (2012)SreevalsaKolathayaretal.Onthebasisofthemost recent seismicity data (up to 2010), the results of a deterministicanalysisoftheseismichazardinIndia(6-38N and 68-98 E) are evaluated. The hazard analysis, which consideredthedifferenttectonicprovincesinthearea,used twelvewell-knownattenuationrelations.Atotalof27,146 earthquakeswithamomentmagnitudeof4orhigherwere discoveredintheresearchregionaftertheearthquakedata fromvarioussourceswashomogenisedanddeclustered.By takingintoaccountthefaults,lineaments,andshearzones connected to earthquakes of magnitude 4 and higher, the sesismotectonic map of the research area was created. In MATLAB,abrand-newtoolforsmoothingwascreated.The studyareawasdividedintoincrediblysmallgridsof0.10.1 (or around 10 10 km) size to measure the seismic threat. Then, at the centre of each of these grid cells, the danger parametersweredeterminedbyaccountingforallseismic sourceswithina300–400kmradius.Usingadeterministic methodandMATLABcode,thepeakhorizontalacceleration (PHA)attherocklevelandthespectrumaccelerationsfor periods 0.1 and 1 s have been determined for each grid point.Alogic-treemethodhasbeenusedtoaccountforthree potential attenuation models and two alternative source types for each grid point in order to overcome epistemic uncertaintyinhazarddefinition.Tocomparetheoutcomes, the evaluation of danger without using the logic tree approachwasalsocompleted.
International Research Journal of Engineering and Technology (IRJET) e-ISSN: 2395-0056
Volume: 10 Issue: 01 | Jan 2023 www.irjet.net p-ISSN: 2395-0072
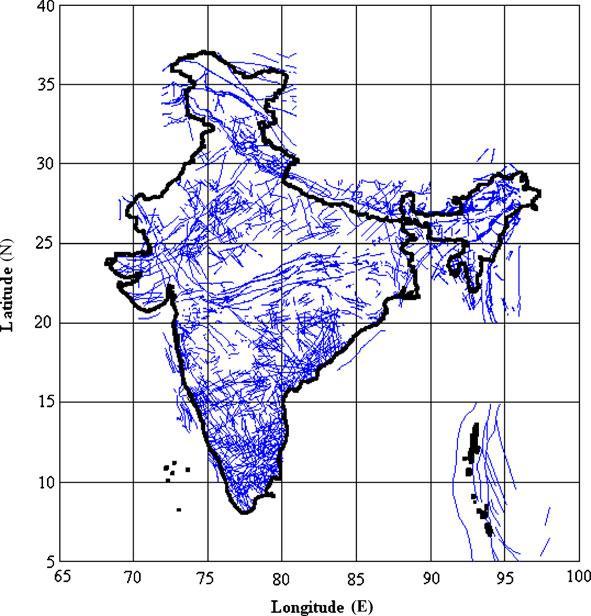
Figure 7 - : India'slinearseismicsourceshavebeenfound
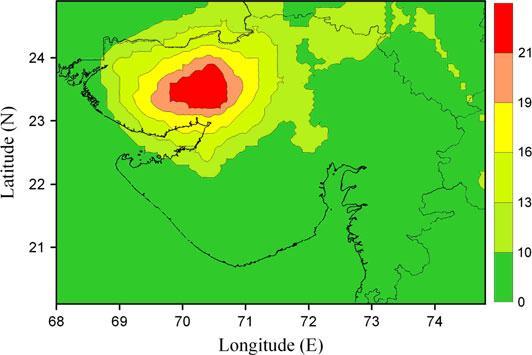
(2013)Vipinetal.TheprobabilityofGujarat'sseismicrisk wasassessedusingalogictreeframework,whichreduces thedegreeofambiguityinriskassessment.Peakhorizontal acceleration (PHA) levels and spectral acceleration (Sa) values have each been assessed for a 10% and 2% risk of being reached in the next 50 years. Site amplification and liquefaction, two significant geotechnical impacts of earthquakes,arealsoassessedwhiletakingintoaccountsite characterisationbasedonsiteclasses.Usingperformancebasedcriteria,theliquefactionreturnperiodfortheentire stateofGujaratisassessed.ThemapsofPHAandPGAvalues generatedbythisstudyareextremelyhelpfulforlowering thearea'sseismicriskinthefuture.
Figure 8 - : A475-yearreturnperiodrequires geographicalvarianceinN1,60,cslevelstoprevent liquefaction.
(2014)(Anbazhaganetal.ThePatnadistrictseismichazard maps use both worst-case deterministic and conventional probabilistic methods to account for the ground motion prediction equations (GMPEs) and maximum magnitudes thatareuniquetotheregion).Devastatingearthquakes,such astheBihar-Nepalquakesof1803and1934,haveoccurred closetotheHimalayanactiveseismiczone,whichliesnearto Patna. Linear sources and seismic events have been estimatedto be500kilometresfrom the districtcentre of Patnabasedonhistoricalseismicityandearthquakedamage dispersion. Regional rupture features, the Kijko approach, andthemaximumobservedmagnitude(Mmaxobs)haveall beenusedtodeterminethemaximummagnitude(Mmax). Foreachsource,thehighestofthesethreeisconsideredas themaximumlikelymagnitude.27groundmotionprediction equations (GMPEs) are found to be suitable for the Patna region.The"efficacytest,"whichemployslog-likelihood,is usedtochooseappropriateregion-specificGMPEsfromthis group. To map for the worst-case deterministic approach, the 2 and 10% period of exceedance in 50 years, and to estimate the PGA and spectral acceleration at 0.2 and 1 s, maximum magnitude and chosen GMPEs are employed. Furthermore,thedeaggregationgraphiciscreatedusingthe seismic hazard results to calculate the magnitude and distance of the contribution of the seismic sources. To estimate PGA and spectral acceleration at 0.2 and 1 s and mapfortheworst-casedeterministicapproachandthe2and 10%periodofexceedancein50years,maximummagnitude andchosenGMPEsareemployed.
International Research Journal of Engineering and Technology (IRJET) e-ISSN: 2395-0056
Volume: 10 Issue: 01 | Jan 2023 www.irjet.net p-ISSN: 2395-0072
2016 (NitishPuri et al.) The seismic study region has had seismicsources.Eachseismogenicsourcehasbeengivenits maximal magnitude. The National Disaster Management Authority of India developed a ground motion prediction equation for the Indo-Gangetic area. Peak ground accelerationandreactionspectrumhavebeencalculatedfor the state's A-type sites using cutting-edge deterministic seismichazardanalysismethods.Inordertovalidatethem for further practical application. Calculation of seismic loading of the construction of earthquake-resistant structures in Haryana, the produced spectra can also be employed.
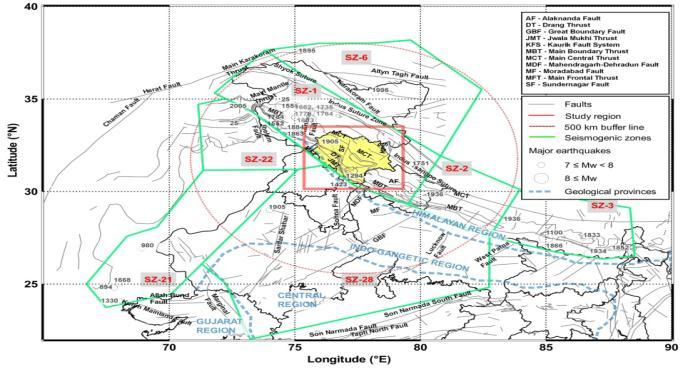
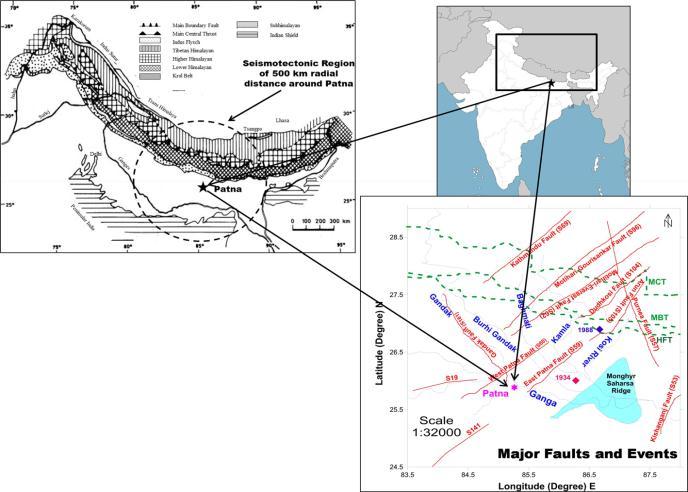
Figure 9 - : ToestimatePGAandspectralaccelerationat 0.2and1sandmapfortheworst-casedeterministic approachandthe2and10%periodofexceedancein50 years,maximummagnitudeandchosenGMPEsare employed.
ToestimatePGAandspectralaccelerationat0.2and1sand mapfortheworst-casedeterministicapproachandthe2and 10%periodofexceedancein50years,maximummagnitude andchosenGMPEsareemployed,hasalikelyseismichazard specifictothatsitebasedonthegroundmotionconnections reportedinacompanionstudy(PrabhuMuthuganeisanetal. 2016).Seismicrecurrenceparametersarecalculatedforall known likely sources using an updated earthquake inventory.Forreturndurationsof475and2475years,the contourmapsoflikelyspectralaccelerationat0s,0.2s,and 1 s (5 percent damping) are shown. To estimate PGA and spectralaccelerationat0.2and1sandmapfortheworstcase deterministic approach and the 2 and 10% period of exceedance in 50 years, maximum magnitude and chosen GMPEsareemployed.Additionally,thehazardlevelsinthe areasclosetoBilaspurand Chamba are higher than those describedintheliterature.
2017 (Anbazhagan et al.) Using probabilistic and deterministictechniques,aseismichazardmapforKanpur city is created that accounts for the area's distinct seismotectoniccharacteristicswithina500-kmradius.Using theregionalrupturecharacteristicstechnique,thegreatest probable earthquake magnitude (Mmax) for each seismic source has been calculated and compared to the highest magnitudeactuallyfeltusingtheMobsmax,Mobsmax+0.5, andKijkotechniques.Based ontheresultsofthe"efficacy test," the top 27 applicable ground motion prediction equations(GMPE)wereselected.Additionally,variousMmax values and the chosen GMPE were given varied weight factors in order to determine the final hazard value. For worst-case scenarios with 2 and 10% probabilities, peak groundaccelerationandspectralaccelerationat0.2and1s were computed and mapped. Peak ground acceleration (PGA)forDSHA,2and10percentprobabilityin50years, and DSHA varied from 0.04 to 0.36 g, 0.02 to 0.32 g, and 0.092 to 0.1525 g, respectively. Three vulnerable sources weretakenintoaccountwhendevelopinganormalisedsitespecificdesignspectrumbasedondeaggregationatthecity centre.Theoutcomesarecontrastedwiththemostrecent earthquakes,whichoccurredinSikkimin2011andNepalin 2015,aswellaswiththeIndianseismiccodeIS1893.
Figure 10 - : PGAandspectralaccelerationat0.2and1s tobeestimated,andmappingfortheworst-case deterministicapproach,the2and10%periodof exceedancein50years,maximummagnitudeandchosen GMPEsareemployed.
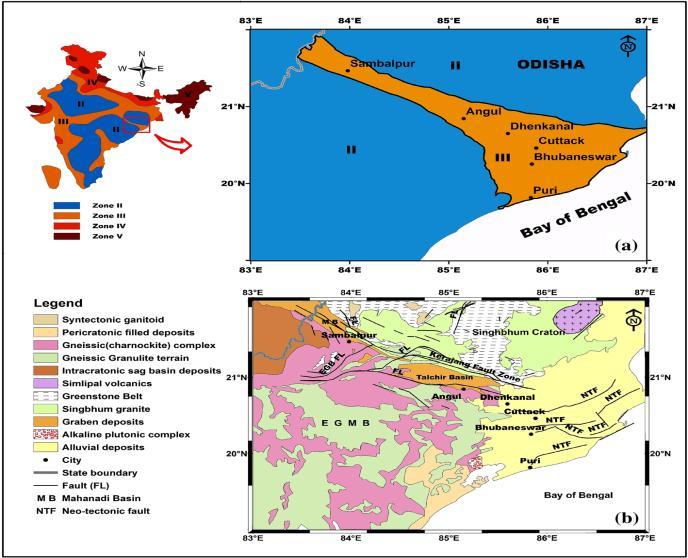
2017 (Dhar et al.) earthquake risk brought on by the amplified seismic waves in coastal Odisha. By analysing geomorphological features and the thickness of the unconsolidated soil layer, seismic dangers have been assessed.Determininglocationswithahighlikelihoodof accumulating loose, unconsolidated sediment as well as other factors that affect the deposition of loose, unconsolidated soil in the area required morphometric analysisoftheDEMdata.ForthecoastalregionofOdisha, a soil amplification susceptibility map has been created using the weighted overlay method. Seismic activity is strongly structurally controlled in the Mahanadi basin. Isoseismic patterns may lengthen due to lineament patterns,whichareprimarilydirectedintheWNW-ESE, NE-SW,andNNW-SSEdirections.
International Research Journal of Engineering and Technology (IRJET) e-ISSN: 2395-0056
Volume: 10 Issue: 01 | Jan 2023 www.irjet.net p-ISSN: 2395-0072
[3]RanjeetJoshietal.(2020),“ProbabilisticSeismicHazard AnalysisofMadhyaPradesh(CentralIndia)UsingAlternate SourceModels:ALogicTreeApproach”, Asian Journal of Civil Engineering, Vol.21P.No.1399-1414
[4] Ayodegi Adekunle Eluyemi et.al. (2020), “Preliminary Analysis of Probabilistic Seismic Hazard Assessment for NuclearPowerPlantSiteinNigeria”, Scientific African,Vol.8, Article e00371
[5] Muhammad Muzzaffar Khan et. al. (2019),“ Seismic HazardCurvesforWarangalCityinPeninsularIndia”, Asian Journal of Civil Engineering,Vol.21,P.No.543-554
[6]R.Ramakrishnanet.al.(2019),“SeismicHazardAnalysis andLandUseAnalysisofMangaloreCity,Karnataka,India”, Journal of Earthquake Engineering,Vol.5,P.No.1-22
Figure 11- : AmodifiedversionoftheIndianmapfrom BIS1893–2002showingthestudyregion'slocationand thegeologyofcoastalOdishainandaroundseismiczone III.
Conclusions reached after conducting a literature review. With the exception of anomalous source areas, stable continentalregions(SCRs)weretypicallybelievedtobefree fromtheriskofpossibleearthquakes.PeninsularIndiaisone oftheoldestandseismicallymoststablelandmassesofthe Indian plate,locatedatlatitudes10to28°Nand68to90° E.However,recentseismichistoryrevealsthatthisareahas beenthesiteofmorethanfivedestructiveearthquakeswith magnitudesmorethanMw6.0,underscoringthesignificance of seismic hazard assessment for the area. Since Cornell establishedthetechniqueforcalculatingseismicdanger,it hasundergoneextensivedevelopmentandimplementation (1968). The advantages of probabilistic seismic hazard analysis (PSHA) are well known. Depending on how one specifies the seismicity model, the PSHA can be done in a number of different ways. Proper assessment of the territory'sseismichazardisnecessaryfordeterminingthe likelihoodoffuturedestructiveearthquakes,whichisoneof therepercussionsofearthquakesinaregion.
[1] Gonavaram Kalyan Kumar et. al. (2020), “Site-specific ProbabilisticSeismicHazardAssessmentforProposedSmart City, Warangal”, Journal of Earth System Science, Vol. 129, Issue4
[2]Ranjitdaset.al.(2020),“AprobabilisticSeismicHazard Assessment of Southern Peru and Northern Chile”, Engineering Geology,Vol.271
value: