PARAMETRIC STUDY ON SLAB DECK BRIDGES USING RESPONSE SURFACE METHOD
Shashidhar N1, Ashwini G2
1P.G Student, Civil Structural Engineering Department, East West Institute of Technology, Bangalore
2Associate Professor, Faculty of Civil Engineering, East West Institute of Technology, Bangalore ***

Abstract - This paper is a parametric study is carried out on slab deck bridges by using RSM method. In order to discern the dependency of span, live load and thickness of wearing coat on all the aspects of the analysis and design of the slab deck bridges. After obtaining various design combinations of parameters/variable, design of slab deck is carried out by EXCEL program. An EXCEL program is generated to design deck slab by considering all the parameters in both working stress and limit stress method as per IRC 21:2000 and IRC 112:2011 respectively. The results obtained by EXCEL program are updated in the optimization model and ANOVA test is carried out to discern the dependency of variables. Set of linear equations are obtainedbyconsidering threeandtwoparameters.
Key Words: Bridges, cross obstruction, Slab Deck Bridge, Response Surface Method, fabrication of form work, reinforcement, placement of concrete.
1. INTRODUCTION
In this study statistical approach is carried out to obtain optimum depth, moment and area of reinforcement of the decks slab by using statistically planned analytical program. By the parametric study various design parameters are considered such as span, live load and thickness of the wearing coat. To discern the dependency of these parameters on depth, moment and area of reinforcement Response Surface Method (RSM) is used. For all the unique design combination obtained RSM, designofdeckslabiscarriedoutbyEXCELprogram.
The regression model was developed using the analytical dataAnalysisofVariance(ANOVA)fordepth,momentand areaofreinforcementintermsofthethreedesignfactor.
1.1 SCOPE OF THE STUDY
The response equations are being obtaining for spans varying from 4m to 9m. The type of bridge of bridge considered is single span deck slab bridge with two lane
carriageway.ThedesignofslabiscarriedoutIRCworking stressandeventhelimitstatemethodasperIRC21:2000 andIRC112:2011respectively.AnEXCELprogramisused for the deck slab design. For the design of two lanes RC deck slab two load cases 1 and 2 as per IRC 6:2014 considered. The slab has to be designed for maximum of thetwocases.Thethicknessofthewearingcoatislimited to25to75mm.Theregressionequationsareobtainedbya generating optimizations model. The method of response surface is used to obtain the dependency of variable responsebyusingDESIGNEXPERTv6.0.8isoftware.
2. BRIGE REVOLUTION
Bridge is defined as a structure constructed to cross obstruction.Theobstructionmayberiver,valley,roadway, and railway. The bridges have been constructed from the earlyhumancivilizationspreadoverseveralcenturiesago. Thefirstbridgewasconstructedbytimbertrestletocross river around 400 B.C. Later stone slabs were used to constructthebridgesaround2800B.C.Stonearcheswere widely constructed by roman’s using massive piers in the periodof200B.C.to260A.D.ThePontd’Avignonandold Londonbridgeswereconstructedbyarchesinthe11th and 12th century. In the mid-19th century use of cast iron and wrought iron started for construction of bridges in order to make bridges stronger and bigger. The use of iron replacestheuseof timberandstone for bridges.After the inventionofpre-stressedconcretein1928,itisusedinthe constructionofbridgesforincreasedspanduring1950.
ThecombinationofConcrete,IronandCableswereusedto buildmodern bridgesandcanbeusedto build them from very small size up to incredible length that covers the whole mountain, rough landscapes, lakes, and even the seas.
2.1.1 TYPES OF BRIDGES
i. BeamBridge.
ii. ArchBridge.
iii. TrussBridge.
iv. CantileverBridge.
v. SuspensionBridge.
vi. CableSlayedBridge.
2.1.2 REINFORCED CONCRETE DECK SLAB
A bridge with an upper horizontal beam that carries roadway or railway is called “deck” of the bridge. In a reinforced concrete deck slab bridge, decks are constructed by reinforced concrete. Reinforced concrete deckslabbridgesareeconomicaluptospan8m,thoughit can be used up to 10 m. The thickness of the deck slab increases as the span increases. The construction is comparatively simpler due to easier fabrication of formwork and reinforcement and easier placing of concrete. This type of bridges can be used for both highwayandrailway.
2.1.3 DECK SLAB
Deck slab is the main element of the bridge, which is supportedupontheabutmentsorpiers.
It is perhaps constructed from concrete, the steel or even wood. The deck slabactsa shieldto enablethepassage of vehicles, since it is covered by asphalt concrete. The deck slabissketchedoutasa one-wayslabtocarrydeadalong with live load with visible impact. As per Independent Review Committee 6 2014 National Highway deck slab is designed to carry Independent Review Committee CLASS AA or a type vehicle loads whichever gives the maximum worst effect. As per Independent Review Committee 7.5m width of carriage is to be provided for two lanes with raisedKerbsofRoad.
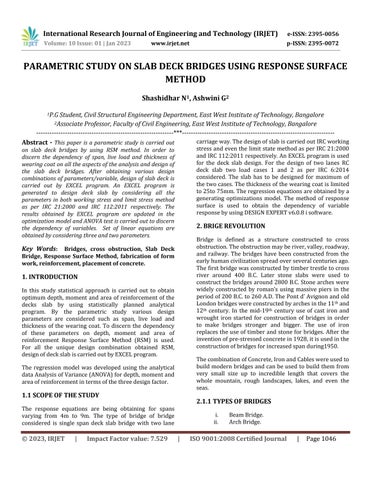
3.1 ABUTMENTS, WING WALL AND APPROACH SLABS
Abutment is a sub-structure component of bridge, and it acts as a support to the bridge. Abutments are the structuralelementswhichcarrythedeckofthebridgeand transfer the load into foundations. Opposite supports are called as Abutments whereas intermediate supports are called as Piers. This abutment prevents the lateral movement of earthen fill of the bridge approach and acts asaretainingwall.
Wing walls are the small walls attached at both ends of abutments to retain the earth. Wing walls are constructed using same material used for abutments. The wing walls maybeattachedtoabutments,oritmaybeindependent.
Approach slab is a medium which connects roadway pavement and bridge. It observes the impact load of vehiclespassingfromroadwaytobridge.
3.2 FRONT ELEVATION OF THE DECK SLAB BRIDGE
3.2.1 METHODOLOGY OF STUDY
Parametricstudy
Selectionofparameters
Optimizationstudy
Designofdeckslab
Statisticalanalysis
Optimizationmodel
Datafromexistingslab
deckbridge
Comparitivestudy
Variables
Description /details of variables
Span 4m,5m,6m,7m,8mand9m
Live load combination asperIRC6:2014
Case1
Case2
3.2.2 DESIGN OF EXPERIMENT

Design of Experiments (DOE) is a unique approach which helps in arriving at the relationship amongst the factors influencing a process and thereby the result of that particular process. Design of experiments is mainly a statistical method, it has different name such as experiment design methods using statistics and statistical factorial design methods and empirical methods. The methods comprise of models with fitted empirical values to the given data. Each response can be expressed as an algebraicfunction.Thedesignofexperimentiscarriedout by“DESIGNEXPERTv6.0.8i”software.
There are four important areas of general engineering in whichDOEcanbeapplied:
Comparative
Screening orCharacterizing
Modeming
Optimizing
3.3 STATISCTICAL ANALYSIS
Statistical analysis is done with the help of Analysis of Variance.ANOVA is a group ofstatistical modelsand the estimation procedures which are associated (namely the "variation" among and also between the groups) used in analysing the differences amongst the group in asample.ANOVA helps us to find out if there are any statistically occurring significant differences occurring between any of the means of three or more independent
groups. The ANOVA test helps to compare more than two groups at single time to arrive at conclusion whether a relationship is existing between them. The findings of the ANOVA is that, the F statistic (also called the F-ratio), provides an allowance of multiple groups of data to be analysed and to determine any delectation between samples and within samples. If potential difference does not exists between these test groups, which is termed as thenullhypothesis.TheresultofthisANOVA'sF-ratiowill becloseto1.Fluctuationoccurringinthesamplingismore likely follow the Fisher F distribution. Inthe probability theoryandstatistics, theF-distribution, also called asSnedecor'sFdistributionor theFisher–Snedecor distributionis acontinuous probability distributionthat emergesroutinelyasthenulldistributionofateststatistic intheANOVA.
4.1 OPTIMIZATION MODEL AND STUDY OF EXISTING BRIDGE
From the ANOVA linear regression equations were obtainedtofindthedepthoftheslabdeck,designmoment andareaofreinforcementforRCdeckslab.Rsquarevalue and adjusted R square value shows how better the data pointsfitacurve.
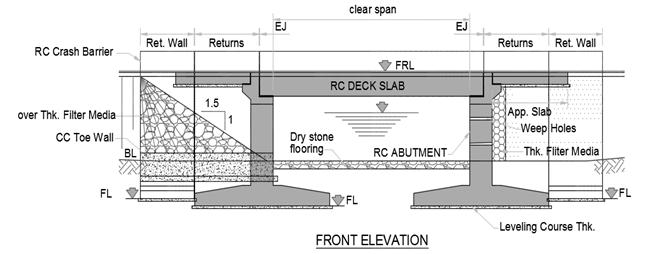
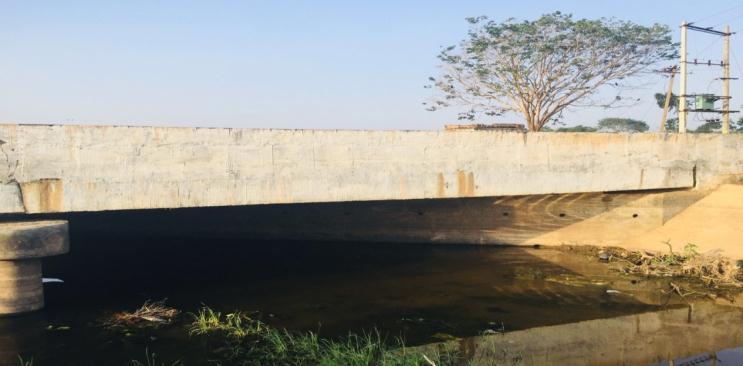
The two lane state highway bridge is located in Krishnarajanagara, Mysore highway, Karnataka is shown infig.4.1
4.2 DATA FROM EXISTING DECK BRIDGE
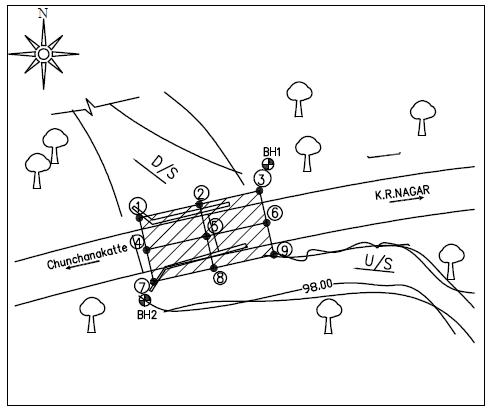
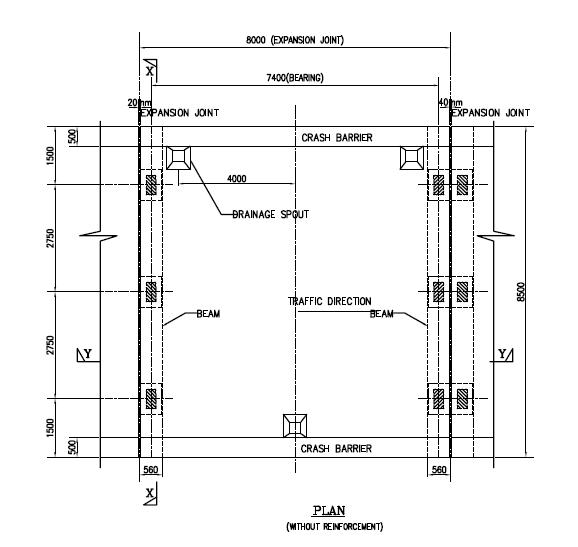
RecentlyconstructedRCslabDeckBridgewereselectedas explained in the previous section. Field visit has been carried to obtain various data like span, width of carriage way etc. Including the field data, a structural drawing of the same bridge is collected for the RC detailing of the bridge. Fig 4.21 and 4.22 shows the different views of the RCbridgeconsideredinthestudy.
The structural drawing various data obtained which cannot be measured at the site. From the drawing it’s obtained that depth of the slab is 650mm, diameter of 20 mm bars at 100 mm c/c spacing is provided as tensile reinforcement (bottom). Width of bearing is 560 mm and thicknessof wearingcoat providedis 50 mm.M30and Fe 415gradeofconcreteandsteelprovidedrespectively.
4.3 COMPARITIVE STUDY
The results obtained from the statistical analysis such as depth of deck slab, design moment and area of reinforcement of deck slab were compared with the existing RC slab deck bridge, as shown in fig. 4.31 and fig 4.32

5. RESULTS
By using design of experiments, analysis of variance is carried out to discern the dependency of span, live load combinationandthicknessofwearingcoatonthedepthof slab , design moment and area of tensie reinforcement of the slab. By using RSM various design combinations are obtained.AnEXCELprogramhascarriedouttoobtain the depth,moment and area of reinforcement for design combinations obtained be RSM.The design of slab deck is carriedoutforallthecombinatinbyusingEXCELprogram. The reponses obtained for the correseponding design combination is updated in the DESIGN EXPERT and ANOVA test is carried out to obtain linear equations. The linear regression eqation is obtained in both working stressandlimitstressmethod.
5.1 RESULTS OF RSM AND ANOVA FOR VARIOUS COMBINATION IN WORKING STRESS METHOD
By considering various combination of parameters obtained RSM depth, moment and area of reinforcemnt is calculated.Fourcombinationofparametersareconsidered inthestudyare:
a) Span,liveloadandthicknessofwearingcoat.
b) Spanandliveload.
c) Spanandthicknessofwearingcoatcombination.
d) Liveloadandthicknessofwearingcoat.
5.1 .1 SPAN, LIVE LOAD AND THICKNESS OF WEARING COAT:
The results/responses obtained from the design are updatedintheDESIGNEXPERTandANOVAtestiscarried out to discern the dependency of two variables on the responses.
Table 5.1.1 shows the ANOVA results for depth of slab, design moment and area of reinforcement of the RC slab deck.Itsshowsallthemodelsaresignificant.TheModel F valueindicatesthatmodelissignificantandthereareonly 0.01%ofchancesofmakingwrongdecisionwhenthenull hypothesisistrue.
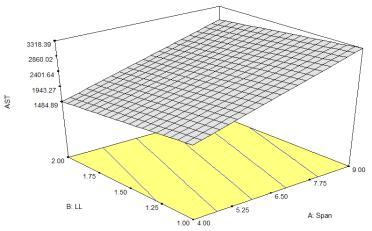
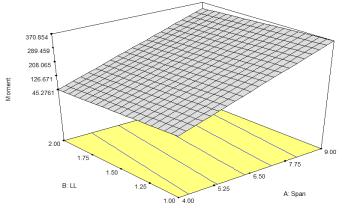
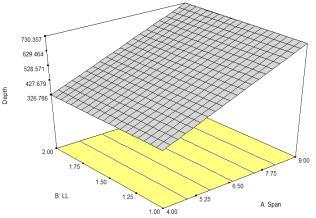
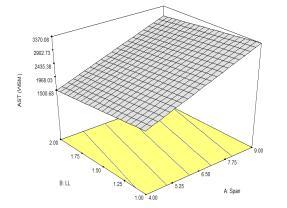
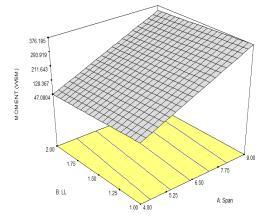
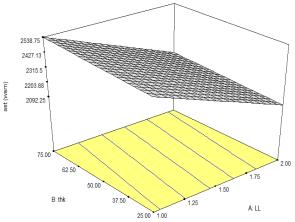
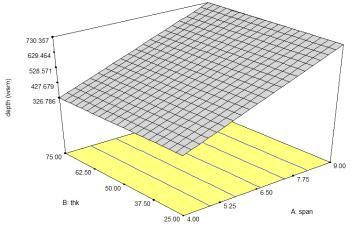
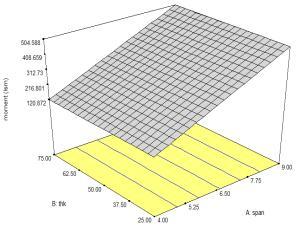
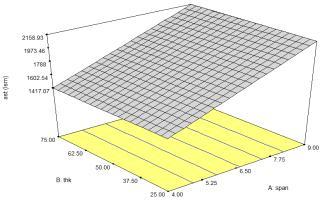
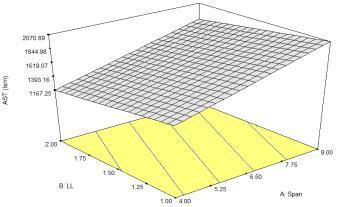
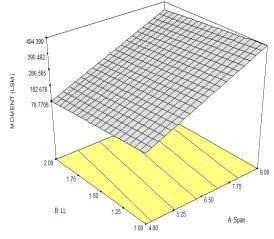
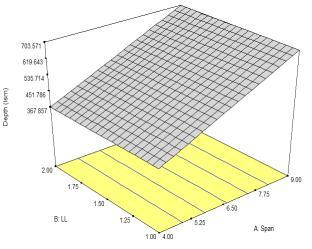
Fig 5.1.1 (a) (b) and (c) shows the 3D response surface plotsfordepth,moment,andareaofreinforcementagainst span, live load and thickness of wearing coat. Fig 5.1.1(a) indicatesthatdepthofslabincreasesasspanincreasesand momentincreaseswiththeincreaseinspananddecreases for the case 2 live load as shown in Fig 5.1.1(b). The decrease in moment is due to two axle loads of each 114 kN isspecified in IRC 6:2014 for case 2, whereas two axle
loads of 350 kN is specified in IRC 6:2014 for case 1. Fig 5.1.1(c) indicates that area of reinforcement increases as thespanincreasesanddecreasesforthecase2liveload.
decreasesforthecase2liveload.Thedecreaseinmoment is due to two axle loads of each 114 kN is specified in IRC 6:2014 for case 2, whereas two axle loads of 350 kN is specifiedinIRC6:2014forcase1.Fig4.4(c)indicatesthat area of tensile reinforcement increases as the span increasesanddecreasesforthecase2liveload.
5.1.2 SPAN AND LIVE LOAD
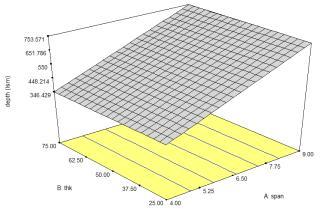
Fig 4.3 (a) (b) and (c) 4.3 shows the 3D response surface plotsfordepth,momentandarea oftensilereinforcement against span and live load. Fig 4.1(a) indicates that depth ofslabincreasesasspanincreasesandFig4.1(b)indicates that moment increases with the increase in span and
5.1.3 SPAN AND THICKNESS OF WEARING COAT COMBINATION
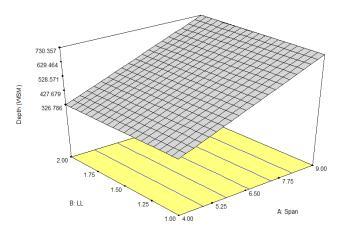
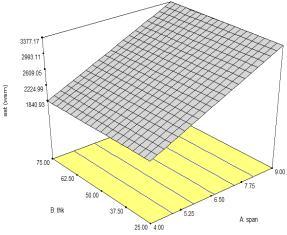
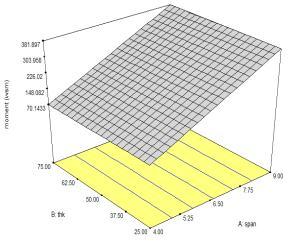
Fig 5.1.3(a) (b) and (c) shows the 3D response surface plotsfordepth,momentandarea oftensilereinforcement against span and thickness of wearing coat. Fig 5.1.3(a) indicatesthatdepthofslabincreasesasspanincreasesand Fig 5.1.3(b) indicates that moment increases with the increase in span. Fig 5.1.3(c) indicates that area of tensile reinforcementincreasesasthespanincreases.
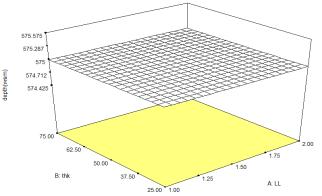
Fig 5.1.4 (a) (b) (c) shows the 3D response surface plots for depth, moment and area of reinforcement against live load and thickness of wearing coat. Fig 5.1.4.(a) indicates that depth of slab is constant because in this case span is kept constant. Fig 5.1.4 (b) indicates that moment decreases with the increase in live load. The decrease in moment is due to two axle loads of each 114 kN is specifiedinIRC6:2014for case2,whereastwoaxleloads of350kNisspecifiedinIRC6:2014forcase1.

5.2 RESULTS OF RSM AND ANOVA FOR VARIOUS COMBINATION IN LIMIT STATE METHOD
By considering various combination of parameters obtained RSM depth, moment and area of reinforcemnt is calculated.Fourcombinationofparametersareconsidered inthestudyare:
a) Span,liveloadandthicknessofwearingcoat
b) Spanandliveload
c) Spanandthicknessofwearingcoatcombination.
d) Liveloadandthicknessofwearingcoat
5.2.1 SPAN, LIVE LOAD AND THICKNESS OF WEARING COAT:
Fig 5.2.1(a) (b) and (c) shows the 3D response surface plotsfordepth,momentandareaofreinforcementagainst span, live load and thickness of wearing coat. Fig 5.2.1(a) indicatesthatdepthofslabincreasesasspanincreasesand momentincreaseswiththeincreaseinspananddecreases for the case 2 live load as shown in Fig 5.2.1(b). The decrease in moment is due to two axle loads of each 114 kN isspecified in IRC 6:2014 for case 2, whereas two axle loads of 350 kN is specified in IRC 6:2014 for case 1. Fig 5.2.1(c) indicates that area of reinforcement increases as thespanincreasesanddecreasesforthecase2liveload.


5.2.2 SPAN AND LIVE LOAD COMBINATION
Fig 5.2.2 (a) (b)and (c) shows the 3D response surface plotsfordepth,momentandarea oftensilereinforcement againstspanandliveload.Fig5.2.2(a)indicatesthatdepth of slab increases as span increases and Fig 5.2.2(b) indicatesthatmomentincreaseswiththeincreaseinspan and decreases for the case 2 live load. The decrease in moment is due to two axle loads of each 114 kN is specifiedinIRC6:2014for case2,whereastwoaxleloads of350kNisspecifiedinIRC6:2014forcase1.Fig5.2.2(c) indicates that area of tensile reinforcement increases as thespanincreasesanddecreasesforthecase2liveload.
Fig 5.2.3 (a) (b) (c) shows the 3D response surface plots for depth, moment and area of tensile reinforcement against span and thickness of wearing coat. Fig 5.2.3 indicatesthatdepthofslabincreasesasspanincreasesand moment increases with the increase in span. Fig 5.2.3(c) indicates area of tensile reinforcement increases as the spanincreases.
5.2.3 SPAN AND THICKNESS OF WEARING COAT COMBINATION
5.2.4 LIVE LOAD AND THICKNESS OF WEARING COAT COMBINATION
8. REFERENCES
[1] Daniel M. Balmer, George E. Ramey.,2003. Effects of Bridge Deck Thickness On Properties and Behavior of Bridge Decks, Practice Periodical on Structural Design and Construction,ASCE,pp.83-93.
[2] Shehab Mourad, Sami W.Tabsh.,1999. Deck slab stresses in integral abutment bridges, Journal of Bridge Engineering,pp.125-130.
[3] M. Mabsout,K. Tarhini, R. Jabakhanji and E. Awwad.,2004.Wheelloaddistributioninsimplysupported concrete slab bridges, Journal of Bridge Engineering, pp.147-155.
6. RESULT ON EXISTING BRIDGE DATA
TheregressionequationsobtainedthroughtheANOVA by working stress design method were considered for comparing the two variables (Such as Depth, and span) withstatisticalstudies.Thedepthofthebridgefoundtobe 650mm and effective span of 7.4 m. The results from the analysis shows that the regression equation (see equation 1) obtainedwith span as variable gives 601 mm depth, which is less than the actual depth provided. There is a variation of 7.5% in the depth, suitably this method of analysis can be adopted with±10% allowable errors. Further, the errors can be lowered by increasing the numberofparametersintheanalysis.
7. CONCLUSIONS
1) The obtained results from ANOVA, linear regression equation obtained for both working stress and limit state design methods were reliable.
2) Since the model is insignificant no relation between span and thickness of wearing coat is obtained. The equation were obtained for forecasting depth, moment and area of reinforcement of the deck slab for span varying from 4 to 9m and thickness of wearing coat from 25to75mm.
3) The linear equation obtained by working stress method by considering three variables shows the variation of 7.5% in the depth and area of reinforcement using Response Surface Method (RSM).
[4]SudipJha, Cherukupally Rajesh, P.Srilakshmi, 2015. Comparative study of RCC slab bridge by Working stress (IRC: 21-2000) and Limit State (IRC: 112-2011), International Journal & Magazine of Engineering, Technology,Management andResearch,pp.223-227.
[5] Kapil Kushwah, Anshuman Nimade, Mahesh Patidar, Vikasjoshi.,2018. Analysis of RC deck slab bridge for varyingspan, International Research Journal of Engineering andTechnology,pp.1254-1257.
[6]Arindam Dhar Mithil Mazumder, Mandakini Chowdhury, Somnath Karmakar., 2013. Effect of skew angle on longitudinal girder (support shear, moment, torsion) and deck slab of an IRC skew bridge, The Indian ConcreteJournal,pp.46-52.
[7]B.H.Solanki&Prof.M.D.Vakil.,2013. Comparative study for shear design using IRC 112:2011 & IRC 21:2000, International Journal of Scientific & Engineering Research, Volume4,Issue6,pp.1331-1334.
[8]R.Shreedhar, RashmiKharde.,2013.Comparative study of Grillage method and Finite Element Method of RCC Bridge Deck, International Journal of Scientific & EngineeringResearchVolume4,Issue2,pp.1-10.
[9] Shamsad Ahmad and Saeid A. Alghamdi., 2014. A statisticalapproachtooptimizingconcretemixturedesign, TheScientific WorldJournal,pp.1-7.
[10] Balaji, MontoMani,Venkatarama Reddy.,2015. Thermal conductivity studies on cement-stabilised soil blocks, ICEPublishing,pp.1-15.