A Medical Price Prediction System using Boosting Algorithms through Machine Learning Techniques

ABSTRACT
The health care insurance cost plays a vital role in developing medical facilities. To provide better medical facilities,it isvery essential toforecastthecost of medical insurance which is one of the possibilities to enhance medical facilities. The paper deals with predicting the cost ofthehealthinsurancewhichhastobepaidbythepatient. Here various data mining regression algorithms such as decision tree, random forest, polynomial regression and linear regression are implemented to achieve the best prediction analysis. A comparison has been done between the actual and predicted expenses of the prediction premium and eventually, a graph has been plotted on this basis which will enlighten us to choose the best-suited regression algorithm for the insurance policy prediction. After the execution of these regression algorithms for prediction, correctness has been measured by the Coefficient of determination (r2_score), Root Mean Squared Error (RMSE) and Mean Squared Error (MSE) of each algorithm to check for the best-suited algorithm. RandomForestRegressionwasthebestalgorithmwithan r2_scoreof0.862533whichcanbeusedinitsbestpossible wayforthecorrectpredictionofthehealthinsurancecost
Keywords: Keywords: Natural Language Processing, Tokens, Features, Training & Testing Data, Model or classifier,NaïveBayes,SVM, Bernoulli.
I. INTRODUCTION
Health insurance market is a crucial market because onethirdofGDP[1]isspentonhealthinsuranceintheUnited States, and everyone needs some level of health care. Health insurance is one of the most significant investment an individual makes every year. This study is an effort to find mathematical models to predict future premiums and verify results using regression models. Medical costs that occur due to illness, accidents or any other health reasons areconsiderablyexpensive,byhavinghealthinsurance,an individual is not liable for paying the entire medical costs of the procedure. According to the Office of Health and Human Services (HHS) [2], the total health service budget forthefiscalyear2015isaround1100billiondollars
There are several health care systems around the world. For example, single payer system followed by Canada where premiums are paid by taxes, government health
care system followed by the United Kingdom where healthcareistheresponsibilityofcentralgovernment.
There are no existing tools to the best of our knowledge that can predict future premiums based on historic data. Therefore, there is a need to conduct research to find the premiumsacrosstheUnitedStates.
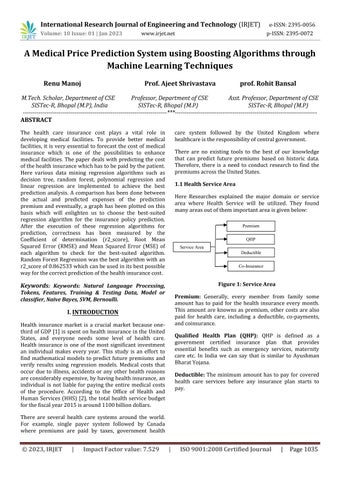
1.1 Health Service Area
Here Researches explained the major domain or service area where Health Service will be utilized. They found manyareasoutofthemimportantareaisgivenbelow:
Premium: Generally, every member from family some amount has to paid for the health insurance every month. This amount are knowns as premium, other costs are also paid for health care, including a deductible, co-payments, andcoinsurance.
Qualified Health Plan (QHP): QHP is defined as a government certified insurance plan that provides essential benefits such as emergency services, maternity care etc. In India we can say that is similar to Ayushman BharatYojana.
Deductible: The minimum amount has to pay for covered health care services before any insurance plan starts to pay.
1.2 Data Mining Tools
Figure 2: Data Mining Tools
InFigure2researchersexplainedthedifferentdatamining toolsavailableforprocessingthegivendata.
Generally, Weka is Java based tools which is very efficient forDataprocessingandfindingthebehaviourandpatterns fromthetakendata.ApacheMahoutisveryefficientforBig Data.
1.3 Objective of Work
Sentiment The Motto of This researcher is that In Today’s hectic life everybody has to take concert to their Health status because thiswill define thathow muchamount will be required in near future. So, any Insurance company comes to some conclusion after behaviour of Health of anyone We all know that in previous some years through outtheglobefrompoorpeopletorichpeopleeverybodyis taking health plan because they know if they come under illnesstheireconomicconditionmaysufferthemandtheir family. So, for their safety they also try to book any good planthatislessinpremiumcastandwillgivebettercover innearfuture.Thisisveryfastandgrowingindustries.
II. RELATED WORK
Here In this section, research efforts from the finding the information and machine learning techniques are explained. Many papers have explained the issue of claim prediction.Authorssuggested,"Predictingmotorinsurance claims using telematics data" in 2019. This research Explainedforbetterperformanceoflogisticregressionand XGBoost techniques to forecast the presence of accident claims by a small number and results showed. LR is very Effective in some cases. this system takes pictures of the damagedcarasinputsand producesrelevant details,such as costs of repair to decide on the amount of insurance claim and locations of damage. Thus, the predicted car insurance claim was not taken into account in the present analysisbutwasfocussedoncalculatingrepaircosts[4].
Healthcare sector isone of the biggest sectorsinterms of the global economy. According to the World Bank, in 21 century, health care expenditures accounted for 10% approx. of the world’s total gross domestic product(GDP). Additionally, per capita health expenditures have been increasing day by day from last 10-20 years. In the many countries, the Centres for Medicare & Medicaid Services (CMS)reportedthathealthcareaccountedfor17.5%ofthe nationalGDP[5].
III PROBLEM IDENTIFICATION
Many research’s is doing their work in this area. Authors have learned several things from this study We come to conclusion that Insurance Sector is very growing in terms of number of customers growing as well as every year’s number of new Insurance company comes into existence. Theseindustries havehuge contributionintoGDP.Sohere huge concern and analysis needed. Besides looking at various approaches and models, we also focus on important aspects in the Machine Learning This will enableyoutousethesemethodologiesinthefuture
IV. ALGORITHMS
Step 01: StoreDatafromKaggleRepository
Step 02: ImportPriorLibraries
Step03: NowImportourRequiredDataset
Step04: ApplyFeatureExtraction


a)BivariateAnalysis
b)MultivariateAnalysis
Step 05: VisualizeDataforbetterunderstanding
a)DescriptiveFeatures
b)DistributionofDifferentFeatures
Step06: ApplyingMachineLearningAlgorithms
Step07: ApplyDifferentModel
a)LinearRegression
b)RandomForest
c)GradientBoosting
Step08: Repeat Step07 for many times with different Algorithms
Step09: Finally Compare Results with performance parameterslikeRMSEScore&R2Score.
Step10: Stop
IV.
In In figure 3 At first step, we need to fetched Data from any external source or we can collect Data from Local Market but for better Analysis we are Fetching our Data from Kaggle. That is very reliable Data Source through Word Wide. In Next Step we need to Fetched Different Librariesforprocessing our Data.Atverynext Stepthat is ThirdStepweneedtoprocessourDatafornextstepHere we have many processing Mechanism. We are using
Numerical to Nominal Data Conversion or also using UniVariantandMulti-VariantDataProcessing.AtNextStepi.e., Fourth Step we need to repeat it for different Data split. Then after we will reach at step 5 where we will apply DifferentMachineLearningAlgorithmsandFinally,wewill apply our own Proposed Methods i.e., Gradient Boosting with Weighted Average values. Here we will adding average values of previous implemented mechanism. At Final Step i.e., Sith step we will have to find Performance Measuresi.e.,RMSEScore&R2Scorewillgiveclearviews ofproposedmethodandExistingone.AtFinalStepwewill compare these given Results. We can say that Our ProposedMethodsgivesbetterResult
V. PROCESS OF IMPLEMENTATION


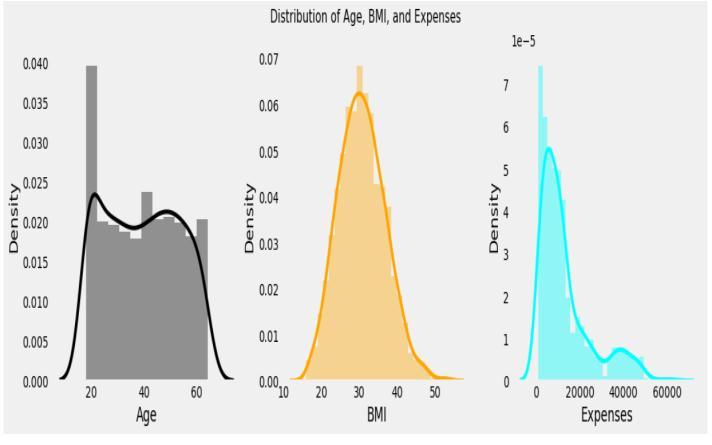
In the Figure 4 reserchers Explained How Distribution givesclearResults:
1) We can say that we have an equal number of people of allages
2.)Wheremaximumpeoplehavebmiaround30
3.)Finally Expenses are seem to be right skewed.(Learn Skewnessfromprobablityandstatistical)
Note: Because Expenses are skewed in nature so that can be either transform this column using log transformation or square root transformation. And this can be converted intonormalDistribution.
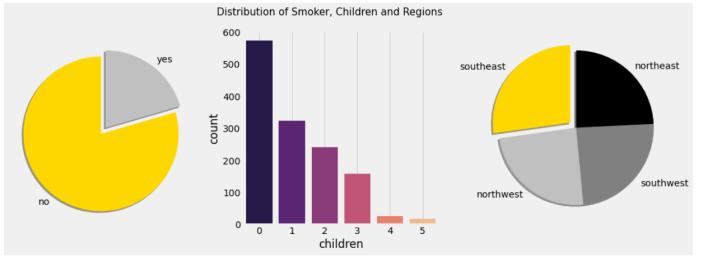
In figure 5 its clear picture that how Distribution of Smokers,Childrenandregiongetseffected.
Output Results
Inthetable1wearetryingtoshowtheAccuracyResultsof DifferentAlgorithmswhichweimplemented.
Table: 1
Accuracy
Figure 6: Different Algorithms Comparison Line Graph
In figure 6 By the analysis of above graph wecan say that we find that Liner Regression ,Random Forest, Gradient BoostingwithWeightedAveragevalues(ProposedMethod )givesDifferentResultsrespectively.Here Wearegoingto proposed some tuning mechanism so that Results get improved. Here we are Implemented an weighted averaging model We tooked 50% weight to gradient boosting,30%weighttorandomforestand20%weightto linearregression.DuetototheaboveDataselectionweare gettingbetterResults.
VI. CONCLUSION
Here researches conclude that when we Implemented Number of Machine Learning Algorithms for finding best results in terms of performance. We Finds the major Features of given Data set are Smoking Behaviour, Age Group, Region Where They Lived and many more. Most Important Factors to Predict the Medical Expenses of a Patient is Smoking Behaviour, Age, Gender, Number of Children, the Region also have a good impact on determining the Medical Expenses. Finally, we Implemented Different Machine Learning Algorithms Like Linear Regression, Random Forest & Finally our Proposed Method gives results respectively i.e., 79%, 87 % and finally 89%. When we looked into our proposed methods then we can claim that with existing system our proposed methods give better results in terms of Accuracy. Apart from Accuracy we explained various Graphs from which wecomeforbetterunderstandingaboutourImplemented Models.
VII. FUTURE SCOPE
In this investigation the future works focus on applying some other techniques to improving the performances of thesemethodsforuptomaximumextent. Anotherconcept thatcanbeimplementedDeeplearninginplaceofmachine learning technology. The reason behind this is best and efficient techniques using nowadays. Deep learning is also introducednowadayswhichisbecomingmorepopularfor classification purpose. So, we can also implement deep learninginfutureworkalso.
REFERENCES
[1] Sonali Vyas, Rajeev Ranjan, Navdeep Singh, Arohan Mathur , "Review of Predictive Analysis Techniques for AnalysisDiabetesRisk",978-1-5386-9346-9©2019IEEE.
[2] Gaurav Tripath, Rakesh Kumar , "Early Prediction of DiabetesMellitusUsing MachineLearning " ,2020 8th International Conference on Reliability, Infocom Technologies and Optimization (TrendsandFutureDirections)(ICRITO)AmityUniversity, Noida,India.June4-5,2020.
[3] Messan Komi, J un Li ,"Application of Data Mining Methods in Diabetes Prediction",2017 2nd International ConferenceonImage,VisionandComputing
[4] Bakshi Rohit Prasad,Sonali Agarwal ,"Modeling Risk PredictionofDiabetes–APreventiveMeasure"
[5] J. N. Myhre, I. K. Launonen, S. Wei and F. Godtliebsen, "Controlling blood glucose levels in patients with type 1 diabetes using fitted qiterations and functional features," 2018 IEEE 28th International Workshop on Machine Learning for Signal Processing (MLSP), Aalborg, pp. 1-6, 2018.
[7] Zhang, Y., Lin, Z., Kang, Y., Ning, R., & Meng, Y. A FeedForward Neural Network Model For The Accurate PredictionOfDiabetesMellitus.
[8]Kadhm,M.S.,Ghindawi,I.W.,&Mhawi,D.E.(2018).An Accurate Diabetes Prediction System Based on K-means Clustering and Proposed Classification Approach. International Journal of Applied Engineering Research, 13(6),4038-4041.
[9] Sundaram, N. M. (2018). An Improved Elman Neural Network Classifier for classification of Medical Data for DiagnosisofDiabetes.InternationalJournalofEngineering Science,16317.
[10] Deeraj Shetty,Kishor Rit, Sohail Shaikh, Nikita Patil,"DiabetesDiseasePredictionUsingDataMining",2017 International Conference on Innovations in Information, EmbeddedandCommunicationSystems(ICIIECS)
[11] Muhammad Azeem Sarwar,Nasir Kamal,Wajeeha Hamid,Munam Ali Shah,"Prediction of Diabetes Using Machine Learning Algorithms in Healthcare",Proceedings of the 24th International Conference on Automation & Computing, Newcastle University,Newcastle upon Tyne, UK,6-7September2018
[12]Md. Faisal Faruque,Asaduzzaman,Iqbal H. Sarker,"Performance Analysis of Machine Learning Techniques to Predict Diabetes Mellitus",2019 International Conference on Electrical, Computer and CommunicationEngineering(ECCE),7-9February,2019
[13] C. C. a. A. Semanskee, "Analysis of UnitedHealth Group’sPremiumsandParticipationinACAMarketplaces," 2016.
[14]"HowtheAffordableCareActHasImprovedAmerica's Ability to Buy Health Insurance on Their Own," The CommonwealthFund,2017.
[15] I. D. Henry G. Dove, and Arthur Robb, "A prediction modelfortargetinglow-cost,highriskmembersofmanaged care organizations," The American Journal of Managed Care,2003.