DEMOGRAPHIC DIVISION OF A MART BY APPLYING CLUSTERING TECHNIQUES
2,3,4,5
Abstract – Everyone in this contemporary era strives to be more creative and competitive than others. Therefore, to survive in this cutthroat world, we must be superior to others. When we consider business scenarios in the modern era, they depend on innovations that cancaptivatecustomers withtheir offerings. Because we are not employing good techniques, our business will be monotonous and we will incur losses. Therefore, we must employ advanced techniques that can produce results quickly and precisely if we want to have a successful and market-leading business in this era. Targeting customer wish lists and concentrating on customer sales are two strategies many businesses use. As numerous techniques and algorithms were available at the time, machine learning enters the picture. Furthermore, future decision-making and the discovery of buried patterns in the data both use this.
The first section to target is specified in this concept, and the second segment is equalized using segmentation. Customer segmentation is the division of a customer base into groups and subgroups according to similar needs and behaviors, and then further into individual segments. To segment, the audience for this paper, three different clustering algorithms K-Means, Agglomerative, and Hierarchical Clustering were implemented. The results of the clusters produced by these algorithms were then compared. A Python program has been created and trained by applying standard scalar to a dataset with about 2000 trainingsamplesobtained from a nearby mart. However, there were a lot of null values in the dataset that we collected. Therefore, we used the datacleaning process to remove those null values. The dataset was then used for our testing after we removed all the invaliddata and ensured that there were no missing values. Data preprocessing, data cleaning, data transformation, and data evolution are typically the next few steps. It displays the number of men and women arriving at the market and the type of work they are all performing. Each group will then be divided into different clusters for each segment. Finally, we'll have a variety of clusters. Our outcome will be that.
Key Words: Customers, Marts, Segmentation, Machine learning, Python, K-Means, Agglomerative algorithm, Clustering Techniques, Data Cleaning, Data Transformation, Preprocessing, Missing Values, Behaviors, Standard Scalar, Dataset, Decision Making.
***
1. INTRODUCTION
The need for more marketing strategies has increased for establishedcompaniesasnewbusinessescontinuetoopen upbecausethemarketisbecomingincreasinglycutthroat.In the world of marketing today, a straightforward rule has emerged: "Change or Die." It clearly states that they must altertheircurrentstrategiesiftheywanttostaycompetitive inthemarketasbettermethodsandtacticsemerge.Inthe marketingworld,thisrulewasobserved.Asthecustomer basegrowsdaybyday,ithasbecomedifficultforbusinesses tomeeteverycustomer'sneedsandrequirements.Atthis point, data mining is crucial for revealing the hidden patternskeptinthecompany'sdatabase.
Customer segmentation is one of the applications of data mining that assists in clustering customers who exhibit similarpatternsintosmallergroups,makingitsimplerfor the company to manage its large customer base. This segmentation can have a direct or indirect impact on the marketingstrategybecauseitopensupsomenewavenues for research,including whichsegment the productwill be best suited for, tailoring marketing strategies to each segment, offering discounts to certain segments, and understandingthecustomer-objectrelationship,whichthe company had not previously understood. Customer segmentationgivesbusinessestheabilitytoseewhattheir customersarebuying,whichmotivatesthemtobetterserve them and increase customer satisfaction. It also enables companiestoidentify their target customersand improve theirmarketingstrategiestoincreasesalesfromthem.
Clusteringisaneffectivemethodforimplementingcustomer segmentation. Unsupervised learning includes clustering, which is the ability to find clusters in unlabeled datasets. Clustering algorithms include k-means, hierarchical clustering, Agglomerative clustering, and others. Three differentclusteringalgorithmsweretestedonadatasetwith twofeaturesand2000recordsinthispaper.
2. LITERATURE REVIEW
Aman Banduni[1], Theprocessofcustomersegmentation using machine learning is explained. They use machine learningtocategorizethecustomersinthisbyperforminga

fewsteps.Toperformtasksforanytypeofsegmentation,we firstneedthedataset.Customerclassification,BigData,data repository,clusteringdata,andk-meansarethestepsthat came after. Over time, the commercial world has become more competitive as companies like these now need to entice new customers while also meeting the needs and demands of their existing ones. Determining and meeting eachcustomer'sneedsandrequirementsisaverydifficult task. This is a result of the fact that various clients have variousneeds,desires,demographics,sizes,preferences,and other traits. Currently, providing equal service to all customersisnotawisebusinessdecision.Becauseofthis, businesses engage in customer segmentation. Millions of internally connected sensors send data about their customers,suppliers,andbusinessprocessestotheoutside world. world of technology, including automobiles and smartphones, as well as information gathered from production, sensing, and communications. the ability to improve forecasts, save resources, increase output, and improveseveralareas,suchastrafficmanagement,weather forecasting, disaster prevention, finance, fraud control, business transactions, national security, education, and healthcare. Every data collection effort is made to obtain trustworthydatathatwillaidintheanalysisandproduction oftruthful butinaccurateanswerstothequestionsposed. Throughtheprocessofclusteringbasedoncommonalities, dataisorganizedintodatasets.Toanalyzedatasetsbasedon thegivencondition,avarietyofmethodscanbeused.There are numerous methods for performing k-means and grouping data into groups. The data in this paper comes from the UCI machine Learning repository. In this paper, theyclusterthecustomersbyindicatingindifferentcolors such as red, orange, and blue which product will be completelysoldinashorttime
Zhenyu Wang, Yi Zuo atal[2], This paper primarily discusses customer segmentation using a broad learning system.SincetheintroductionofthefirstPOS(PointofSale) system in supermarkets in the 1970s, POS data has been regarded as a critical strategic resource. Retailers hope to improve their understanding of consumer purchasing patterns and increase customer loyalty by analyzing POS data. Numerous researchers have discovered through the analysisofPOSdatathatconsumersaremorecommittedto aspecificproductaftermakingmultiplepurchasesofit.Asa result, we typically divide consumer loyalty into three categoriesbasedonpreviouspurchases:high,middle,and low (POS data). The frequency with which a customer purchases and consumes a specific brand of goods is referredtoasthe"highlevel."Posdatacannotexplainthe purchasing decision-making process of consumers. To addressthisissuewireless,non-contactRFIDtechnologyhas emergedasaviableoption.In2011,etal.[1]attachedatiny RFID tag to shopping carts to track customers' in-store activities based on where the carts were placed. Several studieshavefoundthattheamountoftimecustomersspend on each component has a positive impact on their
consumption behavior. Researchers using RFID data to reflect various consumer behaviors frequently divide the lengthoftimethatcustomersspendinagivenintervalinto threesegments(highlevel,middlelevel,andlowlevel).To understand the consumers' purchase decision-making process, we divide them into various homogeneous segments using POS and RFID data. Several classification methodsareused.SVMmodelsandNeuralNetworksarethe most commonly used segmentation techniques. Both POS and RFID data have a positive impact on customer segmentation; however, only one type of data can fully comprehendacustomer'spurchasingactivity;forexample, POS data can only fully comprehend a client's purchase outcomes, whereas RFID data can fully comprehend a customer'sshoppingbehavior.TheyconfiguredtheNeural Networktobeathree-layerBPneuralnetwork.Theoutput layerhastwonodes,whilethehiddenlayerinthemiddlehas tennodes,andtheoutputlayerhastwonodes.Thefeatures of SVM are limited. In this paper, they used the BLS to identify customer segmentation and compare it to other classificationmodels.
Su-li HAO[3] This paper primarily discusses the segmentation of commercial bank customers using unascertained clustering. Client relationship management andvaluemanagementarenowtheprimarydrivingforces behindcommercialbankdevelopment.Numerousreputable commercial banks worldwide, such as Citibank, Bank of America,HSBC,JPMorgan,andothers,practiceandbenefit fromcustomerrelationshipmanagement.Commercialbanks willprofitiftheyvaluetheircustomersandworktomaintain their high standards. The commercial bank's marketing decisionsarebasedonanassessmentoftheclient'slifetime value. Some of them use customer current value as the measurement standard to evaluate customer value in the current evaluation method, while others use customer potentialvalueasthemeasuringstandard.Othersconsider themeasuringstandardtobethesimplesumofthecurrent andpotentialvalues.Thenewmethodmustdeterminethe value of the customer currency, non-customer currency, currentvalue,andpotentialvalueaccurately.Toseparatethe indications of commercial banks' customer lifetime appraisal, quantitative and qualitative indicators can be used.Whilequalitativeindicatorscanbeobtainedthrough professionalscoring,quantitativeindicatorscanbeobtained directlythroughcalculation.Usingunascertainedclustering, the study divides commercial bank customers into four categories: quality customers, backbone customers, mass customers, and low-class customers. Unascertained clustering corrects the shortcomings of C-mean value clustering and provides a quantitative description of the sample'sproperties.Itisalsomorelogicaltouseuncertain clusteringtodividecommercialbankclients.Furthermore, commercial bank decision-makers should base their decisionsonscienceratherthanuntrustworthygroupings.
Zhang Xiao-bin, Gao Feng, Xi'an School of Computer Science [4] - In this study, the fuzzy C-means clustering algorithm was improved and proven to be useful for segmentingcustomersanddetermininghigh-valuecustomer groupattributes.Thegoalofthisdataminingprocessisto keepextractinganddiscoveringpatternsinlargedatasets using machine learning methods. Customer churn is the most important factor in resolving any problem in any company. The data mining pattern will solve the major issuesinthecustomersegmentationprocessandaccurately predictthecustomer'svalue.Customersegmentationisthe process of managing and analyzing client information, as well asprocessingbusiness data storedincompaniesinto moredataaccessknowledge.TheMercerKernelsfunctionis usedinthisfunctiontotakeinputvaluesandseparatethe customeroutputvaluedata.AndtheKernelsmethodisused toclusterdatasetsduringthesegmentationprocess.Andin this, there is data access by evaluating the usefulness and reliabilityofthedataminingattributefindings.Thisprocess approach can save the enterprise money and manpower whileimprovingthesituationofdataexplorationanddata deficiency.
XIONG Weiwen, Chen Liang and atal [5], The most common segmentation is customer relationship management.Mallownersprimarilyfocusonthewantsand needsoftheirpatrons.Usingthecorrelationmodel,financial model, frequency model, and recency model, customer behaviorhasbeenidentified.Thealgorithmisthealgorithm, andtheAHPisusedtoweighthecustomer.whetherornot theirproductsaresoldintheenvironmentoftheconsumers. At stores or malls, those products are noted as being challengingforthosecustomers.Thesearedeterminedby RFM values that have been compiled to categorize customers.Ifvalue=R.F.M,thenGreycorrelationanalysisis essentiallyusedtoidentifytheclosestpathfortheline-bylinecontinuation.Inthisway,wehavethemajorityofthree datasets and provide tables, graphs, and diagrams of correlationtechniques.Afantasticendlogisticsdivisionof logistics engineering is a category of platinum that represents various segments of the logistics market. The methodsforcustomersegmentationuseempiricalanalysis toshowthe effectivenessof thesuggestedmethodandits performance.Customersofacertaintypepaymoreattention tothelevelofserviceprovidedinlogistics,buttheyareless valuable. To draw in these customers, they should use effectiveadvertising,cutting-edgemarketingstrategies,and customizedlogisticssolutionstoincreasecustomerloyalty, firmly hold onto customers like these, and generate high profits.TheRFM(Recency,Frequency,andMonetary)and grey correlation dimensions are used in this paper to structure the customer segmentation model. There are provided the formulas for calculating the various dimensions.Basedonit,thispaperchoosesanillustration foracasestudy,andthefindingsdemonstratetheviabilityof themethod.
3. IMPLEMENTATION
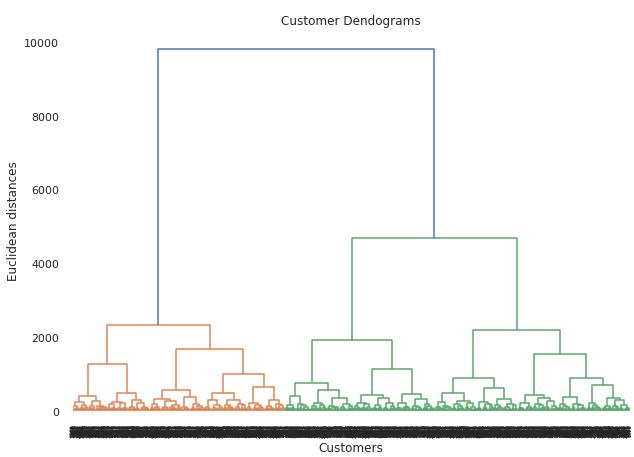
Algorithm:
Step 1: Start
Step 2: CollecttheDataset
Step 3: Checkwhetherthedatahasnullvaluesornot,ifyes gotostep4otherwisegotostep6
Step 4: Then Clean the data by using preprocessing techniques
Step5: Ifnomissingdatawillbefound,ifagainmissingdata isobservedrepeatstep4again
Step 6: ThenapplyK-MeansandAgglomerativetechniques
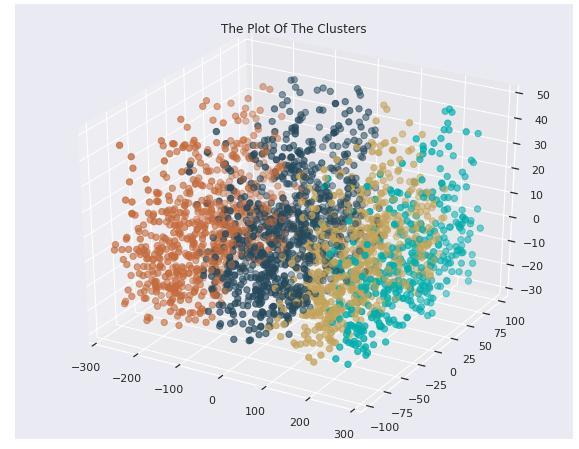
Step 7: Then the data will be evaluated and divided into Clusters
Step 8: Later Exploratory Data Analysis will be done and thenitwillbeourfinalResult
Step 9: Stop
4. PROPOSED SYSTEM
The proposed study's main goal is to create a machine learningmodeltoseparatecustomers.Thestudy'sspecific goalsareasfollows:
● Recognizethecurrentsituationasitrelatestothe clienteleofthebusiness.
● Prior work on customer segmentation should be consolidated.
● Investigate data to discover the relationship between the customer and the attributes that benefitthebusiness.
● Use unsupervised machine learning to perform clusteringanalysisandevaluatebuiltmodels.
● For the best results, use tableau for data visualizationandinterpretation.
● Thesuggestedsystem is builtusingunsupervised machinelearningtechniqueslike
○ AgglomerativeClustering
○ ElbowMethod
tocalculatethenumberofclustersinadataset.designedfor interpretationandvalidationofconsistencywithincluster analysis.
Agglomerative Clustering:
Itisabottom-upapproach,inwhichthealgorithmstartsby taking all data points as a single cluster and then merges them. The foundation of agglomerative clustering is the creation of a hierarchy represented by dendrograms. The algorithm uses the dendrogram as memory to store informationabouthowclustersareformed.Theclustering process begins by creating N clusters for N data points, which are then combined along the closest data points in each step so that there is one fewer cluster in the current stepthaninthepreviousone.
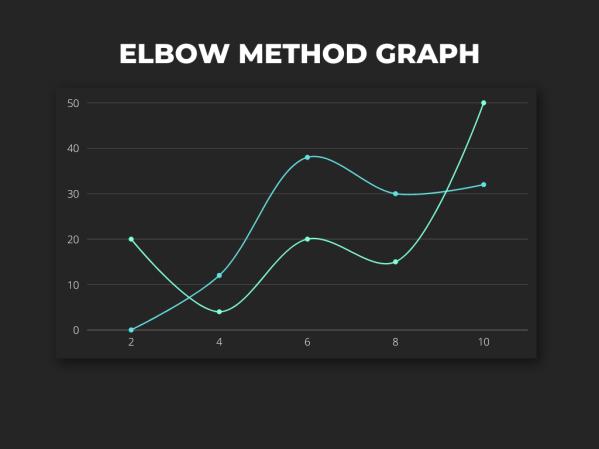
Theformationoftheclustersandtheireventualconvergence intoasingleclusterareshowninthefigure.
InFig.1,welookforthelongestverticallinethatisnotbeing cutbyanyofthecladesandextendsvirtuallyovertheentire widthofthegraph.Thesecond-to-lastcladeingreenhasits rightlegbearingthelongestverticallinethatisnotbeingcut by any clade. A dendrogram is used to find the optimal number of clusters to apply for agglomerative clustering. Now, by imagining a horizontal line that cuts through the longestverticalline,weobtainthehorizontallinethatcuts through a total of five vertical lines, giving us the ideal numberofclustersforourdataset
Agglomerativecluster
K-Means Clustering:
It is the most basic clustering algorithm based on the partitioning principle. The algorithm is sensitive to the initializationofthepositionsofthecentroids;thenumberof K(centroids)iscalculatedbytheelbowmethod,andafter thecalculationofKcentroidsintermsofEuclideandistance, data points are assigned to the cluster's closest centroid. Barycenters are assigned after the cluster is formed. calculated by the means of the cluster, and this process is repeateduntilthereisnochangeincentroidposition.
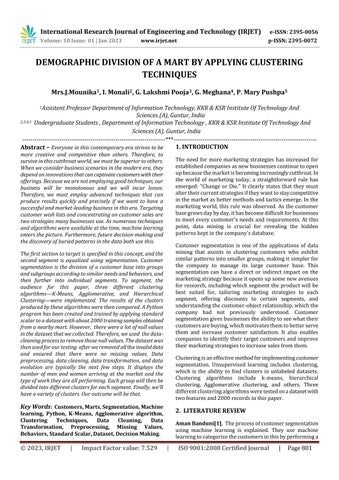
Elbow Method:
FortheK-meansclusteringalgorithm,theelbowmethodis usedtodeterminethebestvalueforK.TheSSEofeachdata pointiscalculatedusingitsnearestcentroidandarangeofK values. The elbow is the point at which we should stop furthersubdividingthedatabecauseitisthevalueofKat whichtheSSEismostlikelytodeclineasKincreases.
Dendrogram:
The hierarchical representation of an object, the dendrogram,isusedtodeterminetheoutputofhierarchical clustering.Theheightofeachclade(horizontalline)isused tointerpretthedendrogram;thelowertheheight,themore associateddatapointsthereare,andthehighertheheight, the fewer associated data points there are.Fig. 1 demonstrates the dendrogram created using our dataset.
Bandwidth:
Theradiusofthecircle(kernel)describinghowmanydata points should be in the cluster can be thought of as the bandwidth. It is the sole requirement for the input to the Mean shift algorithm with K Nearest Neighbors as a calculator.Theinitializationofbandwidthhasasignificant impact on the convergence of the mean shift algorithm; a small value can slow convergence while a large value can accelerateit.
Mean shift clustering:
This clustering algorithm is a non-parametric iterative algorithm that works by treating all data points in the featurespaceasanempiricalprobabilitydensityfunction. The algorithm clusters each data point by allowing data points to converge to a region of local maxima, which is accomplished by fixing a window around each data point, determiningthemean,shiftingthewindowtothemean,and repeatingthestepsuntilall datapointsconverge,forming theclusters.
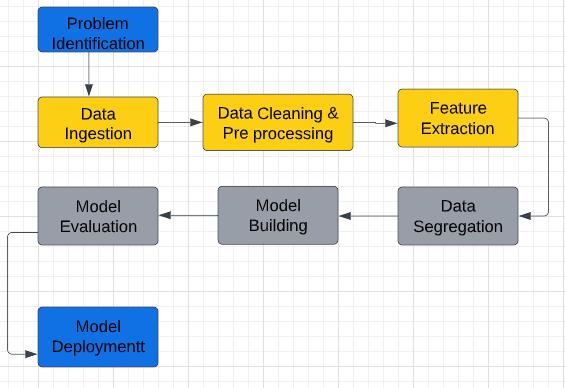
SYSTEM ARCHITECTURE:
WORKFLOW:
Thedatasetwasobtainedfromaneighborhoodretailstore andincludestwofeatures:thetypicalnumberofvisitstothe storeandthetypicalamountofshoppingdoneonanannual basis.Thedatasetwasobtainedfromaneighborhoodretail storeandincludestwofeatures:thetypicalnumberofvisits to the store and the typical shopping done on an annual basis.Thedatasetwasobtainedfromaneighborhoodretail storeandincludestwofeatures:thetypicalnumberofvisits tothestoreandthetypicalamountofshoppingdoneonan annualbasis.
Data Cleaning:
Data cleaning is the process of removing inaccurate, incomplete,andmisleadingdatafromdatasetsandreplacing the missing values. There are a few strategies in data cleaning.
Data Integration:
AssemblingvarioussourcesintoasingledatasetOneofthe key processes in data management is data integration. Duringdataintegration,thereareafewissuestotakeinto account.
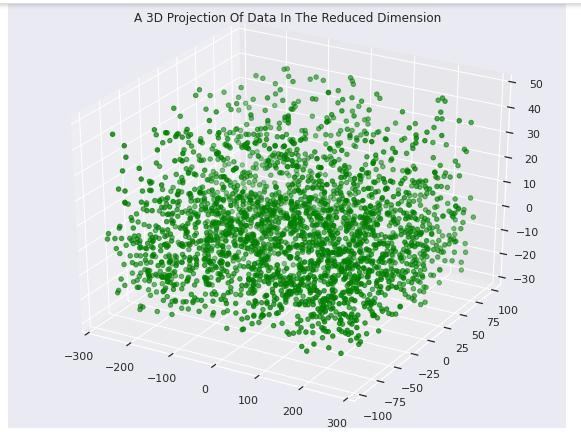
Data Reduction:
This method facilitates data volume reduction, which facilitates analysis while yielding essentially the same outcome.Additionally,this decreasehelpsfreeupstorage space.Dimensionalityreduction,numerosityreduction,and data compression are some of the techniques for data reduction.
5. RESULTS:
Theprocessoftestinginvolvesrunningaprogramwiththe goalofidentifyingerrors.Oursoftwaremustbeerror-freein order to function properly. If testing is completed successfully,allsoftwareflawswillbefixed.Theprocessof ensuring and validating that software or an application is bug-freesatisfiestechnicalspecificationsasdeterminedby itsdesignanddevelopment,andeffectivelyandefficiently meetsuserrequirementswhilehandlingallexceptionaland
boundarycases,isknownastesting.Thetestobjectivesare listedbelow.
Aprogramistestedbybeingrunwiththegoalofidentifying anyerrors.Astrongtestcaseisonethathasagoodchanceof spottinganerrorthathasn'tbeenidentifiedyet.Atestthat findsanerrorthathasnotyetbeenidentifiedissuccessful.
Theoutputscreensareasfollows:
6. CONCLUSIONS:
In order to segment customers, the study tried to build unsupervised machine learning models like K Means and hierarchical clustering. The next steps would be to take a closer look at large dataset features, evaluate them, and createaneffectivemodel.
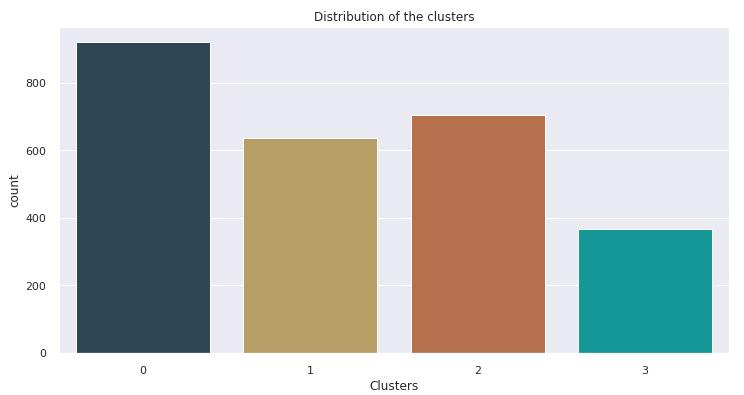
First, we began with the pre-processing of the data. Following that, we used clustering algorithms. We chose MiniBatchK-Means as the second model after contrasting these clustering models. The data was then split into six clustersbecause itissimple to predictcustomer behavior usingdatafromfourclusters.Buteachoftheclustershasits ownuniquetraits.
7. REFERENCES:
[1]AMAN BANDUNI, Prof ILAVENDHAN A, "Customer SegmentationUsingMachineLearning"2019International ConferenceofSecurity,PatternAnalysis.
[2]Z. Wang, Y. Zuo, T. Li, C. L. Philip Chen and K. Yada, "Analysis of Customer Segmentation Based on Broad Learning System," 2019 International Conference on Security,PatternAnalysis,andCybernetics(SPAC),2019,pp. 75-80,doi:10.1109/SPAC49953.2019.237870.
[3]H. Su-li, "The customer segmentation of commercial banks based on unascertained clustering," 2010 International Conference on Logistics Systems and Intelligent Management (ICLSIM), 2010, pp. 297-300, doi: 10.1109/ICLSIM.2010.5461416.
[4]X.Zhang,G.FengandH.Hui,"Customer-ChurnResearch Based on Customer Segmentation," 2009 International Conference on Electronic Commerce and Business Intelligence,2009,pp.443-446,doi:10.1109/ECBI.2009.86.
[5]X. Weiwen, C. Liang, Z. Zhiyong and Q. Zhuqiang, "RFM Value and Grey Relation Based Customer Segmentation Model in the Logistics Market Segmentation," 2008 InternationalConferenceonComputerScienceandSoftware Engineering, 2008, pp. 1298-1301, doi: 10.1109/CSSE.2008.79.