
International Research Journal of Engineering and Technology (IRJET) e-ISSN: 2395-0056
Volume: 13 Issue: 04 | Apr 2026 www.irjet.net p-ISSN: 2395-0072

International Research Journal of Engineering and Technology (IRJET) e-ISSN: 2395-0056
Volume: 13 Issue: 04 | Apr 2026 www.irjet.net p-ISSN: 2395-0072
Dr. Mulpuru Madhuri, Bandi Sameer, Kanuri Devi Sri Lakshmi Prasanna, Maddu Ganesh Manikanta, Pothina Rakesh
Department Of Civil Engineering Sanketika Vidya Parishad Engineering College (Approved by AICTE, New Delhi, Accredited by NAAC-A and Affiliated to Andhra University) P.MPalem, Behind International Cricket Stadium,VISAKHAPATNAM-530041
Abstract – Heavy trains cross railway bridges, pushing them with moving forces that might lead to issues like bending, tiny breaks, or material wear over time. Because of this stress, watching how these structures behaves matterssafety depends on it. Looking closely at two different kindsa metal one near Yelamanchili and a solid concrete type in Kadapa - helps spot differences through health-tracking methods. Sensors that catch shaking and sensors measuring internal stretch recorded data when trains passed by. The flexible steel version reacted with more movement, whereas the rigid concrete model stayed calmer, showing less shake during use. When sensors like accelerometers team up with strain gauges, measurements get sharper for checking how bridges behave. Evidence shows these tools catch shifts in structure, shape upkeep schedules better, while quietly boosting both safety and lifespan on train spans.
Key Words: Railway Bridge, Accelerometers, Strain gauges, Structural health monitoring, vibration analysis, Dynamic loads, Stiffness, Bridge safety.
Heavy trains pass over railway bridges, so these structures face shifting pressures that may lead to cracksorwear.Becauseofthisstress,watchinghow they behave matters a lot. One example looked at a metalbridgenearYelamanchili,anotherataconcrete one in Kadapa. Scientists applied tools like motion sensors and tension detectors. These recorded how each bridgeshook andstretched whentrains moved across. What happens underneath reveals what the eyecannotsee.Fromthedata,itbecomesclear-steel bridgesshakemorebecausetheybendeasier.Onthe flip side, concrete ones stay calmer thanks to their rigidnature.Monitoringthroughsensorsworkswell, catchingissuesearly.Thisapproachhelpstrackhow structures behave over time. Problems get spotted before they grow serious. Maintenance improves whenguidedbyrealmeasurements.Safetyclimbsas aresultofconstantobservation.
Heavy trains cross rivers, roads, or deep gaps on railwaybridges-thesecrossingsmustholdupunder constant stress. Built tough, they face both steady weight and sudden forces all day long. Safety depends on their ability to last without weakening overtime.
1.2
Over time, repeatingloads alongwith weather shifts slowly wear down materials in train bridge parts. Watching how these structures behave day by day offersclearsignswhensomethingbeginstoweaken. Spot checks happen less often now since live data streams show problems before they grow. Fixing small issues early keeps bigger breakdowns from happeninglateron.
When trains move across bridges, shaking happens along with shifts in shape and changes to internal forces. Because of this motion, engineers watch how weightspreadsthroughmaterials,noticeweakspots, thencheckifeverythingworksasexpected.
From vibrations and strain readings captured by monitoring tools, differences in how steel versus concreterailbridgesrespondareexamined.Because trains create shifting forces, the way each material handles stress becomes clearer over time. When movement patterns change, signs of wear or harm might show up early. Through these measurements, upkeep needs come into view without waiting for visible flaws. Safety grows when hidden shifts in structure reveal themselves ahead of failure. Long term trust in bridges depends on catching small
International Research
Volume: 13 Issue: 04 | Apr 2026 www.irjet.net p-ISSN: 2395-0072
issues before they grow large. Maintenance works betterwhenbasedonrealresponsesinsteadoffixed schedulesalone.
Lookingintotworailwaybridgesformsthecorehere - one made of steel located at Yelamanchili, another of concrete at Kadapa - both examined through StructuralHealthMonitoringmethods.Vibrationand strain are captured while trains pass, thanks to sensors like accelerometers and strain gauges fixed ontothestructures.Fromthesereadings,patternsin how each bridge moves and handles force begin to emerge clearly. Though built differently, their realworld reactions under load reveal distinct traits when studied closely. Data shapes the comparison betweenthemetalandconcretespans,showinghow each manages stress over time. What stands out is not just material but response, measured precisely acrossrepeatedtrials
1. To study the concept of structural health monitoringinrailwaybridges.
2. To understand the workingof accelerometersand straingauges.
3. To measure vibration responses using accelerometers.
4. To measure strain in bridge components using straingauges
5.Lookingathowsteelandconcretebridgesrespond whentrainspassoverthem.
6. To compare the performance of Yelamanchili (steel)andKadapa(concrete)bridges.
7.Checkinghowwellsensorsspotshiftsinstructure.
8. To improve bridge safety and maintenance planning
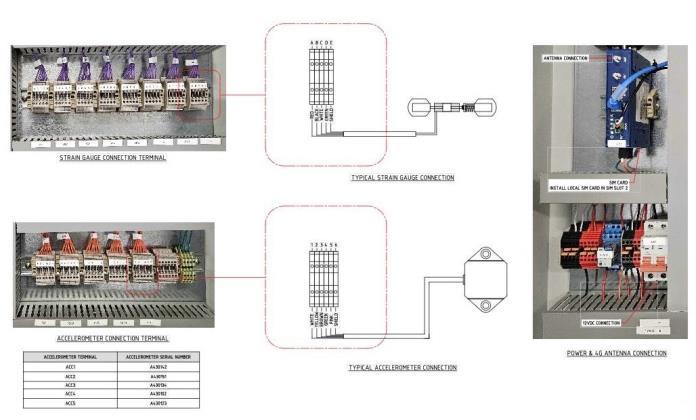
-1:Sensor’sconnectionlayout
Here comes the setup - strain gauges linked with accelerometers for checking bridge health. Wires meet terminals just right, showing how each piece hooks up. Diagrams guide the layout, clear but not fancy. Power flows where needed, arranged so nothing misses a beat. Vibration rides alongside strain, both tracked steady. Data piles up from rails above,feedingchecksonhowwellthingshold.Safety leansonthesenumbers,quietbutfirm.Performance getsitsproofhere,onereadingatatime.
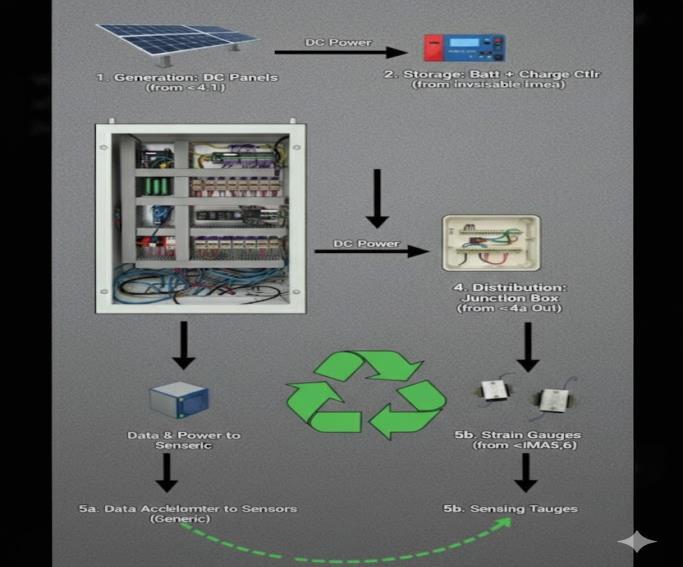
-2:Sensor’sconnectionlayout
Sunlight feeds the setup through photovoltaic cells. Stored energy moves under control to keep things running steady. Sensors on the bridge - ones that trackvibrationsandonesmeasuringtension-gather details constantly. Power flows without interruption thanks to smart management of reserves. This way, readings come in nonstop while using minimal
International Research Journal of Engineering and Technology (IRJET)
Volume: 13 Issue: 04 | Apr 2026 www.irjet.net
resources. Safety climbs because changes show up early. Long spans of usage test how well everything holds up over years. Information builds slowly, paintingaclearpictureofstructuralhealth.
METHODOLOGY
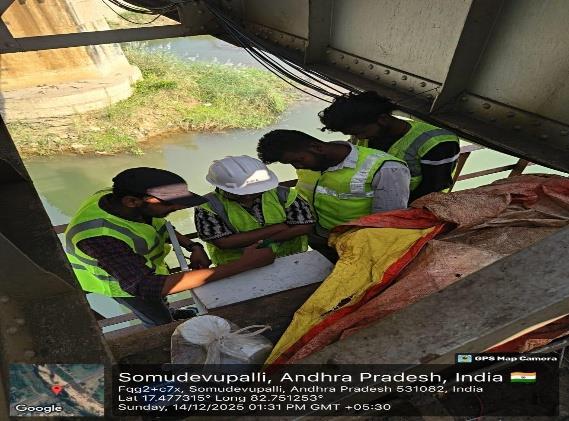
Process 1: Selection of Railway Bridge
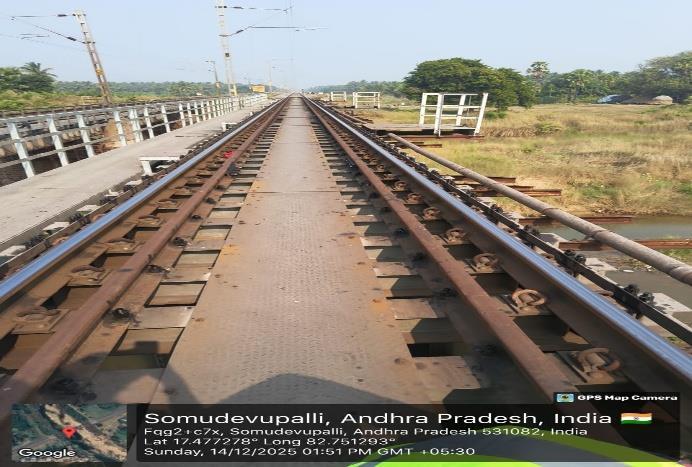
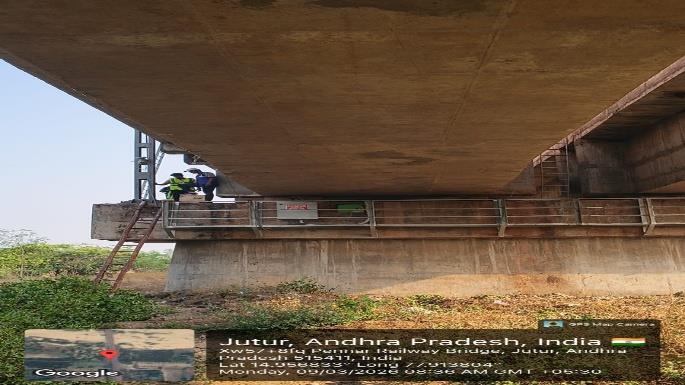
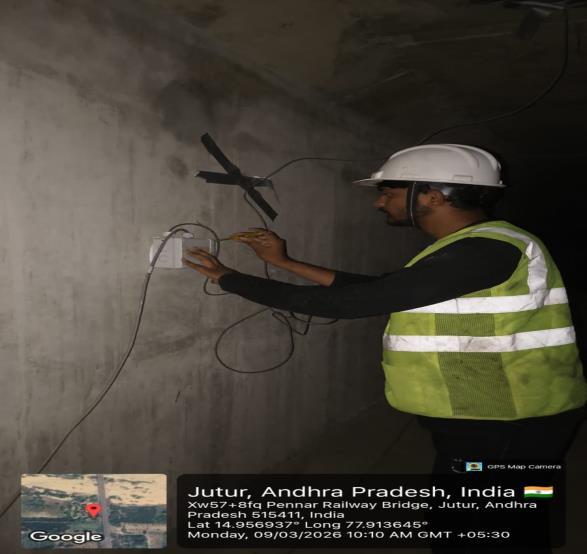
Process 2:.Installationofsensors
Visual Condition Study
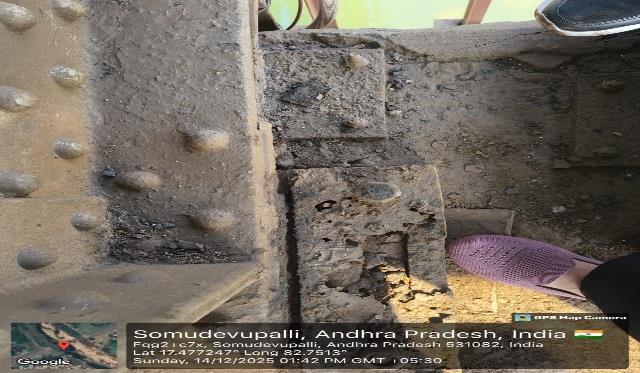
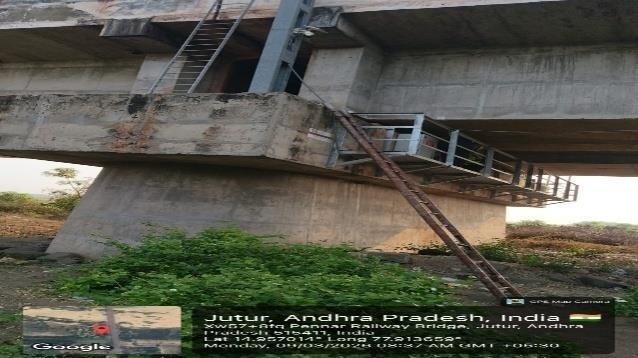
Surface Cleaning and Preparation
-0072
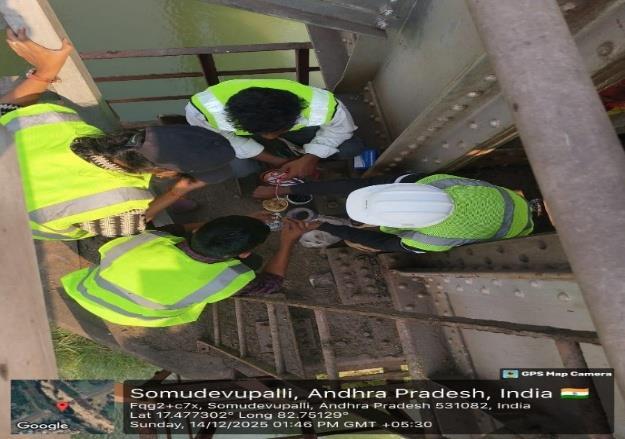
Fixing strain gauges on both bridges
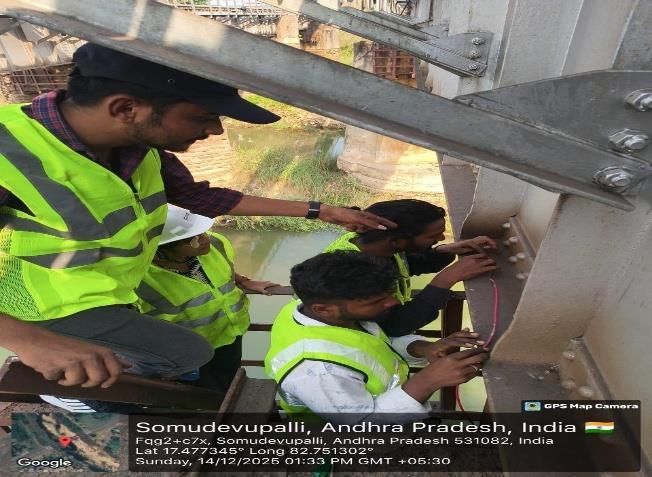
Placement of Accelerometers and sensors
Process 3: Data Collection During Train Movement
International Research Journal of Engineering and Technology (IRJET)
Volume: 13 Issue: 04 | Apr 2026 www.irjet.net

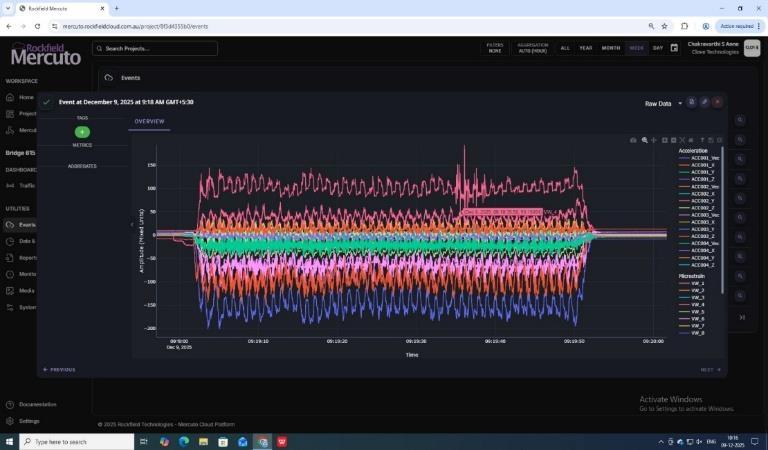
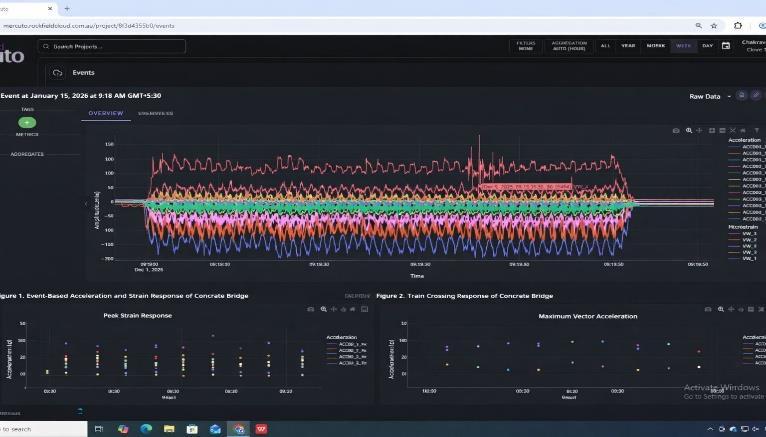
6: Identification of Maximum Strain and Time Period from Graph at steel and concrete bridge
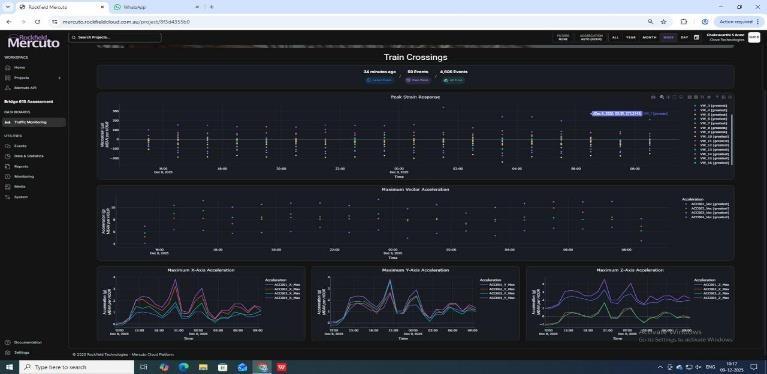
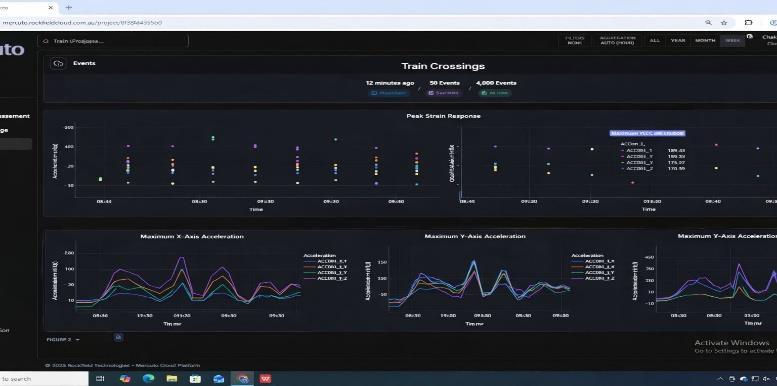
Underthegivenloads,safetyperformanceemerged clearly.Fromstraindata,stresslevelsinstructural partsfollowedHooke’sprincipleofelasticity.Where steelreactedsharply,concreteheldsteadywithout notableshift.Loadeffectsstayedwellwithinsecure marginsthroughouttesting.
StressiscalculatedusingHooke’sLaw,wherestress isdirectlyproportionaltostrain.
σ=Stress(N/m²orMPa)E=ModulusofElasticityof material (forsteel≈200GPa,forconcrete≈25GPa)
ε=StrainUsingthemaximum
International Research Journal of Engineering and Technology (IRJET) e-ISSN: 2395-0056
Volume: 13 Issue: 04 | Apr 2026 www.irjet.net p-ISSN: 2395-0072
Steel Bridge (Yalamanchili):
Strain=150µε=0.000150,E=200,000MPa
Stress=30MPa→Higherbutsafe
Concrete Bridge (Kadapa):
Strain=150µε=0.000150,E=25,000MPa
Stress=3.75MPa→Safeandstable
Process 8 : Natural Frequency Calculation
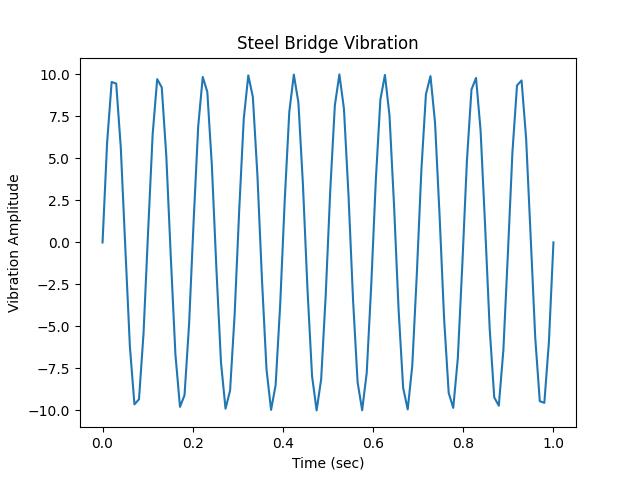
Thenaturalfrequencyofeachbridgewasdetermined from the acceleration-time data. The steel bridge demonstrated higher stiffness, whereas the concrete bridge was more flexible but stable, reflecting their respectivedynamiccharacteristics.
Formula: f=1/T
Steel Bridge (Yalamanchili):
T=0.05sec
f=1/0.05= 20 Hz
Concrete Bridge (Kadapa):
T=0.125sec
f=1/0.125= 8 Hz
Process 9: Dynamic Amplification Factor (DAF)
Surprisingly, the DAF analysis revealed how movementchanges things whenstacked againststill loads. One thing became clear - when vibrations enter the picture, both bridges react in ways standard tests miss entirely. The metal structure? It danced more under shifting forces than its counterparteverdid.
Formula: DAF = Dynamic Response / Static Response
Steel Bridge (Yalamanchili):
Yd=10mm,ys=5mm→DAF=10/5=2.0
Concrete Bridge (Kadapa):
Yd=6mm,ys=4mm→DAF=6/4=1.5
Process 10: Allowable stress and safety comparisons
Under pressure tests, each bridge handled force as expected. Safety margins lined up with required standards, showing no risk of failure. Where steel stood strong, concrete did too - both coping well under demand. Load performance matched design goals without issue. Stress levels stayed below maximumssetbyguidelines.
Steel Bridge (Yalamanchili):
ClculatedStress=30MPa
AllowableStress=250MPa
Status: Safe
Concrete Bridge (Kadapa):
CalculatedStress=3.75MPa
AllowableStress=5MPa
Status: Safe
Process 11: Safety actor calculations
Thebridge'sabilitytohandleweightsafelyshowsup inanumbercalledthesafetyfactor.Thisvaluecomes from dividing strength by expected load. Heavy traffic demands higher margins. Engineers check materials closely before deciding on numbers. Realworld conditions change how much stress a structure can take. Past performance helps guide future designs FOS means you take the stress something can handle, then divide it by what it actually faces.Whatyougetshowshowmuchextra load it could survive before failing. When FOS increases, safety improves too. The greater the number, the less likely failure becomes. Strength goes up as that figure climbs. Safety grows right along with it. A bigger margin shows things can handle more stress. The Yalamanchili steel bridge stands strong, its factor of safety measured at 8.33. Safety like that doesn’t come by accident - built in through careful design. This number means stress levels stay far below failure points under normal loads. Engineers checked every part before giving
approval. High margin? Yes - but needed for longterm reliability. Eight point three three isn’t just a figure-itreflectsreal-worldtoughness.
Volume: 13 Issue: 04 | Apr 2026 www.irjet.net p-ISSN: 2395-0072
The Kadapa concrete bridge holds steady with a factorofsafetyat 1.33 -itsstrengthstandsupwhen tested against real-world forces. Safety here isn’t assumed; numbers backhow well it bears load after load.
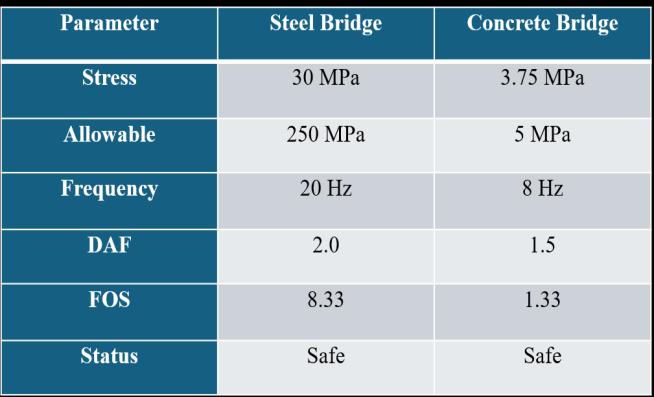
Checking bridge safety involved looking at stress levelsalongsidewhatthoselevelsshouldstayunder. Natural vibrations gave clues about structural behavior instead of just static measures. Impact effects appeared through something called DAF rather than pure load numbers. Strength margins showed up in FOS values, offering another layer beyondbasiccapacity.Eachfactorplayedaroleapart from the others, yet together they shaped the full picture. Steel Bridge Yalamanchili stress frequency DAF safety factor within limits Concrete Bridge Kadapa stress frequency DAF safety factor within limits.
Stresschecks,howoftentheyvibratenaturally,their reaction to moving loads, and safety margins were usedto testthe Yalamanchilisteel bridgealongwith theKadapaconcreteone.Thoughbuiltfromdifferent materials, each stayed below maximum permitted stress levels during testing. Vibration patterns sat well within ranges considered secure, meaning shaking won’t grow out of control. Responses under load changes remained predictable, thanks to low dynamic amplification readings. Safety numbers came back solid - no red flags there. With greater rigidity, the metal structure reacted more firmly when tested. Meanwhile, the concrete version handled everything steadily, without surprise shifts. Built differently, yet both stand ready for regular trafficwithoutconcern.
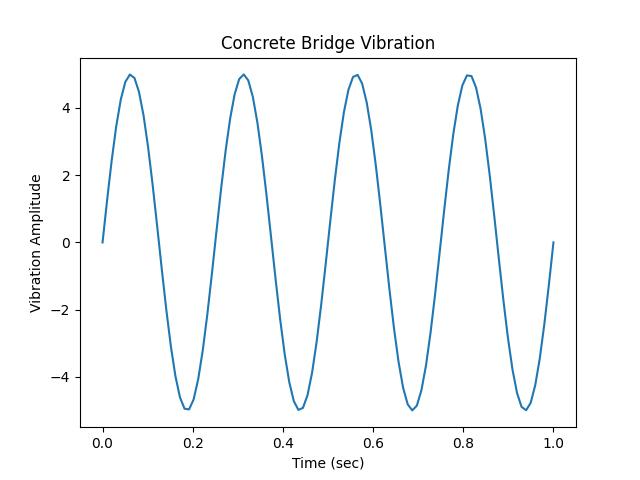
The structural response of the two railway bridges was observed using accelerometers and strain gauges during train movements. Key observations include:
Vibration Response: The steel structure near Yelamanchili swayed more, being less rigid. On the opposite end, Kadapa's concrete crossing stayed steadierthankstoitsfirmbuild.
Strain Response: Midway along the beam, sensors showed greater tension building up. Where forces piled on most, especially by the ends, stretching reached its peak. Readings shifted noticeably depending on which part of the structure was measured.
Dynamic Behavior: Flexing slightly when trains passed, each bridge held up without issue. Not once did they sag too much or shake in strange waysproof enough they’re sound. A smooth ride every timemeantallwaswellunderneath
Load Effects: The bridges showed predictable increases in strain and vibration with higher train speedsorheavierloads.
Sensor Performance: Sensors that measure movement along with devices tracking material stressdeliveredpreciseupdatesinstantly-thismade it possible to watch howthe bridge responded at all times.
From these findings, it's clear that using sensors helps track how railroad bridges react at any given moment. Tracking stress spots becomes possible whendataflowscontinuouslyfrommonitoringtools.
International Research Journal of Engineering and Technology (IRJET) e-ISSN: 2395-0056
Volume: 13 Issue: 04 | Apr 2026 www.irjet.net p-ISSN: 2395-0072
Safety assessments gain accuracy once live measurements are taken into account across entire structures
1. Study conducted on steel bridge (Yelamanchili)andconcretebridge(Kadapa)
NaturalFrequency:
Steel:20Hz
Concrete:8Hz
DynamicAmplificationFactor(DAF):
Steel:2.0
Concrete:1.5
StressValues:
Steel:30MPa(Safe)
Concrete:3.75MPa(Safe)
FactorofSafety(FOS):
Steel:8.33
Concrete:1.33
2. Steelbridgeshowshighervibration(flexible)
3. Concretebridgeshowslessvibration(stiffer)
4. Sensorsprovidedaccuratereal-time measurements
5. Bothbridgesarestructurallysafeundertrain loads
6. SHMsystemiseffectiveformonitoringand safetyimprovement
REFERENCES
Strength of Materials & Mechanics of Materials
Bansal, R. K. – Strength of Materials Used for basic concepts of stress, strain, and Hooke’s Law(σ=Eε).
Hibbeler, R. C. –Mechanicsof MaterialsUsed for understanding material behavior, deformation,andelasticity.
Structural Analysis
C. S. Reddy – Structural Analysis Used for load distributionandbehaviorofstructuralmembers.
Structural Dynamics
• S. Rajasekaran – Structural Dynamics Used for natural frequency, vibration, and dynamic responseanalysis.
Structural Health Monitoring (SHM)
•C. R. Farrar & K. Worden – Structural Health Monitoring Used for sensor-based monitoring andbridgeperformanceanalysis.
• Various research papers on SHM Used for advanced concepts of damage detection and monitoring.
Indian Standard (IS) Codes
ThefollowingcodesarepublishedbytheBureau of Indian Standards (BIS), India and used for designandsafetyevaluation:
• IS 800:2007 – General Construction in Steel Usedforsteeldesignandallowablestresslimits.
• IS 456:2000 – Plain and Reinforced Concrete Usedforconcretedesignandstructuralbehavior.
• IS 1893 (Part 1):2016 – Earthquake Resistant Design Used for dynamic analysis and vibration effects.
P. Cawley and R. D. Adams (United Kingdom – Imperial College London), “The location of defects in structures from vibration measurements,” Journal of Strain Analysis,1979.
Rytter (Denmark – Aalborg University), Vibration Based Inspection of Civil Engineering Structures,PhDThesis,1993.
S. W. Doebling, C. R. Farrar, M. B. Prime, and D. W. Shevitz (USA – Los Alamos National Laboratory),
“Damageidentificationand healthmonitoringof structuralsystems,”1998.
H. Sohn (South Korea/USA – KAIST / Los Alamos National Laboratory) and C. R. Farrar (USA – Los Alamos National Laboratory), “Damage diagnosis using time series analysis,” JournalofSoundandVibration,2001.
Y. Fujino (Japan – University of Tokyo), “Vibration, control and monitoring of bridges,” JournalofSoundandVibration,2002.
J. M. Ko and Y. Q. Ni (Hong Kong – Hong Kong PolytechnicUniversity),
“Technology developments in structural health monitoring,”EngineeringStructures,2005.
J. P. Lynch (USA – University of Michigan) and K. J. Loh (USA – University of California, San Diego), “Wirelesssensornetworksforstructural health monitoring,” Shock and Vibration Digest, 2006.
International Research Journal of Engineering and Technology (IRJET) e-ISSN: 2395-0056
Volume: 13 Issue: 04 | Apr 2026 www.irjet.net p-ISSN: 2395-0072
C. R. Farrar (USA – Los Alamos National Laboratory) and K. Worden (United Kingdom – University of Sheffield), “An introduction to structural health monitoring,” Philosophical TransactionsA,2007.
K. Worden and G. Manson (United Kingdom –University of Sheffield), “Machine learning in structural health monitoring,” Philosophical TransactionsA,2007.
V. Giurgiutiu studied the use of piezoelectric sensors for structural health monitoring. His researchdemonstratedthatthesesmartsensors can actively detect and locate small cracks or damages in structures. The study emphasized the effectiveness of piezoelectric materials in real-timemonitoringsystems,2008.
A. Mita and T. Yokoi developed an accelerometer-based monitoring system for bridges. Their work focused on measuring vibrationresponsescausedbymovingloads.The results confirmed that accelerometers are reliable tools for analyzing dynamic behavior andidentifyingstructuralchanges,2010.62
R. H. Scott et al. applied fiber optic strain sensors for monitoring prestressed concrete railway bridges. Their research involved measuring strain variations under loading conditions and identifying possible cracks. The study proved that fiber optic sensors are effectiveforlongtermmonitoring,2013.
P. Watters, S. Kim, and J. P. Lynch proposed a wireless sensor network system for bridge monitoring.Theirsystemallowedreal-timedata transmission and reduced the need for complex wiring, making SHM systems more efficient and cost-effective,2014.
S. Yoon, H. Sohn, and C. R. Farrar used distributedfiberopticsensorstomeasurestrain in railway bridge girders. Their research demonstratedthatcontinuousstrainmonitoring helpsinearlydetectionofstructuraldamageand improvesmaintenanceplanning,2016.
A. P. Adewuyi, Z. Wu, and M. Serker conducted real-time monitoring of bridges using accelerometers and strain gauges. Their study showed that combining both sensors provides more accurate andreliable results for structural healthassessment,2017.
R. Van der Kooij, M. J. Whelan, and K. Worden investigated distributed fiber optic sensing systems for railway bridges. Their research
highlighted the ability of these systems to monitor large areas of structures with high precision,2018
Y. Wang and J. Li studied strain monitoring for fatigue assessment in bridge structures. Their research showed that continuous monitoring helps in predicting the remaining life of bridge components,2019.
Z. Ye, X. Bao, and J. Chen focusedondistributed fiber optic sensing for measuring strain and temperature variations. Their study improved the understanding of environmental effects on bridgeperformance,2020.
M. Kumar, R. Sharma, and P. Singh studied bridge monitoring using accelerometers and telemetry software. Their work demonstrated that data analysis tools can effectively interpret vibrationdata,2021
J. Lorenzen, M. Krüger, and P. Andersen developedamethodfordetectingtrainaxles using accelerometer data. Their research showed that vibration signals can be used to tracktrainmovement,2022.