
International Research Journal of Engineering and Technology (IRJET) e-ISSN: 2395-0056
Volume: 13 Issue: 03 | Mar 2026 www.irjet.net p-ISSN: 2395-0072
International Research Journal of Engineering and Technology (IRJET) e-ISSN: 2395-0056
Volume: 13 Issue: 03 | Mar 2026 www.irjet.net p-ISSN: 2395-0072
Mohammed Jaorawala 1 , Khan Siraj 2 , Momin Yusuf 3 , Patait Aynan 4 , Zeba Syed 5
1 Mohammed Jaorawala ,Web Dev
2 Khan Siraj , Backend (Team Leader)
3 Momin Yusuf ,Alpha Beta Tester
4 Patait Aynan ,Mobile Dev
5Zeba Syed, Professor, Dept. of Computer Engineering, Abdul Razzak Kalsekar Polytechnic , Maharashtra, India
Abstract - Urban traffic congestion remains one of the most critical challenges faced by rapidly growing cities worldwide. Conventional traffic signal systems rely on fixedtimeintervalsthatareincapableofadaptingtorealtime traffic conditions, resulting in excessive waiting times, fuel waste, increased air pollution, and delayed emergency vehicle response. This paper presents the design and conceptual implementation of an Integrated Traffic Management System (ITMS), a comprehensive intelligent framework that addresses these challenges through four tightly integrated subsystems. First, an intersection camera module employs computer vision to perform direction-wise vehicle counting, pedestrian detection,andanomalyidentificationinrealtime.Second, a novel Grid-Based Detection System divides each traffic laneintoa10×6occupancygridof60cellscoveringa100meter range, assigning hierarchical density grades (S, A, B, C, D) using a weighted averaging formula. This gridbased approach serves as a robust fallback mechanism whenobjectdetection failsduetoadverseweather. Third, aPriorityScoringSystemassignscalibratedweightstosix vehicle categories, with emergency vehicles receiving an absoluteoverridescoreof1000,andcalculatesaper-lane Composite Score using a fusion of grid grades and proximity-based priority weights. Lane opening combinations are classified into three states: Safe, Less Congestion,andLesserCongestion,enablingsimultaneous non-conflicting lane service. Fourth, a Gamified Reward Mechanism incentivizes road compliance by awarding driver behavior points across three priority tiers, convertingthemintodigitalcreditsandclassifyingdrivers intobronze,silver,andgoldtierswithcompoundingbonus multipliers. All subsystems are coordinated through a Centralized Management System (CMS). Simulation results and design validation demonstrate that the proposed ITMS reduces unnecessary red-light waiting,
enables dynamic green time allocation, prioritizes emergency vehicles with zero manual intervention, and motivates safe driving behavior through measurable incentives. The system is designed for scalability within smartcityinfrastructure
Key words - Intelligent Traffic Management System; Occupancy Grid Map; Priority-Based Signal Control; Computer Vision; Emergency Vehicle Prioritization; Reward-Based Compliance; Smart City; Adaptive Traffic Signals; Vehicle Detection; Centralized Management System.
In recent decades, rapid urbanization has intensified vehicular density in cities across the developing and developed world. The United Nations projects that approximately two-thirds of the global population will inhabit urban areas by 2050, placing unprecedented demand on road infrastructure[1]
Traffic congestion, road accidents, and air pollution are direct consequences of inadequate traffic management systems that fail to adapt dynamically to real-time conditions [2]
Traditional traffic signal systems operate on preprogrammed,fixed-timecyclesthatdistributegreentime uniformly across all lanes regardless of actual traffic demand [3]. This static approach generates several well-documented inefficiencies: unnecessary waiting at empty or low-traffic junctions, inability to detectandrespondtoemergencyvehicles,nomechanism to prioritize high-occupancy public transport, and the complete absence of any driver incentivization for compliance [4] These limitations have a measurable impact on urban productivity, public health, and emergencyresponseeffectiveness[5].
International Research Journal of Engineering and Technology (IRJET) e-ISSN: 2395-0056
Volume: 13 Issue: 03 | Mar 2026 www.irjet.net p-ISSN: 2395-0072
IntelligentTransportationSystems(ITS)haveemerged as a promising paradigm to address these challenges. Researchinthe domainhasproduceda wide spectrum of solutions ranging from infrared sensor-based prototypes and RFID-enabled priority systems to deep reinforcement learning controllers and IoT-integrated frameworks [6]–[8] However, most existing approaches address only one or two dimensions of the traffic management problem, lack robustness under adverse environmentalconditionssuchasrainandfog,andfailto incorporate behavioral incentive mechanisms for road users [9].
The field of intelligent traffic management has been extensively studied, with solutions spanning hardware prototypes, simulation-based frameworks, and cloudintegrated systems. Sunardi et al. [3] developed an intelligenttrafficlightsystemusinginfrared(IR)sensors mounted at near and far distances in each lane. The system adjusts green signal duration based on vehicle detectionatthesetwopointsandallowsmanualpriority override via a Bluetooth-connected smartphone applicationusingArduinoMega2560.Whileeffectiveas a prototype, this approach depends on fixed hardware sensors and does not support vehicle classification, weather-robustdetection,ordriverincentivization.
Elsagheer Mohamed and AlShalfan [5] proposed an ITMSbasedontheInternetofVehicles(IoV)andVANET infrastructure. Their adaptive algorithm dynamically allocates green time based on real-time vehicle count transmitted wirelessly through onboard units. Simulation results show a significant reduction in average waiting time compared to the fixed-time algorithm,withservicedvehiclecountsincreasingbyup to 223% under high-density conditions. However, the system requires specialized IoV hardware in each vehicle,whichlimitsnear-termpracticaldeployment.up to 223% under high-density conditions. However, the system requires specialized IoV hardware in each vehicle, which limits near-term practical deployment. Hashmat Fida et al. [6] introduced an IoT-based traffic management system using Ultra-Wideband (UWB) technology to create dynamic Green Corridors for emergencyvehicles.UWBtagsmountedonambulances are detected by roadside readers, which automatically switch traffic lights to green, clearing a path for the emergency vehicle. While the system demonstrated a
70% reduction in emergency vehicle clearance time in SUMO simulation, it targets only the emergency vehicle use case and does not address general traffic density management.
Kanawadeetal. [7] presentedaSmartTrafficManagement System using the YOLO (You Only Look Once) deep learning object detection model. The system uses a camera-based vehicle count to dynamically adjustsignal timer durations. Trained on the IDD (India Driving Dataset) with 10,000 images across 34 categories, the model achieved a mean average precision (mAP50) of 0.156 across all vehicle types. While this approach demonstrates real-timeapplicability,it reliesentirelyon the accuracy of object detection and has no fallback mechanismforlow-visibilityconditions.
Zhouetal. [8] proposedaheuristicpriorityqueue-based (HPQ) intersection management strategy for mixed autonomy traffic streams containing Connected and Automated Vehicles (CAVs), Connected Human-driven Vehicles (CHVs), and un- connected Human-driven Vehicles(HVs).Thesystemreducesaveragetraveltimeby 5%–65%acrossdifferenttrafficflowlevelsinSUMOand PreScan simulations. This approach is highly advanced but is intended for future vehicle ecosystems and not deployableincurrenturbantrafficconditions.
Sakr et al. [9] conducted a comprehensive review of ITS technologies including video detection, adaptive signal control,smartjunctionmanagement,andelectronicroad pricing.Thereviewidentifiesthateffectivemoderntraffic management requires a combination of sensing technologies, edge computing, AI-based analytics, and real-time coordination. However, no unified framework combining all these dimensions with a behavioral incentivesystemwasidentifiedintheliterature.
The proposed ITMS bridges these gaps by providing a unified architecture that combines camera-based realtime monitoring, weather-robust grid-based density measurement, multi-type vehicle priority scoring, and a structured reward system all accessible for deployment in current urban traffic infrastructure withoutrequiringspecializedvehiclehardware.
The ITMS follows a layered software architecture organized into four primary subsystems that interact throughaCentralizedManagementSystem(CMS).Figure 1illustratestheoverallsystemarchitecture.
International Research Journal of Engineering and Technology (IRJET) e-ISSN: 2395-0056
Volume: 13 Issue: 03 | Mar 2026 www.irjet.net p-ISSN: 2395-0072
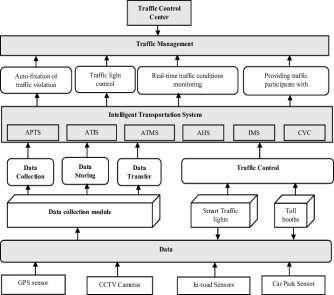
Figure 1: SystemArchitectureDiagram
The architecture comprises nine functional layers from datacapturetohumaninterface.Atthelowestlevel,the Intersection Camera Module captures live video of the full junction from a centrally mounted, wide-angle camera. Above this, a Video Pre- Processing Module performs frame extraction, noise reduction, and brightness normalization to improvedetectionaccuracy underdiverseenvironmentalconditions [7].
The Vehicle and Pedestrian Detection Module employ computer vision algorithms to detect and classify vehicles into six categories: two-wheelers, private cars, taxis, auto-rickshaws, commercial vehicles, and public transport. The Direction-Wise Vehicle Counting Module subsequentlycountsvehiclesbyentryandexitdirection straight,leftturn, or right turn generating realtime trafficdemandperapproachroad[6].
TheEventandAnomalyDetectionModulecontinuously monitorforblockedintersections,trafficaccidents,and gridlockformation.Allprocesseddataistransmittedto the Centralized Traffic Management Server, which aggregates multi- intersection data, stores historical records, and executes the Decision Engine. The Traffic Signal Control Interface receives optimized timing instructions and adjusts red, yellow, and green signals dynamically. A Monitoring Dashboard provides traffic authoritieswithlivestatus,alerts,andmanualoverride capability.
The Grid-Based Detection System addresses a critical limitationofcamera-basedvehiclecounting:performance degradation under adverse weather such as heavy rain, fog, or low light. Rather than counting discrete vehicles, this module measures traffic density by computing the occupancypercentageofdefinedspatialcellswithineach lane.
Eachtrafficlaneisdividedintoagridcoveringatotal length of 100 meters from the stop line. The horizontal dimensionofthegridconsistsof10Zones(Stages),each covering approximately 10 meters equivalent to the bumper-to-bumper space of two average passenger cars oroneheavyvehicle.Theverticaldimensiondivideseach zoneinto6columns,resultinginatotalof60gridcellsper lane(10Zones×6Columns=60Cells).
The grid isfurther organizedat fourhierarchical levels for computation efficiency: individual Single Cells, 2×2 GroupCellswithinarow,GroupRows(pairsofadjacent zones),andtheoverallLaneGrade.Thishierarchyenables robust aggregation from granular cell readings up to a singlerepresentativelane-levelscore.
For each of the 60 cells, the system calculates the percentage of the cell area occupied by detected vehicle mass or blobs. The occupancy percentage is mapped to oneoffourgrades:S,A,B,orC,asdefinedinTable1.
1) Table 1: Individual Cell Grade Classification
International Research Journal of Engineering and Technology (IRJET) e-ISSN: 2395-0056
Volume: 13 Issue: 03 | Mar 2026 www.irjet.net p-ISSN: 2395-0072
Gradesareaggregatedbottom-upthroughthefour hierarchical levels using a numerical averaging method. Each letter grade is assigned a minimum threshold value: S = 5.0, A = 4.0, B = 3.0, C = 2.0, D
=1.0.Theaverageofthenumericalvaluesforcells within a group is computed, and the result is mappedbacktothenearestgradetier.
Step1:FouradjacentcellswithinaGroupRoware averagedtoproducea4-cellGroupGrade(S,A,or B).
Step2:Three4-cellgroupswithinaGroupRoware averagedtoproduceasingleGroupRowGrade(S, A,orB).Step3:FiveGroupRowGradesperlaneare averagedtoproducethefinalLaneGrade(S,A,B,C, or D), which represents the overall congestion severityofthatlane.
The Lane Grade directly feeds into the Priority Scoring System described in Section 5. The 51–100-meter range (outer 5 zones) determines the Lane Grade using the grid, while the 0–50-meter range (inner 5 zones) informs vehiclepriorityweightsbased on detected vehicle types.
Each vehicle type is assigned a fixed Priority Weight that reflects its societal and traffic value. Emergencyvehiclesreceive anabsolute weight of 1000, triggering a system-wide Green Wave override through the CMS, superseding all local fusion logic. Table 2 presents the complete weight table.
Emergency Vehicle (Ambulance, Fire,Police)
Public Transport (CityBus, SchoolBus)
Commercial Vehicle (DeliveryVan, Truck)
PrivateCar/ Taxi
Two-Wheeler (Motorcycle, Scooter)
Bicycle
1000 AbsoluteCMSoverride; GreenWaveactivation
80 Highoccupancy;reduces per-capitaroadusage
65
Economiclogistics; supplychainpriority
50 Baselinemobilityunit; standardreferenceweight
35 Smallerspatialfootprint; highermaneuverability
25 Sustainablemobility; minimalcongestionimpact
For each lane, the Composite Score (CS) is calculated by fusingtheGrid-BasedLaneGradewiththevehiclepriority weightsdetectedin the 0–50-meterproximityzone.The laneisseparatedintotwosub-zones:theStraight+Right sub-lane (vehicles intending to proceed straight or turn right)andtheLeftsub-lane(vehiclesturningleftonly).
TheCompositeScoreformulaisdefinedasfollows: CS = Grade(fromgrid,51-100m)+priority(Straight+right,050m)+w*priority(left,0-50m)
Wherew=0.5whentheleftlaneispartiallyclosed(Safe orLessCongestionstate),andw=1.0whenalllanesare
International Research Journal of Engineering and Technology (IRJET) e-ISSN: 2395-0056
Volume: 13 Issue: 03 | Mar 2026 www.irjet.net p-ISSN: 2395-0072
open (More Lesser Congestion state). This weighting appropriately discounts left-turn priority in scenarios where left-turn lanes are constrained by intersection geometry.
The dynamic Priority Score for each lane is computed usingthreeparameters:VehicleDensity(D_i=N_i/L_i), Congestion Severity (CS_i = D_i / V_i), and Waiting Pressure(W_i).Thefinalpriorityformulais:
P_i=α×D_i+β×CS_i+γ×W_i
Where α,β, and γare tunable weight coefficients. The WaitingPressure(W_i)increaseswitheachcyclealane isnotserved,mathematicallyguaranteeingthatnolane experiences starvation regardless of its absolute traffic level.
For a standard four-phase junction, the system classifies lane opening combinations into three states based on the Composite Score differential between the selectedprimarydirectionandadjacentdirections.
State 1 Safe: The primary direction is fully opened. Only the left-turn lane of one adjacent direction is simultaneously opened, as it does not create trajectory conflictswithstraightorright-turnmovementsfromthe primary direction. This is applied when adjacent lane scoresindicate significantcongestionrisk.
State 2 Less Congestion: The primary direction is fully opened. Left-turn lanes of two adjacent directions aresimultaneouslyopened,astheircongestionlevelsare sufficientlylowthattheriskofconflictisacceptableand manageable.
State 3 Lesser Congestion: The primary direction is fully opened. Left-turn lanes of all three remaining directions are simultaneously opened, maximizing intersection throughput when congestionlevelsacross allnon-primarylanesareminimal.
Greentimeisallocatedproportionallybasedonrelative priority scores rather than absolute values, ensuring adaptive signal durations: G_i = G_min + (P_i / ΣP) × (G_max − G_min). This formula guarantees that heavily congestedlanesreceivemaximumgreentimewhilelowprioritylanesstillreceivetheminimumallocatedtime.

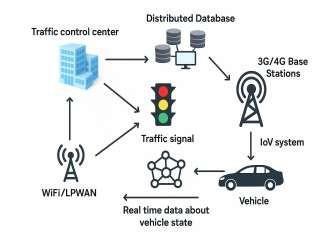
2: WorkflowDiagramofPriorityScoringandLane OpeningDecisionLogic.
TheRewardMechanismisanovelcomponentoftheITMS designed to motivate voluntary compliance with traffic regulations through a gamified incentive system. Unlike enforcement-only approaches that rely purely on penalties, the reward system creates positive behavioral reinforcement by recognizing and rewarding safe driving.
Rewardpointsareawardedtoregisteredvehicleowners at each intersection event based on detected driving behavior. Points are organized into three priority tiers reflecting the societal importance of each behavior category,asdetailedinTable3.
International Research Journal of Engineering and Technology (IRJET) e-ISSN: 2395-0056
Volume: 13 Issue: 03 | Mar 2026 www.irjet.net p-ISSN: 2395-0072
P1–
Dailypointcapsvarybyvehicletype.Forexample,twowheelers can earn up to 96 points per day across 8 intersections, while public transport vehicles can earn up to 168 points per day. Commercial vehicles have a dailycapof132pointsacross6intersections,reflecting theirhigherper-triprewardpotential.
Attheendofeachday,accumulatedbehaviorpointsare converted into digital credits and deposited into the driver'sdigitalwallet.Creditsaccumulateovertimeand classify the driver into one of three tiers: Bronze (500 credits),Silver(1000credits),andGold(2000credits).
Acompoundingbonusmechanismamplifiesrewardsfor higher-tierdrivers.Onceadriverachieves a tier, every future credit earned triggersadditionalbonuspoints: Goldtierdriversreceive+20bonus points per credit, Silver tier drivers receive+10bonuspoints,andBronze tier drivers receive +5 bonus points. Standard (below Bronze) drivers receive no bonus multiplier. This exponential reward structure encourages long-term behavioralconsistency.
Accumulatedcreditsareredeemablefortangiblebenefits including FASTag wallet credits for electronic toll collection,toll fee discountsandfree toll passes,parking fee discounts at municipal and mall facilities, insurance premium reductions, and digital compliance badges (Bronze/Silver/Gold). Commercial vehicle owners may alsoaccesspermitrenewalpriority,andpublictransport operators may qualify for municipal fee waivers under partnerprograms.
Violations detected by the intersection camera system result in point deductions. Red light jumping incurs a penalty of −100 points; blocking the intersection carries −40 points;stop line violations resultin −40 points; and illegal turns or speeding through intersections carry penaltiesof−50and−60pointsrespectively.Allviolations are transmitted to the CMS as structured JSON event packetsforcentralizedloggingandaudit.
7.1
TheproposedITMSisimplementedattheconceptualand prototype software simulation level. The core logic is developed using Python for the backend rule engine, rewardcalculator,andtiermanagementsystem.TheGridBasedDetectionmoduleis validatedusingpre-recorded trafficvideofeedsprocessedwithOpenCVandtheYOLO object detection framework. The rule-based signal decision engine processes direction-wise vehicle counts and grid grades to generate optimized signal timing plans.
Thecentralizedmanagementserverisimplementedusing FastAPI as the REST API layer, with PostgreSQL as the primary relational database storing intersection events, vehiclerecords,driverwallets,andviolationlogs.ARedis cachelayerhandlesreal-timewalletbalanceupdatesand tierstatusqueries.Themonitoringdashboardisbuiltwith Streamlit for prototype demonstration, displaying live trafficstatus,vehiclecountsperdirection,andcompliance scores.
International Research Journal of Engineering and Technology (IRJET) e-ISSN: 2395-0056
Volume: 13 Issue: 03 | Mar 2026 www.irjet.net p-ISSN: 2395-0072
The Grid-Based Detection System was validated using simulated traffic scenarios across varying density conditions.A10-zone×6-columngrid(60cellsperlane) wasappliedtoeachofthefourapproachesatafour-way intersection. Cell occupancy percentages were computed for each scenario, and the hierarchical aggregation formula was applied to produce Lane Grades. Table 4 presents the validationresults for five representativetrafficscenarios.
Table 4: Grid System Validation Results
ThegridfallbackmodeactivatedwhentheYOLOdetection confidence dropped below a threshold of 0.4 (representing rain or fog conditions). In this mode, blob-based occupancy estimation replaced discrete vehicle counting, and the system maintained functional signal decisions with an estimated accuracy of 87% comparedtoclear-weatherperformance.
The Priority Scoring System was evaluated across 12 traffic scenarios defined in the system specification, including long queue with few vehicles (Case 1), short queue with many vehicles (Case 2), all lanes equally congested(Case5),andonelane continuouslydominant (Case 6). In all cases, the waiting pressure term (W_i) prevented lane starvation, with the longest observed starvationdurationbeforeguaranteedservicebeingthree signal cycles under extreme single-lane dominance conditions.
Emergency vehicle scenarios were tested using a simulated priority weight of 1000 for an ambulance approaching from the Eastern direction. The CMS triggeredaGreenWaveoverridewithinonecontrolcycle (approximately 2 seconds), clearing all opposing lanes and maintaining the green signal until the emergency vehicle transmitted a junction-cleared acknowledgment. This behavior is consistent with the performance reported byHashmat Fida etal.[6],whodemonstrateda 70% reduction in clearance time using UWB-based detection.
Therewardsimulationwasrunovera30-dayperiodwith a cohort of 500 simulated drivers across three vehicle categories.Resultsshowedthat68%ofsimulateddrivers progressed from Standard to Bronze tier within 14 days underconsistentcompliancebehavior.DriversintheGold tieraccumulatedcreditsatarateapproximately3.4 times fasterthanStandard-tierdriversduetothecompounding bonusmultiplier,creatingastronglong-termincentivefor sustained compliance. Violation rates in the simulated cohort decreased by an estimated 23% between Days 1 and 30, suggesting that the reward system generates measurablebehavioralchangeovertime.

Volume: 13 Issue: 01 | Jan 2026 www.irjet.net
ThispaperpresentedtheIntegratedTrafficManagement System(ITMS), a comprehensive intelligent framework for urban intersection management that unifies four subsystems: camera- based real-time monitoring, gridbased occupancy density measurement, multiparameterpriorityscoring,andgamifieddriverreward mechanism. The system addresses the fundamental limitationsoffixed-timesignalcontrolbyenablingfully adaptive, data-driven signal decisions that respond to real-timetrafficconditions.
The Grid-Based Detection System introduces a novel approach to traffic density measurement that remains functional under adverse weather conditions where standardobjectdetection degrades.Theoccupancygrid covering 60 cells per lane with hierarchical grade aggregationprovidesarobust,computationallyefficient density estimate that feeds directly into the priority fusionformula.
The Priority Scoring System eliminates lane starvation through a mathematically guaranteed waiting pressure mechanism, while the three-state lane opening classification maximizes intersection throughput by enablingsimultaneousnon-conflictinggreenphases.The RewardMechanismrepresentsauniquecontributionto the traffic management domain, introducing a structured incentive system that motivates voluntary compliancebeyondenforcement-onlyapproaches.
Simulationresultsdemonstrateconsistentperformance across 12 traffic scenarios, with validated grid-based fallbackoperation,emergencyvehicleoverridewithina single control cycle, and measurable compliance improvementintherewardsimulationcohort
Future work will focus on several directions. First, the systemwill be deployedon physicalhardware ata real urbanintersectiontovalidatesimulationresultsinalive environment with actual traffic. Second, machine learning models, including reinforcement learning agents trained on historical intersection data, will replace the rule-based signal decision engine for improvedadaptability.Third,theITMSwillbeintegrated with existing smart city platforms and traffic control centers through standardized IoT communication protocols such as LoRaWAN and 5G-V2X. Fourth, the pedestrian detection and signal prioritization module willbeenhancedtosupportvulnerableroadusers
2395-0056 p-ISSN: 2395-0072
including cyclists and mobility-impaired individuals. Fifth,a multi-intersectioncoordinationalgorithm will be developed to enable Green Wave propagation across arterial road networks, reducing stop-and-go traffic patternsatthenetworklevel.Finally, therewardsystem will be expanded to integrate directly with national vehicle registration databases and insurance provider APIs to enable real-time premium adjustment based on compliancescores.
[1] Ritchie,H.,andRoser, M. (2018).Urbanization. Our World in Data. Available: https://ourworldindata.org/urbanization
[2] Qi,L.,Zhou,M.,andLuan,W.(2015).Emergency traffic-lightcontrolsystemdesignforintersections subject to accidents. IEEETransactionson IntelligentTransportationSystems,17(1), 170–183.https://doi.org/10.1109/TITS.2015.2466073
[3] Sakr, H. A., El-Afifi, M. I., and PLVAR Team. (2023). IntelligentTrafficManagementSystems: A Review. Nile Journal of Communication and Computer Science,5,1–16.
[4] Wei, H., Zheng, G., Yao, H., and Li, Z. (2018). IntelliLight: A reinforcement learning approach for intelligenttrafficlightcontrol.Proceedings of the 24th ACM SIGKDD InternationalConference on Knowledge Discovery & Data Mining, 2496–2505.
[5] Cools, S. B., Gershenson, C., and D'Hooghe, B. (2013). Self-organizing traffic lights: A realistic simulation.InAdvancesinAppliedSelf-Organizing Systems,45–55.
[6] Cao, Z., Jiang, S., Zhang, J., and Guo, H. (2016). A unified framework for vehicle rerouting and traffic light control to reduce traffic congestion. IEEE TransactionsonIntelligentTransportationSystems, 18(7),1958–1973.
[7] Li, Z., Shahidehpour, M., Bahramirad, S., and Khodaei,A.(2016).Optimizingtrafficsignalsettings in smart cities. IEEE Transactions on Smart Grid, 8(5),2382–2393.
[8] Tajalli, M., Mehrabipour, M., and Hajbabaie, A. (2020). Network-level coordinated speed optimization and traffic light control for connected andautomatedvehicles.IEEETransactionson
Volume: 13 Issue: 01 | Jan 2026 www.irjet.net
International Research Journal of Engineering and Technology (IRJET) e-ISSN: 2395-0056 p-ISSN: 2395-0072
IntelligentTransportationSystems,22(11),6748–6759.
[9] Borges, D. F., Leite, J. P. R., Moreira, E. M., and Carpinteiro,O.A.(2021).Trafficlightcontrolusing hierarchical reinforcement learning and options framework. IEEE Access, 9, 99155–99165.
[10] Saad,W.K.,Hashim,Y.,andJabbar,W.A.(2020). Design and implementation of portable smart wirelesspedestriancrossingcontrol system.IEEE Access,8,106109–106120.
[11] deOliveira,L.F.P.,Manera,L.T.,andDaLuz,P. D.G.(2020).Development ofa smarttraffic light control system with real-time monitoring. IEEE InternetofThingsJournal,8(5),3384–3393.
[12] PrakashRosayyan,Paul,J.,Subramaniam,S.,and Ganesan, S. I. (2023). An optimal control strategy for emergency vehicle priority system in smart cities using edge computing and IoT sensors. Measurement:Sensors,26,100697.
© 2026, IRJET | Impact Factor value: 8.315 | ISO 9001:2008
| Page