
International Research Journal of Engineering and Technology (IRJET) e-ISSN: 2395-0056
Volume: 13 Issue: 04 | Apr2026 www.irjet.net p-ISSN: 2395-0072

International Research Journal of Engineering and Technology (IRJET) e-ISSN: 2395-0056
Volume: 13 Issue: 04 | Apr2026 www.irjet.net p-ISSN: 2395-0072
Suraj
Jathar1 & Sandesh Kadam2
¹ Final Year M.Sc. (Computer Applications) Student, Department of Computer Applications, Pratibha College of Commerce and Computer Studies, Chinchwad, Pune, Maharashtra, India
² Final Year M.Sc. (Computer Applications) Student, Department of Computer Applications, Pratibha College of Commerce and Computer Studies, Chinchwad, Pune, Maharashtra, India
Abstract - This study uses data analytics to examine how government actions affect the Indian economy [1][3]. Important economic metrics like GDP growth, inflation, unemployment, tax income, and digital transactions are used in the study [3]. To identify trends and patterns throughout time, the data is gathered and examined. To clearly illustrate howtheseindicatorsvaryand howtheyrelatetooneanother, a variety of graphs and charts are used. In order to forecast future economic patterns, the study also employs machine learning models such as Random Forest, Decision Tree, and Linear Regression [7].
The findings demonstrate that the economy is clearly impacted by governmental policy. Economic development is significantly influenced by tax laws and digital expansion [5]. According to the forecast results, the economy is expected to be steady for the next several years. This study promotes improved data-driven decision-making and aids in understanding how policies impact the economy.
Key Words : Indian Economy, Government Policy, Data Analytics, Machine Learning, GDP Growth, Economic Analysis, Prediction, Inflation
ThisThisstudyfocusesonusingdataanalyticstoexamine howgovernmentpoliciesaffecttheIndianeconomy[1][3]. Important economic metrics that are frequently used to gaugeeconomicsuccessaretakenintoaccountinthisstudy, includingGDPgrowth,inflation,unemployment,taxincome, anddigitaltransactions[3].Anation'seconomicstructureis greatly influenced by its government policies [1][2]. Economicreforms,
digital payments, and taxation policies all have a direct impactonemployment,GDP,andgeneralfinancialstability. Understanding how these policies impact economic performanceovertimeandacrossmanyeconomicsectorsis crucial.
Inordertofindtrends,patterns,andconnectionsbetween variousindicators,historicaleconomicdataisgatheredand examinedinthisstudy.Thedataisprocessedandvisualized using data analytics techniques, which facilitates the
understanding of intricate economic activity and the derivationofsignificantdiscoveries[5].
The data is examined using a variety of visualization techniques, including correlation matrices, distribution analysis, bar charts, and line charts. By determining the relationshipsbetweenvariousvariablesandhowtheyevolve overtime,thesemethodsaidinimprovingtheinterpretation ofeconomic patterns.
To forecast future economic patterns, machine learning models like Random Forest, Decision Tree, and Linear Regressionareusedinadditiontodataanalysis[7].These models increase the accuracy of economic forecasting by calculatingfutureGDPgrowthbasedoncurrent economic conditions.Thisstudy'sprimarygoalistoenableimproved decision-making by offering a data-driven method for assessingtheeffectsofpolicies.
TheIndianeconomyissignificantlyshapedbygovernment policy[1][2].Itisstilldifficulttogaugetheirtrueinfluenceon economic metrics including GDP growth, inflation, unemployment,taxrevenue,anddigitaltransactions[3].
Adata-drivenapproachisrequiredtocomprehendhowthese policies affect economic performance over time, while traditional analysis frequently explains policy effects conceptually.Byusingdataanalyticsandmachinelearning approachestoassesshowpoliciesaffecttheIndianeconomy, ourstudyfillsthatgap[7].
1.TotoexaminehowgovernmentpoliciesaffecttheIndian economy.
2. To investigate the connections between important economic metrics like tax revenue, GDP growth, inflation, unemployment,anddigitaltransactions.
3. To contrast economic metrics prior to and during the executionofsignificantgovernmentinitiatives.
4. To forecast GDP growth in the future using economic factors.
5.Toofferdata-driveninsightsforimprovedcomprehension andassessmentoftheefficacyofpolicies.
International Research Journal of Engineering and Technology (IRJET) e-ISSN: 2395-0056
Volume: 13 Issue: 04 | Apr2026 www.irjet.net p-ISSN: 2395-0072
Numerousscholarshaveexaminedhowgovernmentpolicies affect country development and economic growth [1][4]. Economic indicators that are frequently used to assess an economy's success include GDP growth, inflation, unemployment,taxes,anddigitaltransactions [3].
PriorresearchontheIndianeconomyhasdemonstratedthe variousways inwhichpoliciesliketheGST,thegrowthof digitalpayments,andtaxreformshaveimpactedeconomic activity [1][5]. While some studies have investigated the significance of digital payments and financial inclusion in economic development, others have concentrated on taxationandrevenuegrowth.
StudiesthathavealreadybeendoneontheIndianeconomy frequentlyconcentrateonspecificpolicymeasureslikeGST, theexpansionofdigitalpayments, orinflation[1][3].Similar tothis,anumberofforecastingresearchsolelyusemachine learning for general prediction tasks or employ a small numberofeconomicvariables[7].
Nevertheless, there is little research that integrates importantmacroeconomicindicatorswithmanyaspectsof government policy in a unified data-driven analytical framework.Bycombininganalyticalandpredictivemethods with economic metrics like GDP growth, inflation, unemployment, tax revenue, and digital transactions, this study aims to close that gap. The research provides a combined approach that supports both policy impact evaluationandfutureeconomicforecasting.
This study examines how government policies affect the Indian economy using a quantitative and datadriven technique [3]. The study makes use of historical economic data gathered from reliable public sources, including the Reserve Bank of India (RBI), World Bank, International MonetaryFund(IMF),MinistryofStatisticsandProgramme Implementation(MoSPI),andNationalPaymentsCorporation ofIndia(NPCI)[2][3][4][5][6].
TheGDPgrowthrate,inflationrate,unemploymentrate,tax income, and digital transactions are among the chosen economic indicators for examination. These factors were includedbecausetheyreflectsignificantaspectsofeconomic performanceandareeitherdirectlyorindirectlyimpactedby decisionsmadeonpublicpolicy.
Annual economic observations gathered from publicly accessiblenationalandinternationaleconomicdatasetswere usedtocreatethedataset[3][6].Foranalysisandforecasting,
the gathered data was arranged in a standardized tabular style.
2.2
To eliminate inconsistencies and enhance usability, the datasetwas preprocessedandcleaned before analysis.To guaranteeanalyticalconsistency,numericalvariableswere normalized and any missing values were handled accordingly.Afterthat,thedatawasorganizedinawaythat made it easy to visualize and create machine learning models..
2.3
Exploratory Data Analysis (EDA) was performed to understandtrends,relationships,anddistributionpatterns among the selected economic indicators. Trend analysis, comparative analysis, correlation matrix, and graphical visualization techniques were used to identify meaningful patternsandinsightsfromthedata.
2.4
Apolicy-wisecomparisonapproachwasusedtostudythe effect of selected government policies on economic indicators.Theindicatorswereexaminedbeforeandafter major policy events such as the implementation of GST, digitalpaymentexpansion,corporatetaxreforms,andpostCOVIDeconomicrecoverymeasures[1][5].
2.5
Machine learning models like Random Forest Regressor, DecisionTreeRegressor,andLinearRegressionwereused toprojectfutureGDPgrowth[7].GDPgrowthwasthetarget variableinthesemodels,whichweretrainedusingspecific economicindicatorsasinputvariables.
2.6
Standard regression measures including R2 Score, Mean AbsoluteError(MAE),andRootMeanSquaredError(RMSE) were used to assess the machine learning models' performance. These measures aid in determining the best model for economic forecasting and evaluating model accuracy.
Thedesignandimplementationofthesuggestedeconomic analysissystemcreatedforthisstudyaredescribedinthis part.Thesystemisorganizedtousemachinelearningand dataanalyticstoexaminehowgovernmentpoliciesaffectthe Indianeconomy. Gatheringcrucialeconomicdata,including GDP growth, inflation, unemployment, tax income, and digitaltransactions,isthefirststepintheimplementation. After that, this data is preprocessed to eliminate discrepanciesandgetitreadyforadditionalanalysis.
Following preprocessing, trends, correlations, and policy implications are found using analytical and visualization
International Research Journal of Engineering and Technology (IRJET) e-ISSN: 2395-0056
Volume: 13 Issue: 04 | Apr2026 www.irjet.net p-ISSN: 2395-0072
approaches.Inthelatterphase,machinelearningmodelsare employedtoproducevaluableinsightsandforecastfuture economic patterns. The total lifecycle of the research processisdepictedhereinordertoclearlyandmethodically illustratethisentireoperation.
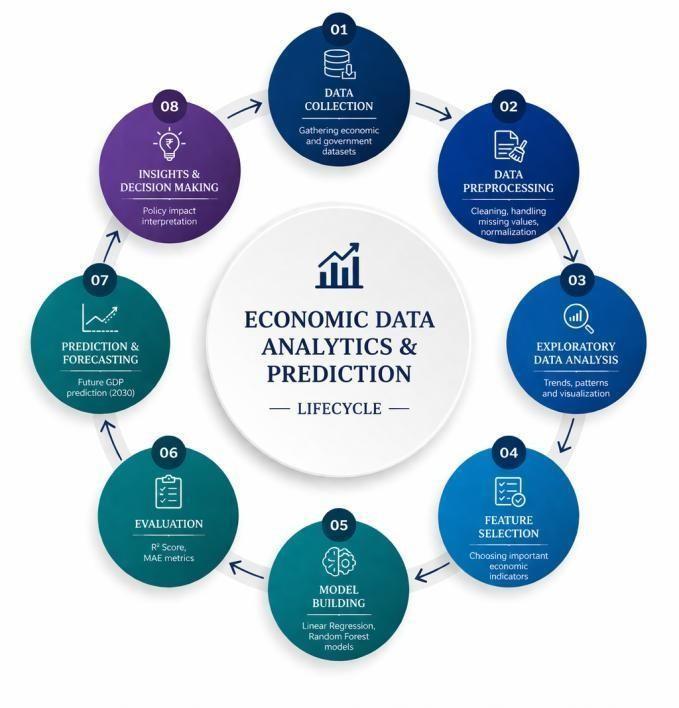
Numerous tools and technologies are used to help the implementationofthisresearch.Theprimaryprogramming languageforanalysisandmodelcreationisPython.NumPy facilitatesnumericalcomputations,whereasPandashandles and preprocesses data. Streamlit is utilized to create the analyticaldashboardthatpresentsresultsinapolishedand easy-to-use manner, while Plotly is used for data visualizationandinteractivechartcreation.
1. There are four primary parts to the suggested system. Economicindicatorsarearrangedintoastructureddataset duringthefirststepofdatagatheringandpreparation.
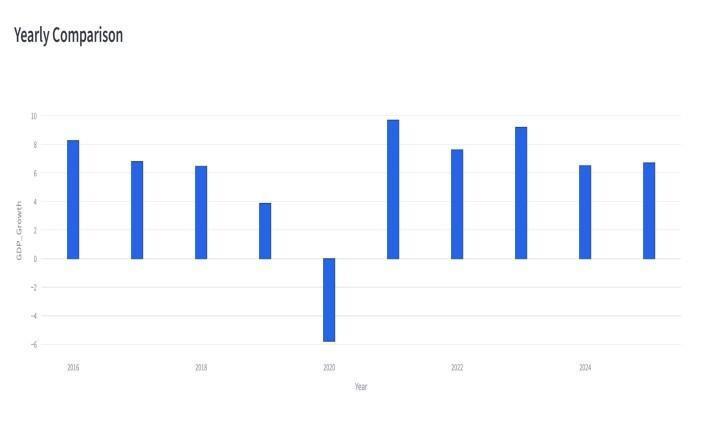
2.Analyticalvisualization,whichcomprisestrendanalysis, annual comparison, distribution analysis, and correlation matrixtoinvestigatelinksbetweenvariables,isthesecond component.
3. Key indicators are compared before and after policy implementation in the third component, which is policy impact evaluation.
4.Predictiveanalysis,whichusesmachinelearningmodels toprojectfutureGDPgrowth,isthefourthcomponent.When combined, these elements facilitate the analysis and successfulpresentationofstudyfindings.
The policy-wise analysis conducted for this study is presentedinthissection.Thegoalistoinvestigatetheeffects of certain government policies on key economic metrics,
includingGDPgrowth,inflation,unemployment,taxrevenue, and digital transactions [1][3]. A deeper understanding of howpolicydecisionsimpacttheIndianeconomyovertimeis made possible by the analysis of each policy's economic impact.
TheIndiantaxsystemunderwentsubstantialmodifications with the implementation of the Goods and Services Tax (GST)[1].Itwasputintoplacetostreamlinethetaxsystem andincreasetheeffectivenessoftaxcollectionnationwide.
TheIndianeconomyhaschangedsignificantlyasaresultof digitalpaymentpolicies[5].Thesuccessoftheseregulations and the growing uptake of digital financial systems are reflectedintheriseinUnified Payments Interface(UPI) transactions.
UPI transaction data analysis reveals a significant rising trend over time [5][10]. This suggests that increased transactionefficiencyandeconomicformalizationhavebeen facilitatedbythegrowthofdigitalpayments.Thenotionthat policy-driven digital transformation can have a favorable impact on economic development is further supported by theriseindigitaltransactions.
International Research Journal of Engineering and Technology (IRJET) e-ISSN: 2395-0056
Volume: 13 Issue: 04 | Apr2026 www.irjet.net p-ISSN: 2395-0072
In order to promote economic stability, investment, and business expansion, corporate tax reforms were implemented [1]. These reforms are crucial because they have the potential to affect both general economic performanceandindustrialactivity. Thisstudyusesspecificvariablestoexaminetheeconomic trendfollowingtheloweringofcorporatetaxes.Accordingto the analysis, these measures supported financial stability and corporate confidence, which had an indirect effect on economicgrowth.
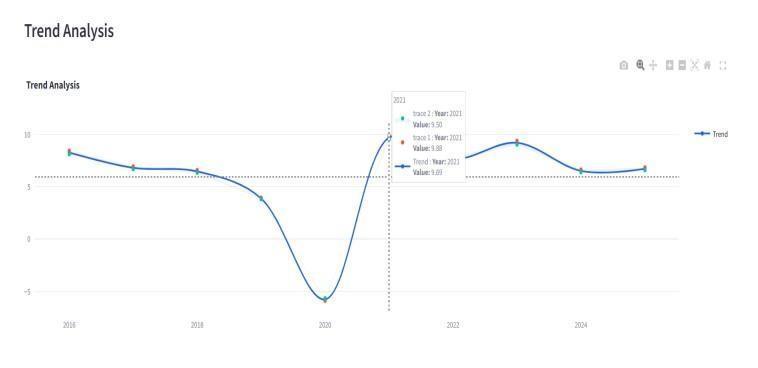
GDP growth, employment, and general economic stability wereallsignificantlyimpactedbytheCOVID19pandemicin India [3][4]. Economic recovery was greatly aided by government actions both during and after the outbreak. Accordingtothedata,theeconomysawconsiderableswings duringtheCOVID-19pandemicbeforegraduallyimproving insubsequentyears.
The general analysis and findings from the dataset are showninthissection.Thisanalysis'sgoalistousestatistical interpretation and data visualization to find patterns, connections,andpolicyimplications.
Several analytical perspectives, including trend analysis, comparison graphs, correlation matrices, and predictive forecasting,areusedtodisplaythefindings.Thesefindings aidincomprehendingthelong-termeffectsofgovernmental initiativesontheIndianeconomy.
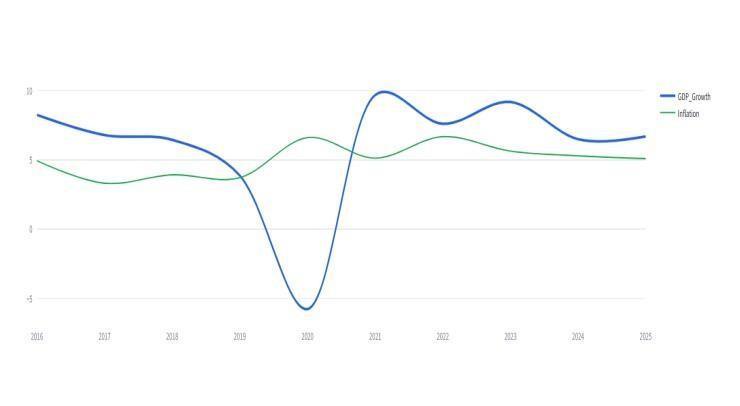
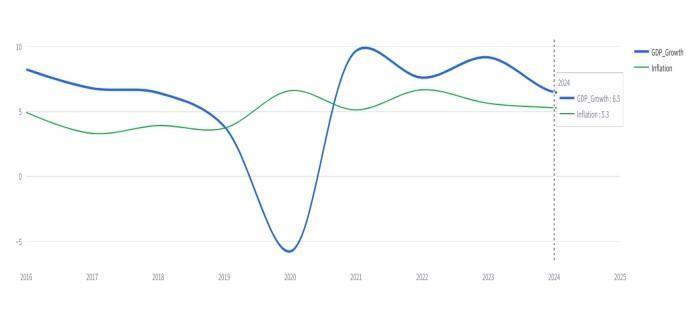
Athoroughgraspofhoweconomicindicatorshaveevolved throughouttimeisprovidedbythetrendandcomparative analysis. Significant fluctuations in GDP growth, inflation,
unemployment, tax income, and digital transactions are displayedinthevisualizations.
Findingtrendsacrossseveralindicatorsismadeeasierby theannualcomparisonandmulti-variableanalysis.Digital transactions, in particular, exhibit a robust upward trend, but GDP growth and unemployment show long-term volatilitythataresensitivetopolicy.
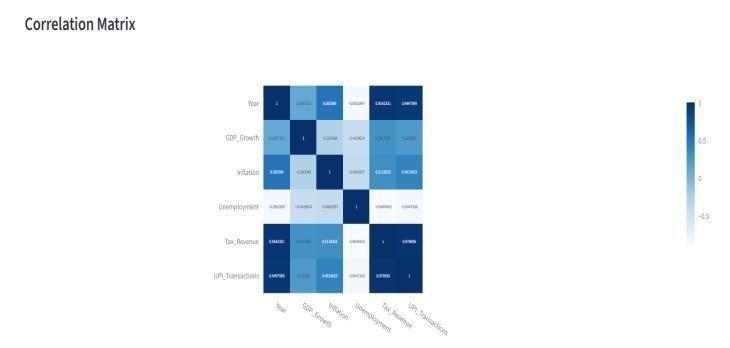
Thelinksbetweeneconomicindicatorsareexaminedusing correlationanalysis.Itaidsincomprehendingthepotential influence of one variable on another. Certain factors have positive links, while others have weaker or negative associations, according to the correlation matrix. For instance,theeffectsofunemploymentandinflationonGDP growth may vary over time. This study facilitates a more thoroughunderstandingoftheeffectsofpolicyandishelpful indiscoveringsignificanteconomiclinks.
Theuse of machinelearningtechniques toforecastfuture economic patterns is the main topic of this section. Predictiveanalysis'sprimarygoalistoprojectfutureGDP growthusingparticulareconomicvariables.
Because it facilitates data-driven planning and decisionmaking and aids in predicting potential future economicconditions,predictiveanalysisiscrucial.
International Research Journal of Engineering and Technology (IRJET) e-ISSN: 2395-0056
Volume: 13 Issue: 04 | Apr2026 www.irjet.net p-ISSN: 2395-0072
ThisstudyusesmachinelearningmodelsincludingRandom Forest,DecisionTree,andLinearRegressiontodopredictive analysis[7].Thesemodelswerechosenbecausetheycanaid incomprehendingtheconnectionbetweenvariouseconomic factors and GDP growth and are frequently employed for predictionjobs.
After being trained on historical data, each model's predictivepowerisassessed.
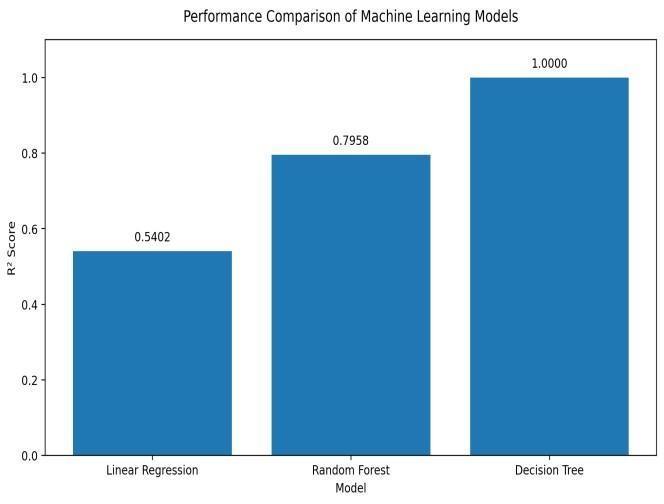
Standard assessment measures like R2 score and error values are used to assess the machine learning models' performance.Thefindingsdemonstratethatthemodelscan findsignificantlinksinthedataset.
Dependingonthedata'sstructure,certainapplicablemodels outperformothers.Thisassessmentaidsinchoosingthebest modelforforecastingfutureeconomicconditions.
Sr. No. Model Name R² Score
1 LinearRegression 0.5402
2 RandomForest 0.7958
3 DecisionTree 1.0000
Todeterminewhicheconomicfactorsaremostimportantin predicting GDP growth, feature significance analysis is employed.Understandingtherelativeeffectsoftaxincome, unemployment, inflation, and digital transactions on economic forecasting is made easier by the study. This enhancesthepredictionmodel'sinterpretabilityandsheds morelightonthemaineconomicforces.
Themainconclusionsof the analysisandpredictivestudy areoutlinedinthissection.Thefindingsdemonstratethat theIndianeconomyisimpactedbygovernmentpoliciesina quantifiable way. Revenue stability was enhanced by tax reforms, and the expansion of digital payments grew dramaticallyovertime.GDPgrowthwasclearlyimpactedby unemployment and inflation, and the machine learning models used were successful in forecasting future GDP patterns,suggestingasteadyeconomicoutlook.
Becauseitintegratesmachinelearning,dataanalytics,and visualization into a single framework, this research has practical applications.Itfacilitatesa moremethodical and goal-oriented approach to economic study and enhances scholarly comprehension. Students, academics, and politicians that want to use data-driven approaches to comprehendhowgovernmentpoliciesaffectthe economy wouldfindthestudyuseful.
Based on economic variables, the predictive research demonstratesthatmachinelearningmodelsarecapableof accuratelyprojectingfutureGDPgrowth.Prediction
reliability is increased and the importance of important economic aspects is highlighted when numerous input variables are used. The findings imply that, assuming presenttrendshold,theIndianeconomymightcontinueto growsteadily.
ThestudycomestotheconclusionthattheIndianeconomy is significantly impacted by government policy. The study findssignificanttrends,patterns,andconnectionsbetween vital economic variables like GDP growth, inflation, unemployment, tax revenue, and digital transactions by usingdataanalyticsapproaches.
Additionally,thestudyshowsthatfutureGDPgrowthmay beaccuratelypredictedusingmachinelearningmodels.The findingsshowthateconomicreforms,digitalexpansion,and policy changes all have a significant impact on the overall functioningoftheeconomy.
All things considered, this study offers a methodical and data-driven framework for comprehending the efficacy of policiesandpredictingfutureeconomictrends.Itmightbea helpful resource for additional scholarly and analytical researchinthisfield.
International Research Journal of Engineering and Technology (IRJET) e-ISSN: 2395-0056
Volume: 13 Issue: 04 | Apr2026 www.irjet.net p-ISSN: 2395-0072
The authors would like to sincerely thank Prof. [Guide Name], Department of Computer Applications, Pratibha College of Commerce and Computer Studies, Chinchwad, Pune, for his invaluable advice, ongoing assistance, and perceptive scholarly recommendations during the study project.
TheReserveBankofIndia(RBI),MinistryofStatisticsand Programme Implementation (MoSPI), World Bank, InternationalMonetaryFund(IMF),andNationalPayments Corporation of India (NPCI) are just a few of the publicly accessible economic data sources that the authors are gratefultohaveused. Thesesourcesgreatlyaidedtheanalysiscarriedoutinthis study.
[1]GovernmentofIndia,“EconomicSurvey,”Ministryof Finance, https://www.indiabudget.gov.in/economicsurvey/
[2]ReserveBankofIndia,“AnnualReportsand Publications,” https://www.rbi.org.in/scripts/annualreportpublicati ons.aspx
[3WorldBank,“WorldDevelopmentIndicators–India,” https://data.worldbank.org/country/india
[4]InternationalMonetaryFund(IMF),“World Economic Outlook Databases,” https://www.imf.org/en/publications/sprolls/worldecono mic-outlook-databases
[5]NationalPaymentsCorporationofIndia(NPCI), “UPI Product Statistics,” https://www.npci.org.in/product/upi/productstatistics
[6]Ministry of Statistics andProgramme Implementation(MoSPI),“OfficialStatisticsPortal,” https://www.mospi.gov.in/
[7]MoSPI, “eSankhyiki Data Portal,” https://esankhyiki.mospi.gov.in/
[8] World Bank, “GDP Growth (annual %) – India,” https://data.worldbank.org/indicator/NY.GDP.MKTP.K D.ZG?locations=IN
[9]IMFData,“WorldEconomicOutlook(WEO) Database,” https://data.imf.org/en/datasets/IMF.RES:WEO
[10]NPCI, “Retail Payment Statistics,” https://www.npci.org.in/retail-payment-statistics
[11] Deba Prasad Rath and Raj Rajesh, “Analytics and ImplicationsofServicesSectorGrowthinIndianEconomy,” MPRA Paper No. 10034, 2006. https://mpra.ub.uni-muenchen.de/10034/
[12]RinkeshkumarG. Mahida,The Impactof Government Policies and Foreign Direct Investment on the Growth DynamicsoftheIndianConsumerDurablesMarket.