
International Research Journal of Engineering and Technology (IRJET) e-ISSN: 2395-0056
Volume: 12 Issue: 01 | Jan 2025 www.irjet.net p-ISSN: 2395-0072

International Research Journal of Engineering and Technology (IRJET) e-ISSN: 2395-0056
Volume: 12 Issue: 01 | Jan 2025 www.irjet.net p-ISSN: 2395-0072
Neha Chandrakant Sawant1
PG Student, Department of Information Technology, DBJ Collage Chiplun
Abstract - Grafana is a widely used tool for visualizing and analyzing data from various sources. This paper provides an overview of how Grafana works and highlights its usefulness in monitoring and interpreting complex data sets. We explore how users can create dashboards that display real-time data from different data sources, such as databases, servers, and cloud services, in an intuitive manner using charts and graphs. This capability makes it easier for users to identify trends and potential issues. The paper further discusses the key data sources supported by Grafana, such as InfluxDB, Prometheus, Graphite, and ElasticSearch, and the process of connecting Grafana to these data sources. Additionally, we examine the customization features of Grafana, which allow users to tailor it to specific needs. Finally, the paper outlines the benefits of using Grafana for data analysis, as well as the challenges associated with its implementation.
Key Words: Grafana,Data Visualization, Real-timeData, Dashboards,DataSources,CloudServices,DataAnalysis
1.Introduction:
In today's world, large-scale and distributed systems generate enormous amounts of data, making it crucial to haveeffectivetoolsformonitoringandanalysis.Grafanahas emergedasoneofthemostpopularopen-sourceplatforms forvisualizingandmonitoringdatainreal-time.Itenables userstocreatecustomizabledashboardsandtracksystem performance through various data sources such as databases,servers,andIoTdevices.
Grafana'seaseofuse,combinedwithitspowerfulalerting feature,whichnotifiesusersofspecificconditions,makesita valuabletoolformonitoringdiversesystems.However,as systemsscale,thechallengeofaggregatingandvisualizing datafrommultiplesourcesbecomesmorecomplex.Existing toolsoftenstruggletomanagethedataloadandoffertimely insights.
This paper aims to investigate the scalability and performance of Grafana in large-scale and distributed systems.Byevaluatingitsabilitytohandlevastamountsof dataacrossdifferentsources,weprovideanunderstanding ofitsstrengthsandlimitationsinreal-worldapplications.
2. Overview of Grafana
Grafana is an open-source platform designed for the monitoring,visualization,andanalysisoftime-seriesdata.It iswidelyadoptedforcreatingdashboardsandvisualizations
that provide valuable insights into system performance, operationalmetrics,andotherdata-drivenindicators.This platform enables users to efficiently track and interpret complex data, making it easier to make data-driven decisions.
Grafana'sopen-sourcenaturemakesithighlyadaptableand customizabletosuitvarioususecases.Itsabilitytointegrate withabroadrangeofdatasources,coupledwithitsalerting andvisualizationcapabilities,enhancesitsutilityinavariety of fields, including IT infrastructure monitoring, system performanceanalysis,andbusinessintelligence.
Grafanaisaweb-basedtoolthatiscompatiblewithavariety of technologies, software, and environments. Below are someofthekeytechnologiesandenvironmentswithwhich Grafanacanbeused:
Operating Systems: Grafanacanbeinstalledacrossmultiple operatingsystems,includingWindows,Linux,andmacOS. Additionally,itisavailableasaDockercontainer,allowing foreasydeploymentincontainerizedenvironments.
Databases: Grafanaiscapableofconnectingtovariousdata sources,particularlytime-seriesdatabasessuchasInfluxDB, Prometheus, Graphite, Elasticsearch, and MySQL. These integrations enable Grafana to collect, store, and visualize largedatasetseffectively.
Web Servers: Built using the Go programming language, Grafanautilizesthenet/httppackagetoservewebcontent. Whileitcanoperateonanywebserverthatsupportsreverse proxy,itismostcommonlydeployedwithApacheorNginx, both of which are widely used for handling reverse proxy traffic.
Monitoring and Logging Systems: Grafanacanseamlessly integrate with monitoring and logging systems such as Prometheus and Loki, allowing for the collection and visualizationofmetricsandlogsinreal-time.
Cloud Environments: Grafana is also effective for monitoring and visualizing data from cloud platforms. It supports major cloud providers such as Amazon Web Services(AWS),GoogleCloudPlatform(GCP),andMicrosoft Azure,facilitatingthemonitoringofcloudinfrastructureand services.
Programming Languages: GrafanaoffersanAPIthatallows integrationwithvariousprogramminglanguages,including Python,Go,andJava.Thisfeatureenablesuserstoautomate
International Research Journal of Engineering and Technology (IRJET) e-ISSN: 2395-0056
Volume: 12 Issue: 01 | Jan 2025 www.irjet.net p-ISSN: 2395-0072
datacollection,triggeralerts,andcustomizevisualizations programmatically.
Data Visualization: Grafana offers a powerful interface for creatinginteractiveandcustomizablevisualizationsofdata sourcedfromvariousplatforms.Itaidsusersininterpreting andanalyzingdatathroughgraphs,charts,andothervisual components.
Monitoring: Grafana is widely used to monitor the performanceofsystems,applications,andinfrastructurein real time. By visualizing key metrics and logs, it enables userstoidentifyandaddresspotentialissuesswiftly.
Alerting:Grafanaallowsuserstoconfigurealertsbasedon specific conditions or thresholds. This functionality helps teamstakeproactivemeasurestoresolveissuesbeforethey cannegativelyaffectoperations.
Integration: Grafana acts as a central hub for integrating multiple data sources, offering a consolidated view of variousmetricsandlogs.Thisintegrationstreamlinesdata managementandenhancesoperationalefficiency.
Customizable Dashboards: Grafana empowers users to designandpersonalizedashboardsaccordingtotheirunique needs,offeringflexibleandin-depthinsightsintothedata beingmonitored.
4. Grafana’s architecture, the backend, and the frontend
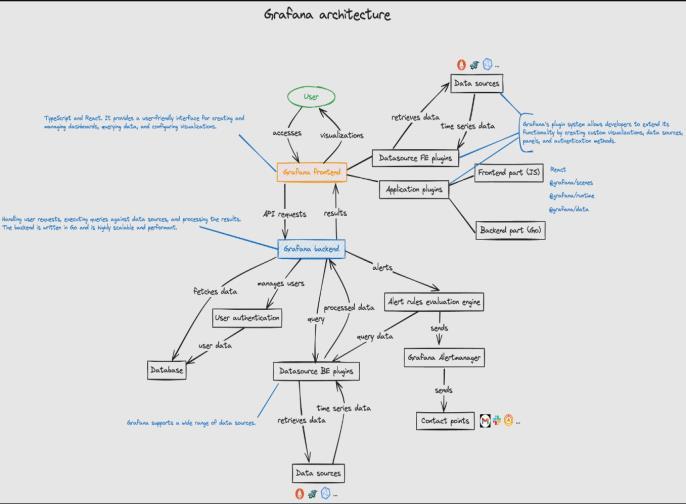
4.1 Grafana Architecture
ThissectionprovidesasimplifiedoverviewofhowGrafana connectstoitsdatasourcesandcreatesvisualizations.Data producers can range from various sources such as web applications,JenkinsCIservers,Kubernetespods,andmore.
Grafanaisarobusttoolforvisualizingandmonitoringdata, built upon a clear and effective architecture consisting of three primary components: the data source, the backend, andthefrontend.
Below is a breakdown of each component: DataSourceGrafana'sversatilityislargelyduetoitsability to connect to multiple data sources. By installing and configuringdatasourceplugins,userscanintegrateGrafana with their data sources, create dashboards, and visualize data from various systems within a unified interface. This flexibilitymakesGrafanaaninvaluabletoolformonitoring andobservabilityinawiderangeofenvironments.
Evenwhenworkingwithahighlycustomizeddatasource, users can develop a plugin that accepts queries, communicates with the data source, transforms the retrieveddataintoacompatibleformat,andpresentsitfor visualizationwithinGrafana.
4.1.1
DevelopaDataSourcePlugin:Userscanwriteadatasource plugin using Grafana's plugin framework. This involves implementing methods to query the custom data source, processthereturneddata,andformatitforvisualization.
DefineQueryCapabilities:Theplugin’squerycapabilitiesare defined,allowinguserstospecifyparametersforquerying data from the source. These parameters may include selectingmetrics,specifyingtimeranges,filteringdata,and otherrelevantoptions.
Transform Data: Upon receiving a query, the plugin communicates with the custom data source, retrieves the requesteddata,andtransformsitintoaformatcompatible with Grafana. This may involve parsing, aggregating, or manipulatingthedatatoprepareitforvisualization.
Return Data to Grafana: After transforming the data, the pluginreturnsittoGrafanainanexpectedformat,suchas time-series data, table data, or another suitable structure, dependingonthetypeofvisualizationbeingcreated.
Visualize Data: Grafana then uses the returned data to generate visualizations such as graphs, charts, or tables, whicharedisplayedontheuser’sdashboard.
Data source plugins in Grafana can also operate on the backend.Thesebackend-basedpluginshandledataretrieval andprocessingontheserversideratherthandirectlywithin thefrontend.
4.2
The backend of Grafana plays a pivotal role in managing various aspects of the application, such as data sources, plugins,dashboards,users,andaccess.Itprovidesasetof
2395-0056
Volume: 12 Issue: 01 | Jan 2025 www.irjet.net p-ISSN: 2395-0072
3.Alert rules are evaluated based on data fetched directly from the data source, without passing through Grafana's alertingengine.
4.2.1
In Grafana, backend user management refers to the functionality provided by the server to oversee user accounts, roles, permissions, and authentication methods. ThisallowsadministratorstocontrolaccesstoGrafanaand its resources, ensuring that users' permissions are appropriatelymanaged.
4.2.2
The alerting engine in Grafana is a powerful feature that enablesuserstocreateandmanagealertsbasedonthedata displayedintheirdashboards.Userscandefineconditions andthresholdsforspecificmetricsordatapoints,triggering notificationswhenthoseconditionsaremet.
Unlikeothersystems,GrafanadoesnotusePrometheusas itsalertgenerator,asGrafanaAlertingmustsupportarange ofdatasourcesbeyondjustPrometheus.Instead,itutilizes AlertManagerasthealertreceiver.
Grafana Alert Rules
Grafana supports two types of alert rules: managed alert rules and data source-managed alert rules. Below is a comparisonofthetwo:
Grafana
These rules are managed directly within Grafana, independentofanyspecificdatasource.
UsersdefinealertconditionsandthresholdswithinGrafana usingitsnativealertingengine.
Alertrulesareevaluatedbasedondatafetchedfromoneor moredatasourcesthatareconfiguredwithinGrafana.
Users can create, manage, and visualize these alert rules throughGrafana’suserinterface.
Grafana handles the entire alerting lifecycle, including evaluation,statemanagement,andtriggeringnotifications.
Data Source Managed Alert Rules:
1.Theserulesaremanagedandevaluatedbythedatasource itself.
2.Conditionsandthresholdsforalertsaredefinedwithinthe datasource,typicallyusingfeaturesprovidedbythatdata source.
4.Users configure and manage these alert rules using the toolsorinterfacesprovidedbythedatasourceratherthan throughGrafana.
5.The data source is responsible for the entire alerting lifecycle, including evaluation, state management, and notificationtriggering.
Insummary,Grafana managedalertrulesaredefined and managed within Grafana using its native alerting engine, while data source-managed alert rules are defined and managedwithinthedatasourceitself.Thechoicebetween thetwodependsonthecapabilitiesofthedatasource,the level of integration desired with Grafana, and the specific requirementsofthealertingusecase.
The frontend is the user interface of Grafana, which users interactwithdirectlythroughtheirwebbrowsers.
Dashboards: The frontend allows users to create and customizedashboards.Thesedashboardsarecomposedof panels, which can present data in various forms, such as graphs,tables,orheatmaps.
Visualizations: Userscanconfigurepanelstovisualizedata indifferentways,selectingfromarangeofcharttypesand graphs.
User Interaction: The frontend enables users to engage withtheirdashboardsbyfilteringdata,settingupalerts,and drillingdownintospecificmetricsfordeeperinsights.
Thefrontendisthekeyinterfacewhereuserscanviewand interact with their data. It is designed to be intuitive and user-friendly,allowingcomplexdatatobeunderstoodand analyzedvisually.
Connecting to Data Sources: Thefrontendallowsusersto configureandconnecttodifferentdatasourcesanddefine howqueriesshouldbeexecuted.
Query Execution: Whenauserrequestsdata,thefrontend sends the request to the backend, which then queries the connecteddatasources.
International Research Journal of Engineering and Technology (IRJET) e-ISSN: 2395-0056
Volume: 12 Issue: 01 | Jan 2025 www.irjet.net p-ISSN: 2395-0072
Data Processing and Visualization: Thebackendprocesses thedata and returns ittothefrontend. The frontendthen visualizesthisdatawithinthedashboards.
Grafana’s architecture consists of three core components thatworktogetherseamlessly:
Data Source: The location where data is stored and retrievedfrom.
Backend: The server-side component that manages data processingandquerying.
Frontend: Theuserinterfacewheredashboardsarecreated anddataisvisualized.
This architecture allows Grafana to be an effective and versatiletoolfordatavisualizationandmonitoring.
Grafana’sfrontendisdevelopedusingTypeScriptandReact. Itprovidesanintuitiveinterfaceforcreatingandmanaging dashboards,queryingdata,andconfiguringvisualizations. ThefrontendcommunicateswiththebackendviaRESTful APIstofetchdataandexecutevariousoperations.
5. Alerts
Alertsareacriticalaspectofdeployingaserviceinto production,regardlessofwhetherthesoftwareisablog,an e-commercewebsite,orapowerstation.Itisessentialtobe promptly informed about any issues with the software. Constantlymonitoringdashboardswithnumerousmetricsis impractical,andalertsprovideanefficientwayforsystems to notify us about unusual events occurring within the software.
5.1 What Are Grafana Alerts?
Grafana alerts are a mechanism for sending notifications whenametricexceedsapredefinedthreshold.Forinstance, you might want to send a Slack message to your team's channeliftheCPUutilizationofyourcloudserversurpasses 80%.
Grafana alertsconsistoffourkeycomponents:alertrules, contactpoints,notificationpolicies,andsilences.
Alert Rules: Alert rules define when an alert is triggered. For example, if you want to trigger an alert when the memory utilization of your Java service exceeds 90%, but only after excluding the time period before the garbage collectioncycle,youcanconfigureanalertrulethattriggers whenmemoryutilizationexceeds90%foradurationlonger thantheexpectedgarbagecollectiontime.
Contact Points: Contactpointsspecifywherethemessageis sent when an alert rule is triggered. Depending on the severity of the alert, different channels may be used. For routinealerts,aSlackmessagemightsuffice,butformore
critical issues, you might want to page a team member to addresstheproblemimmediately.Grafanasupportsawide range of contact points, including Slack, email, and webhooks.
Notification policies: Notificationpoliciesallowyoutoset rules regarding where and how often alert notifications shouldbesent.Acommonpatternistolimitthefrequencyof notificationsduringaspecificperiod.Forexample,ifanalert is triggered due to CPU utilization exceeding 90%, notificationsmightberestrictedtopreventspamming.
Silences: Silences are used to configure periods during which notifications will be suppressed. While Grafana continuestotrackmetricsandtriggeralerts,itwillnotsend notificationsduringthesesilencedperiods.Silencescanbe configuredtosuppressnotificationsforspecificalertrules, identified by particular labels. Once the silence period expires,notificationswillresumeasusual.
AlertinginGrafanahelpsmonitoryourdataandnotifyyou whenspecificconditionsaremet.Here'sasimpleoverview ofhowitworks:
CreatePanels:Beginbycreatingadashboardwithvarious panels (e.g., graphs or tables) to display your data. Each panelcanshowmetricsfromyourdatasources.
ChooseaPanel:Selectapanelwhereyouwanttosetupan alert.Forinstance,youmightwantanalertifaserver'sCPU usageexceedsacertainthreshold.
SetAlertConditions:Definetheconditionsforwhenthealert should trigger, such as if CPU usage exceeds 80% for 5 minutes.
AlertFrequency:DecidehowoftenGrafanashouldcheckif thealertconditionsaremet(e.g.,everyminute).
AlertMessage:Customizethemessagethatwillbesentwhen thealerttriggers.Themessageusuallyincludesdetailsabout thealertandanyrelevantdata.
Set Up Notifications: Choose where to send the alert notifications.Grafanasupportsseveralnotificationchannels, includingemail,Slack,MicrosoftTeams,andPagerDuty.
ConfigureChannels:Providethenecessarydetailsforeach notification channel, such as email addresses or Slack webhooks.
International Research Journal of Engineering and Technology (IRJET) e-ISSN: 2395-0056
Volume: 12 Issue: 01 | Jan 2025 www.irjet.net p-ISSN: 2395-0072
Test and Save
TestAlerts:Testyouralertsettingstoensureeverythingis functioning correctly. This ensures you will receive notificationsasexpectedwhenthealertconditionismet.
Save Alerts: Once you've tested and confirmed everything works,saveyouralertconfigurations.
Receive Alerts
TriggeringAlerts:Grafanamonitorsthedataand,whenthe alertconditionsaremet(e.g.,CPUusageexceeds80%forthe definedperiod),ittriggersthealert.
Notification: Grafana sends the alert notification to the configuredchannels(e.g.,viaemailorSlackmessage),soyou cantakeappropriateaction.
Grafana’salertingsystemhelpskeepyouinformed aboutimportantmetricsbynotifyingyouwhensomething goes wrong or requires attention. Grafana alerts offer a straightforwardsolutionforsettingupalertsdirectlywithin yourexistingGrafanadashboards.Thisapproacheliminates theneedtouseseparatetoolsformonitoringandalerting, enablingyoutomanagebothfunctionswithinoneplatform.
Grafana is a powerful tool for visualizing data, but its performancecanbeinfluencedbyvariousfactors.Belowisa breakdownofwhatcanimpactGrafana’sperformanceand howtooptimizeit:
Ifthedatasources(suchasdatabasesorAPIs)areslowto respond, it will delay the retrieval and display of data in Grafana.
High traffic or large datasets can place a strain on data sources,whichinturnslowsdownGrafana’sperformance.
Resolution for Data Source Performance Issues:
Simplifyandrefinequeriestoreduceprocessingtime.
Enablecachingonthedatasource,ifavailable,tospeedup repeatedqueries.
Scaleuptheserverresources(CPU,memory)dedicatedto thedatasource.
Aggregatedataorusesmallertimerangestoreducetheload onthedatasource.
Minimizethenumberofpanelsandqueriesperdashboardto lessentheperformanceimpact
Dashboardswithtoomanypanelsorcomplexvisualizations cancauseslowerrenderingtimes.
Largedatasetsorveryhigh-frequencydata cannegatively affecttheloadingandresponsivenessofdashboards.
Resolution for Dashboard Complexity:
Reduce the number of panels and avoid overcrowding. Grouprelatedvisualizationstogetherusingrowpanels.
Implementdynamicdashboardvariablesforfiltering,which reducestheneedformultiplesimilarpanels.
TheallocationofCPU,memory,anddiskspacetotheGrafana servercandirectlyimpactperformance.
Running Grafana on a server with limited resources may resultinperformancebottlenecks.
Resolution for Grafana Server Configuration Issues:
ReviewGrafana logsforerrormessagesthatmayindicate configurationissues.
Ensurethatthegrafana.ini fileiscorrectlyconfigured and restartGrafanatoapplythechanges.
Slow network connections between Grafana and data sourcescanslowdownthedataretrievalprocess.
GeographicdistancebetweenGrafanaanditsdatasources canintroducelatency.
Resolution for Network Latency Issues:
Ensurethatthereisastable,high-speedconnectionbetween Grafanaandthedatasources.
Ifpossible,deploydatasourcesclosertotheGrafanaserver toreducelatency.
Usecachingmechanismstodecreasethefrequencyofdata requests.
Inefficientuseofcachingcanleadtorepeatedqueries,which mayslowdownperformance.
Thetypeandspeedofstorageusedforlogsandmetricscan impactperformance.
International Research Journal of Engineering and Technology (IRJET) e-ISSN: 2395-0056
Volume: 12 Issue: 01 | Jan 2025 www.irjet.net p-ISSN: 2395-0072
Resolution for Caching and Storage Issues:
Ifsupported,enablecachingonyourdatasourcestoreduce queryloadtimes.
Ensure that the data source has efficient indexing and storageconfigurationstoallowforquickdataretrieval.
Fine-tunecacheexpirationtimesandsizelimitstooptimize performancewithoutoverusingresources.
7. Conclusion:
Grafanaisanopen-sourcedatavisualizationandmonitoring platformthatallowsuserstocollect,process,andvisualize datafromvarioussources.Itoffersauser-friendlyinterface, multiple visualization options, and an alerting feature. However, its scalability, advanced analytics, and incident management capabilities are limited compared to commercial tools, and its use of the Go language can pose challengesforsomedevelopers.
8. Result and Implementation:
Result:
The study found that the IT infrastructure monitoring dashboard application using Prometheus and Grafana at Astra Polytechnic performed as expected. Despite some minor shortcomings, the software met the desired goals. Although there is room for further improvement, such as enhancingtheuserinterfaceandaddingmorefeatures,the application has proven effective in monitoring IT infrastructure.
During the research, challenges included integration with existingsystemsandtheneedforregularmaintenanceand updates.Nevertheless,theapplicationsignificantlybenefits AstraPolytechnicbyenablingtheITinfrastructureteamand PSI coordinators to monitor performance efficiently and addressissuespromptly.Itishopedthattheresearchresults will support future improvements in the IT infrastructure monitoringsystem.
Grafana-managed alert rules are defined and managed withinGrafana’snativealertingengine,whiledatasourcemanagedrulesarehandledwithinthedatasourceitself.The choicedependsonfactorslikethedatasource'scapabilities, integration needs with Grafana, and specific alerting requirements.
Implementation:
UI Enhancements: Furtherrefinementoftheuser interface, along with the addition of features tailored to specific use cases, could significantly enhanceoverallusability.
Scalability: As systems expand, addressing performancechallengesthroughoptimizedqueries andstrengthenedinfrastructurewillbecrucialfor maintainingGrafana’sefficiencyandeffectiveness.
TheimplementationandresultsindicatethatwhileGrafana holdsconsiderablepotential,itsfullcapabilitiescanonlybe realized through continuous maintenance, performance optimization, and improved integration with diverse data sources,especiallyinlarge-scalesystems.
1. Grafana Labs.(2024). Grafana Documentation.Grafana Labs.Retrievedfromhttps://grafana.com/docs/
2. Hecht, L. (2019). Monitoring and Visualizing Metrics with Grafana and Prometheus.O'ReillyMedia.
3. Koller, P. (2020). Grafana for Beginners: Learn How to Set Up and Use Grafana for Your Projects.Self-published.

Ms.NehaChandrakantSawant
PG Student, Department of InformationTechnology,DBJCollege, Chiplun-415605,Maharashtra,India.