
International Research Journal of Engineering and Technology (IRJET) e-ISSN: 2395-0056
Volume: 13 Issue: 03 | Mar 2026 www.irjet.net p-ISSN: 2395-0072
International Research Journal of Engineering and Technology (IRJET) e-ISSN: 2395-0056
Volume: 13 Issue: 03 | Mar 2026 www.irjet.net p-ISSN: 2395-0072
1 Assistant Professor, Dept. of Mechanical Engg. GEC Banka, DSTTE Bihar
2 Assistant Professor, Dept. of Mechanical Engg. GEC Banka, DSTTE Bihar
3 Assistant Professor, Dept. of Mechanical Engg. GEC Banka, DSTTE Bihar
4Assistant Professor, Dept. of Mechanical Engg. GEC Banka, DSTTE Bihar *** -
Abstract - In this paper performance analysis of cooling tower were conducted. Performance of tower is of a great importance. For this study, experiments were conducted for fixed mass flow tare of water and then for fixed inlet temperature and from experimental data effectiveness and evaporation losses were calculated. As it was a small capacity of cooling tower that meant for only study purpose a high effectiveness of 64% were achieved for range of 33.8˚C and a small amount of water loss of 1% obtained for range 5.7˚C. Theoretical EL was also calculated from carrier’s equation and with the help of steam table and was compared with the practical EL. The comparison b/wthemshowsthedifferenceis marginal. It was observed that performance of tower depends on so many parameters, like range, approach, design & material of tower etc. Effectiveness and EL of towerisfunction of range & influences it most among all other parameters.
Key Words: Cooling Tower, Heat exchanger, Counter flow, effectiveness.
CoolingTowerisaspecialtypeofdirecttypeofcontact heatexchangerthatisbroadlyandefficientlyusedinvarious fields.CoolingTowerisanecessarypartofthermalpower plant , fertilizer plant ,chemical plant etc. Mostly used CoolingTowerisofcounterflowtype.Thereisneedtocool thehotwaterinthermalpowerplantandvariousplantsand theCoolingTower broughtrevolutioninthisfield. Itisan important evaporative, direct contact, counter flow heat exchanger. The main function of tower is to increase the efficiency of power plant by lowering the temperature of outletwater.Itdirectusetheatmosphericairtocoolthehot andwarmair Thefirstlawofthermodynamicisrelyonthe energy conservation principle. The concept of energy balance is based on Enthalpy. Which is described and referredas: H=U+PV;∆H=Q–W
Where;
H=Enthalpy; ∆H=Changeinheat; P=Pressure; Q=Heat; V=volume. W=Work.
As per conservation law of energy following can be concluded: ∑∆Hin=∑∆Hout
Hence,
Byobtainingdifferententhalpies,theanalysisofvarious,and allimportantaspectofcoolingtowercanbeconducted
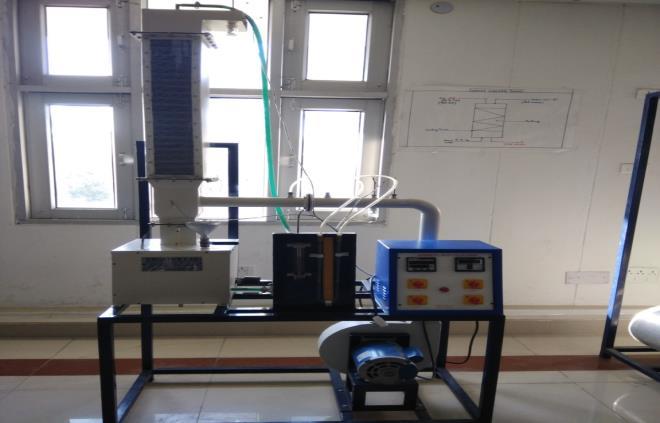
Thisexperimentalset-upisofsmallcapacityandmeant foronlystudyand research purpose.Various reading was taken carefully and according to the needs. The reading takenbychangingmassflowrate&keepingtheinletwater temperature constant and another reading was taken by changing inlet temperature & keeping mass flow rate constant. Various reading was taken by varying the parameter and important parameter like effectiveness, range,approach,evaporationloss(practicalandtheoretical) relatedtocoolingtowerperformancewascalculated.
Table -1: Dimensionsofset-upEquipment
Sr.No. Nameof components Specification
1. CoolingTower Crosssec.0.15mx0.15m Height:0.75m
2. Wiremeshpacking Aluminiumexpandedwire mesh
3. Blower Centrifugalblower,power3H.P.
4. Pipediameter(d2) 50mm
5. Diameteroforifice (d1) 25mm
6. Coefficientof discharge 0.60
1. Water supply, 2. Drain, 3. Electricity supply: 1 Phase,220VAC,and3kW.4.Floorareaof1.2mx 1m.
Volume: 13 Issue: 03 | Mar 2026 www.irjet.net p-ISSN: 2395-0072
1.Fill thetankwithwater,setthetemperaturewiththe helpofD.T.C.also,andswitchonthewarmer.
2. Switch on siphon and blower after wanted temp. is accomplished.
3. Setthestreamrateofwaterandair.
4. Record the stream rate of water and manometer perusingafterconsistentstateaccomplished.
5. Recorddifferenttemp.
6.Stages3to5mightberehashedforvariouswaterand windstreamratesinsideoperationalrange.
PRECAUTIONS & MAINTENANCE INSTRUCTIONS
1.Warmeroughtnottobeexchangedonbeforefillingthe waterinwarmingtank.
2.Siphonoughtnottobeexchangedonatlowvoltage.
3. Water in warming tank ought to be appropriately depletedaftertrialisfinished.
4.Cottoncoatoverthewetbulbgameplanoughttobein itsplaceappropriately.
5.Wetbulbjugoughttobeloadedupwithwaterbefore beginningtheanalysis.
4. EXPERIMENTATION: READING& CALCULATIONS
Keepinginletwaterflowratefixedas50LPHandvarying inletwatertemperature,differenttempisnotedasbelow
Table 2 Measuredvalues(Manometerreading:16mm)
Table 3 Measuredvalues(Keepinginlettemp.fixedas55 ˚CandvaryinginletwaterflowrateinLPH.Manometer reading:20mm)
Table 4 ResultsforEffectiveness
Research
Volume: 13 Issue: 03 | Mar 2026 www.irjet.net
Table 5 Range&Evaporationloss(%)
Table 6 ResultsofEvaporationlosses
Figure 1: Graphb/weffectiveness(%)&temperature range(˚C).
Effectivenessisstronglydependedonrangeofcoolingtower & it is directly proportional to temperature range. As resulting graph indicating the increasing slope of effectiveness(%)withrange(˚C),itmeanswhentheranges of tower is increased that results in increment in effectiveness of tower. At initial stage when range is increased effectiveness is also increased but slop of increment is greater than that of later stage. Different effectivenesscalculatedfromvariousrangesareplottedhere and that shows direct proportionality relationships b/w bothofthem.Hencerangeisastrongfunctionofefficiencyof coolingtower.
Table 7 Resultsoftheoreticalevaporationlosses
Figure 2: Graphb/wEvaporationloss(%)&Range(˚C)for fixedflowrate.
The graph b/w evaporation loss and range establish a relationwhichisshownintheabovefigure.Thefiguretells directly that the slope of graph is of increasing trends, establishing relation of direct proportionality. As range increasesevaporationlossisalsoincreasinginasametrend, theslopisalmostastraightline.Atvariousvalueofranges respectiveevaporationlossesarecalculatedinpercentages & graph is plotted which is shown above. The graph b/w rangesandevaporationlossessaysthatevaporationlossis highlydependedonrange&directlyproportionaltoit.Asit
International Research Journal of Engineering and Technology (IRJET) e-ISSN: 2395-0056
Volume: 13 Issue: 03 | Mar 2026 www.irjet.net p-ISSN: 2395-0072
is an undesirable parameter and should be as small as possible,shouldbelessthan5%foroptimumresult. Here thecalculatedpracticalevaporationlossis withinrangeof 1%to6%,whichisareasonableresult
Figure 3: Graphb/wEvaporationloss(kg/hr)&Inlet waterflowrate(LPH).
Evaporationlossesinkg/hrarecalculatedfromrespective inletwaterflowrateinLPH. Therelationshipb/wthemis related by drawing graph inlet water flow rate v/s evaporationlossesasabove.Thegraphsimplyindicates& showsthatevaporationlossinkg/hrisfunctionofflowrate ofwater.Theresult&graphshowsthatevaporationlossin kg/hrisdirectlyproportiontoinletmassflowofwater.As water flow rate increases that leads to increment in evaporation loss in kg/hr also. The nature of graph is of increasingslopeandastraightline.
Theoretical evaporation loss(kkg/hr) Outletwatertemp(˚C)
Figure 5: Graphb/wEvaporationloss(kg/hr)&Water outlettemp.(˚C).
Theoretical evaporation loss is calculated from Carrier’s equation With the help of this formula and steam table different evaporation loss at respective parameter is obtained, and a relation b/w evaporation loss and outlet water temp is drawn. Although the trend of graph is of positiveslopebutslopeismarginali.e.verylittle.
Theoretical Evaporation Loss(kg/hr) InletWaterFlow Rate(LPH))
Figure 6: Graphb/wTheoreticalevaporationloss(kg/hr) &Inletwaterflow(LPH).
Another relationship of theoretical evaporation loss is shownherewithinletflowofwater.Fromfigureitcanbe predicted that theoretical evaporation loss is also shows somerelationwithinletwaterflowrate.Thenatureofgraph ispositivebuttheslopeisonlymarginal.
Figure 4: Graphb/wEvaporationloss(%)&Inletwater flowrate(LPH).
Evaporation losses in percentage is calculated from the measured values & when relation is established between evaporationlosses(%)andwaterflowrate(LPH)natureof graph shown is of decreasing slope, It means when mass flowrateofwaterincreasesevaporationlossin%decreases. Althoughthegraphb/wevaporationlossinkg/hrv/sinlet waterflowrateinLPHprovidesthesignofpositiveslope, while when losses is calculated in term of % and graph is drawnthenitgivestheoppositenaturethanofkg/hr.
Theoretical Evaporation Loss(kg/hr)
Inletwaterflow(LPH)
Figure 7: Graphb/wEvaporationloss(kg/hr)&Inlet waterflow(LPH).
International Research Journal of Engineering and Technology (IRJET) e-ISSN: 2395-0056
Volume: 13 Issue: 03 | Mar 2026 www.irjet.net p-ISSN: 2395-0072
Above results shows comparison between theoretical evaporationloss&practicalevaporationloss(kg/hr)with respect to inlet water flow rate(LHP). Of course there is differenceb/wtheoreticalandpracticallossesthisbecause in the calculation of theoretical losses some natural phenomenon is not considered, like surrounding ambient tempandrelativehumidity.Thegraphpredictsthatslopeof practicallossismorethanthatoftheoreticallosses.Practical lossesvariationwithwaterflowrateisofincreasingorder& has a positive slope, while theoretical losses seems to be almostaconstlinehavingmarginalvariationwithinletflow rateofwater.
1. At present the efficiency of practical working cooling towerisabout70%-75%butinfutureahigheffectivenessof about80%-85%maybeachieved.
2.Waterlossintheformofvapourintowermayalsofurther reducedtooptimalminimumlevelthatmaybenegligiblein comparetosuppliedwater.AtpresentpracticalELis1-5% butinfutureitmightbeexpectedtobeassmallas0.01%.
[1] BBhavaniSai,ISwathi,KSLPrasanna,KSrinivasaRao, Design Of Cooling Tower, International Journal of Scientific&EngineeringResearch,Volume4,
[2] M.S.Soylemez,Ontheoptimumperformanceofforced draftcounterflowcooling towers,EnergyConversation andManagement.45:2335-2341,2004.
[3] R. Ramkumar A. Ragupathy, Thermal Performance of Forced Draft Counter Flow Wet Cooling Tower with ExpandedWireMeshPackingInternationalJournalon “Technical and Physical Problems of Engineering” (IJTPE),Issuse.6,Vol.3,No.1,Mar.2011
[4] Fixed fluidized bed dry cooling tower‟-United states Patent.-Ram Gopalseth.1112 Yardley Rd., Cherry Hill.N.J.08034
Figure 8: Graphb/wEvaporationloss(kg/hr)&Outlet temperature(˚C).
The variation of evaporation losses both theoretical & practical(kg/hr)withoutlettempofwaterisshownabove. Graph is similar to earlier graph, variation of evaporation losseswithinletwaterflowrate.Bothgraphsshowthesame pattern.Henceitcanbesaidthatthevariationoftheoretical &practicalevaporationlosseswithrespecttomassflowrate andoutlettemparesimilarinnature.
1. Effectiveness of tower is a strong function of range & proportionaltoit.
2.Evaporationlosses(%)inbothcasesisfunctionofrange withincreasingslopenature.
3.Evaporationlosses(kg/hr)v/sinletwaterflowrateshows incremental graph, while losses (%) v/s inlet flow rate of watershowsdecrementalgraph.
4.Variationoftheoretical evaporationloss withinletflow rate&outlettempareofsamenaturewithmarginalslope.
5.Thevariationoftheoretical&practicalevaporationlosses with outlet temp & inlet flow rate is of same nature, the graphplottedisalmostsameinbothcases.
[5] XinmingXi,LeiYang,YananHe,LijunYang,XiaozeDu, Optimal design of large scale dry cooling tower with consideration of off-design operation The 6th InternationalConferenceonAppliedEnergy–ICAE2014
[6] J.R. Khan, B.A. Qureshi, S. Zubair, A comprehensive design and performance evaluation study of counter flow wet cooling towers, International Journal of refrigeration27:914-923,2004.
[7] Xiaoni Qi, Yongqi Liu ,Zhenyan Liu,Exergy Based Performance Analysis of a Shower Cooling TowerStrojniškivestnik - Journal of Mechanical Engineering59(2013)4,251-259
[8] J. Smrekar, I. Kustrin, J. Oman, Methodology for evaluation of cooling tower performance – Part 1: Descriptionofthemethodology,EnergyConversionand Management52(2011)3257-3264,July2011.
[9] K.N.Seetharamu, S.Swaroop,The effectofsizeonthe performanceofafluidizedbedcoolingtower,Heatand MassTransfer.26(1):17-21,1991.
[10] R.Haszler,Influenceofcondensationintheboundary layer on the heat and mass transfer in a falling film, progressreport(German),38:134-141,1994.
International Research Journal of Engineering and Technology (IRJET) e-ISSN: 2395-0056
Volume: 13 Issue: 03 | Mar 2026 www.irjet.net p-ISSN: 2395-0072
[11] Georgia F. Cortinovis, Jose L. Paiva – A systematic approachforoptimalcoolingtoweroperation.Energy conservationandmanagement50(2009)2200-2209.
[12] Mr. M.V.H.Satish Kumar “Performance Analysis of Cooling Tower” International Journal of Engineering TrendsandTechnology(IJETT)–Volume38Number9August2016
[13] L. Lu, W. Cai, A Universal Engineering Model For CoolingTowers,(2002).InternationalRefrigerationand AirConditioningConference.Paper625.




Mr. Pranay kumar
Designation: Assistant Professor inMechanicalengineering ResearchArea:ThermalEngg. Email:pranayme53@gmail.com
Mr. Pankaj kumar
Designation:AssistantProfessorin Mechanicalengineering ResearchArea:Engg.Material Email:pnkj143kumar@gmail.com
Mr. Gaurav kumar
Designation:AssistantProfessorin Mechanicalengineering Research Area: Fluid and thermal engineering Email:garv.1990@gmail.com
Mr. Brajesh kumar
Designation:AssistantProfessorin Mechanicalengineering ResearchArea:Materialscienceand engineering Email:brajeshksme57@gmail.com