
International Research Journal of Engineering and Technology (IRJET) e-ISSN: 2395-0056
Volume: 13 Issue: 03 | Mar 2026 www.irjet.net p-ISSN: 2395-0072

International Research Journal of Engineering and Technology (IRJET) e-ISSN: 2395-0056
Volume: 13 Issue: 03 | Mar 2026 www.irjet.net p-ISSN: 2395-0072
Niraj Rathod, Gauri Pawar, Sakshi Gund, Nisarg Manohar, Asst. Prof. Ashwini Thakare
Bachelor's Degree in Computer Engineering at Bharat College of Engineering
ABSTRACT: In the era of Industry 4.0, data-driven decision- making is critical for business sustainability. However, Small and Medium Enterprises (SMEs) often face significant bar- riers to entry regarding Business Intelligence (BI) adoption due to the high costs and steep learning curves associated with proprietary tools like Tableau or Power BI. This paper presents Etlytix BI, a comprehensive, lightweight, and open- source BI framework. Built using Python, Flask, and the Pandas library, the system provides an end-to-end solution for Extract, Transform, and Load(ETL) processesand dynamic data visualization. The proposed architecture supports hybrid deployment as both a web application and a standalone desktop application using Pywebview. Key features include multi- source data connectivity (CSV, Excel, MySQL, PostgreSQL), an interactive drag-and-drop chart builder, and automated data cleaning pipelines. This studydemonstratesthathigh- performanceanalyticscanbe democratized through efficient open-source architecture without compromising on essential features like security or interactivity.
Key Words: Business Intelligence (BI), ETL Pipeline, Data Visualization, Flask, Pandas, SME Analytics, Hybrid Application, Data Cleaning.
The Etlytix BI project is designed for Small and Medium Enterprises (SMEs) and data analytics beginners, providing a cost-effective and simplified method to transform raw data into actionable insights. Traditional Business Intelligence (BI) adoption is often hindered by high licensing costs, steep learning curves, and the complex resource requirements of proprietary tools like Power BI or Tableau. Etlytix BI overcomes these barriers by offering an open-source, lightweight framework that abstracts the complexities of SQL queries and manual spreadsheet manipulation behind an intuitive visual interface.
Moreover, the system supports a versatile range of data inputs,includingflatfilessuchasCSVandExcel,aswellas direct connectivity to external databases like MySQL and PostgreSQL. It features a robust Extract, Transform, and Load(ETL) enginepowered bythePython Pandaslibrary, enabling automated data cleaning and preparation. With an integrated drag-and-drop chart builder, the platform emerges asa powerful tool for dynamic data visualization anddemocratizedanalytics.
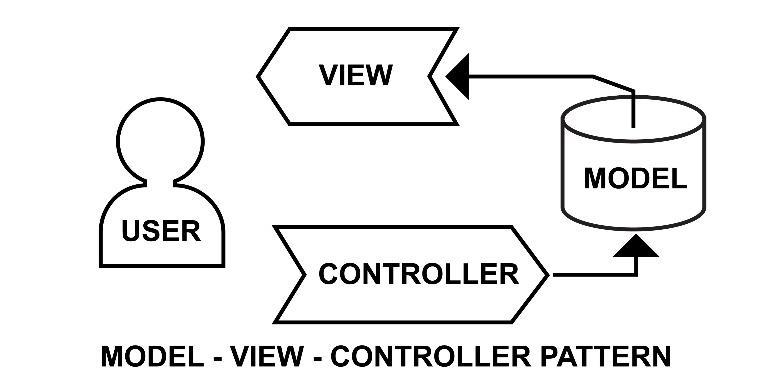
The Etlytix BI project is intended to be an intelligent and accessible environment that encourages data-driven decision-making and self-service analytics. The project leverages contemporary technologies, specifically the Flask web framework and Plotly visualization library, to provide a structured and efficient workspace for users to managetheirdatalifecycles.
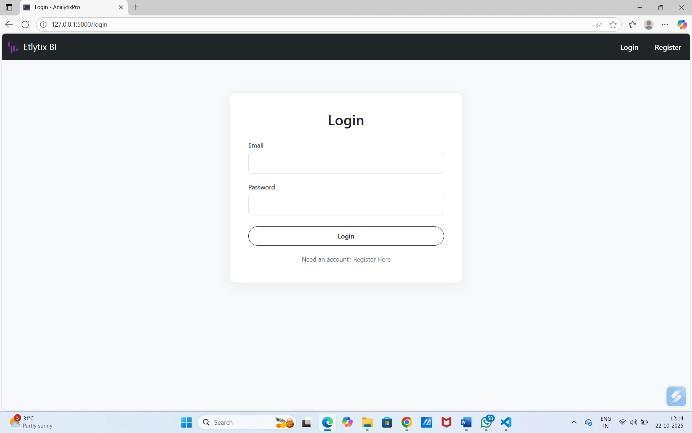
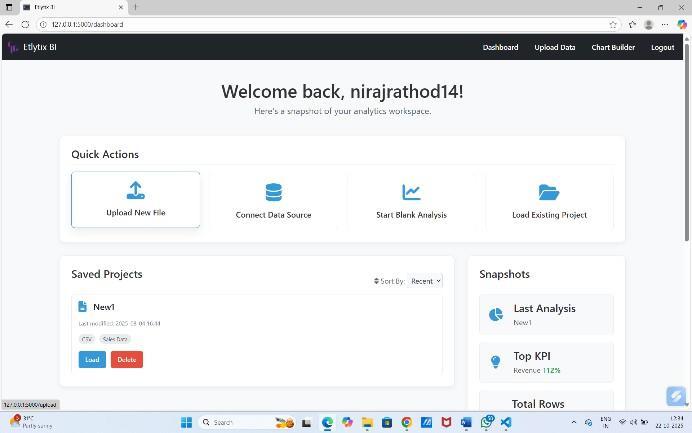
This platform includes a variety of specialized modules, including secure user authentication, multi-source data connectors, a data preparation area for handling missing values, and a primary chart builder canvas. By utilizing a hybrid architecture, the project offers a seamless experience as both a web-based application and a standalone desktop executable using the Pywebview library. Utilizing a Model-View-Controller (MVC) pattern for effective communication between the frontend UI and the Python backend, the project places a strong emphasis onmodularprocessingandperformanceoptimization.The portalalsoseekstoofferauser-friendlyexperiencewhere non-technical users can quickly move between data ingestion, cleaning, and dashboard generation. Through this initiative, Etlytix BI envisions a more efficient and affordable ecosystemforSMEs,enablingthem tovisualize their data effectively and close the gap between complex datawarehousesandsimplespreadsheets.
The Etlytix BI project is founded on insights from extensive research in Business Intelligence (BI), opensource data processing, and self-service analytics. Studies highlight the critical nature of data-driven decisionmakingfor businesssustainabilityintheIndustry4.0 era. Research emphasizes that while large enterprises
International Research Journal of Engineering and Technology (IRJET) e-ISSN: 2395-0056
Volume: 13 Issue: 03 | Mar 2026 www.irjet.net p-ISSN: 2395-0072
successfully integrate sophisticated BI ecosystems, Small and Medium Enterprises (SMEs) often face significant barriers due to high licensing costs and steep learning curves. By integrating best practices from the Python ecosystem specificallyPandasfordatamanipulationand Plotlyforvisualization EtlytixBIprovidesamodularand user-friendly environment that bridges the gap between complex enterprise data warehouses and simple spreadsheets
Numerous Business Intelligence applications currently dominate the market, primarily focusing on robust, enterprise-grade features for large-scale data analysis. Someofthemostprominentsystemsinclude:
Microsoft Power BI & Tableau: These industry leaders offer comprehensive features but come with significant licensing costs and high hardware resource requirements thatareoftenprohibitiveforsmallerorganizations.
Traditional Spreadsheets (Excel/Google Sheets): While accessible, these often lead to manual data manipulation, "data silos," increased human error, and delayed insights whenusedforcomplexanalysis.
Standard Python Libraries (Pandas/Matplotlib/Seaborn): These tools provide powerful data processing and visualization capabilities but require substantial programming knowledge and specialized training, creatinga"skillsgap"fornon-technicalusers.
Cloud-Based BI Solutions (Google Cloud Looker/AWS QuickSight): These provide high scalability but often rely on expensive cloud subscriptions and complex setup procedures that can be difficult for beginners or SMEs to navigate.
Most current BI tools are either too expensive for smallscaleuseor tootechnicallydemandingfornon-specialists to operate without extensive training. There is a lack of lightweight, "plug-and-play" options that offer both webbased and standalone desktop functionality without requiringabrowserinstallation.
The evolution of data analytics has shifted from mere storage to real-time processing and visualization. Various methodologies have been explored to democratize data access:
Self-Service BI Architectures: Research argues that enabling non-technical users to generate their own reportsis the futureofBI. ToolslikeEtlytixBI buildupon this by abstracting the complexities of SQL queries and codingbehindavisualdrag-and-dropinterface.
Multi-Source Connectivity: Recent advancements emphasize the need for systems that canhandle a variety
of data sources, from flat files (CSV, Excel) to relational databaseslikeMySQLandPostgreSQL.
ETL (Extract, Transform, Load) Pipelines: Effective BI adoption relies on the foundational layer of clean, transformed data. Modern frameworks utilize automated data cleaning pipelines to handle missing values and perform type conversion, ensuring accuracy in final visualizations.
Hybrid Deployment Models: Integrating web-based flexibility with native desktop performance allows for versatile deployment environments. Utilizing wrappers likePywebviewfacilitatestheconversionofwebappsinto standalone executables, increasing accessibility for users withlimitedserverinfrastructure.
Traditional BI is often concerned with large-scale data warehouses, but recent trends focus on "SME Analytics," where cost-effectiveness and ease of use are prioritized overhigh-velocitybigdataprocessing.EtlytixBIaddresses these trends by providing a high-performance analytics solution through efficient open-source architecture without compromising on essential features like security orinteractivity.
The proposed system, Etlytix BI, offers an integrated, structured, and cost-effective approach to data analytics, specificallyaddressingtheaccessibilitygapsforSmalland Medium Enterprises (SMEs). By combining real-time data processing, hybrid deployment capabilities, and an intuitivedrag-and-drop interface, the project ensuresthat non-technical users have the professional tools needed to derive actionable insights from their data without prohibitivelicensingcosts.
Etlytix BI is suitable for business owners and data analytics beginners, providing an easy-to-use framework toanalyzeinformation from CSVfiles,Excel spreadsheets, and SQL databases. The system is designed to be lightweight and accurate, employing Pandas for data manipulation, Flask for backend control, and Plotly for interactivevisualization.
The core logic for transforming flat data into visual insightsfollowsthisalgorithmicpath:
International Research Journal of Engineering and Technology (IRJET) e-ISSN: 2395-0056
Volume: 13 Issue: 03 | Mar 2026 www.irjet.net p-ISSN: 2395-0072
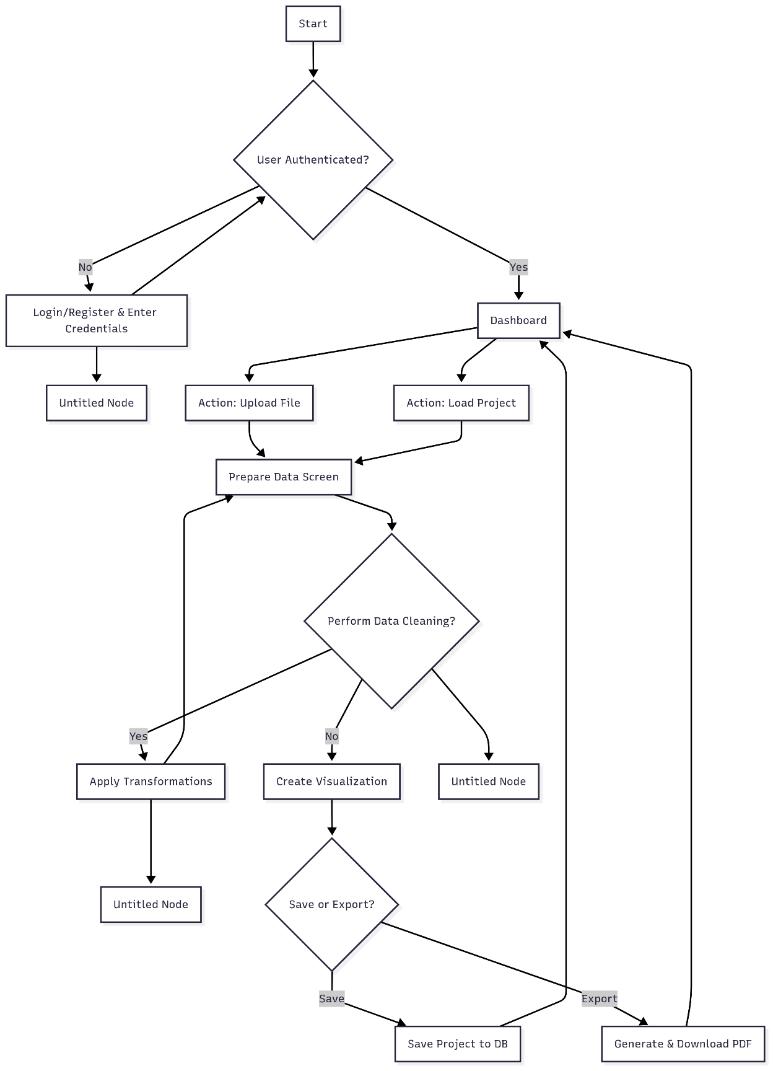
ExistingBusinessIntelligencetoolsfaceseveralchallenges in catering to smaller organizations. The following issues highlight the architectural limitations of traditional systemsandourproposedsolutions:
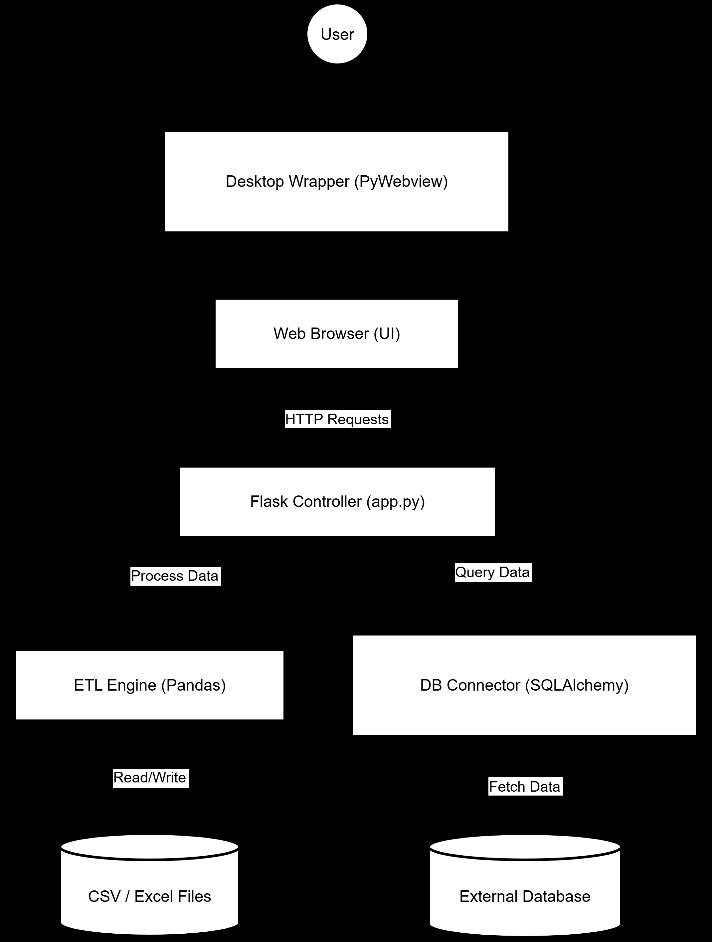
3.2 System Architecture
DeploymentComplexity:
Challenge: Most BI tools require complex server setupsorhigh-endhardware.
Solution: A lightweight MVC (Model-View-Controller) architecture that can run in a virtual environment (venv)onstandardconsumerhardware.
UserAccessibility:
Challenge: The "skills gap" created by tools requiring specializedtrainingorSQLknowledge.
Solution: Abstracting the backend logic into a visual "Dimension and Measure" sidebar, allowing users to builddashboardswithoutwritingcode.
DataScalabilityvs.Memory:
Challenge: Loading massive datasets can crash standardbrowser-basedapplications.
Solution: Implementing in-memory processing via Pandas DataFrames and optimizing loading times throughbytecodecompilation(__pycache__).
International Research Journal of Engineering and Technology (IRJET) e-ISSN: 2395-0056
Volume: 13 Issue: 03 | Mar 2026 www.irjet.net p-ISSN: 2395-0072
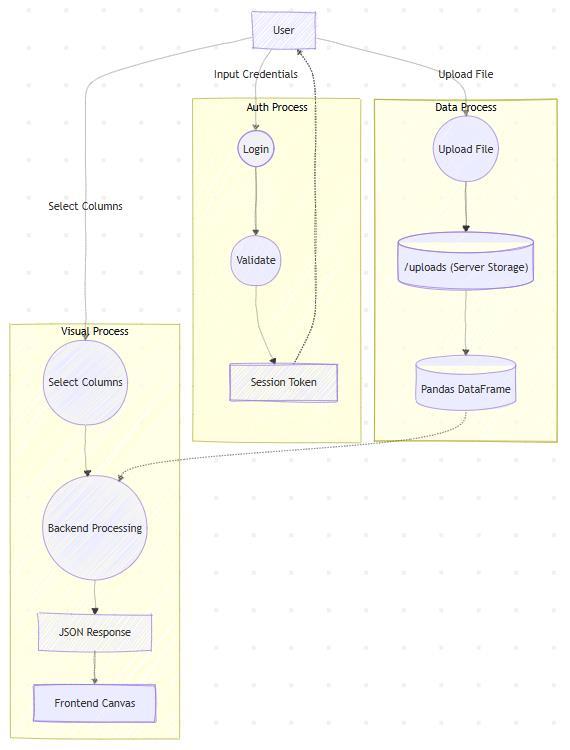
The data model for Etlytix BI follows a structured approach to ensure efficient management of user and businessdata:
4. Methodology
The implementation of Etlytix BI is structured into a modular pipeline that handles high-velocity data ingestion,rule-basedcleaning,andclient-siderendering.
Data Ingestion Phase: Utilizing multipart/form-data for secure file uploads and SQLAlchemy engines for databasehandshaking.
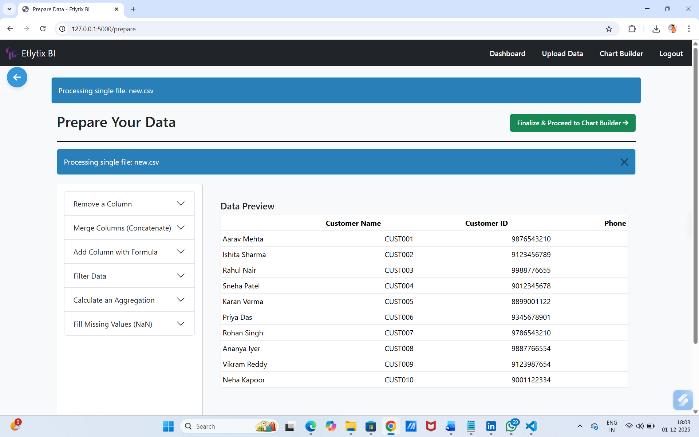
Data Preparation Phase: Generating summary statistics(min,max,mean)anda"head"preview(first 5rows)forinitialdataassessment.
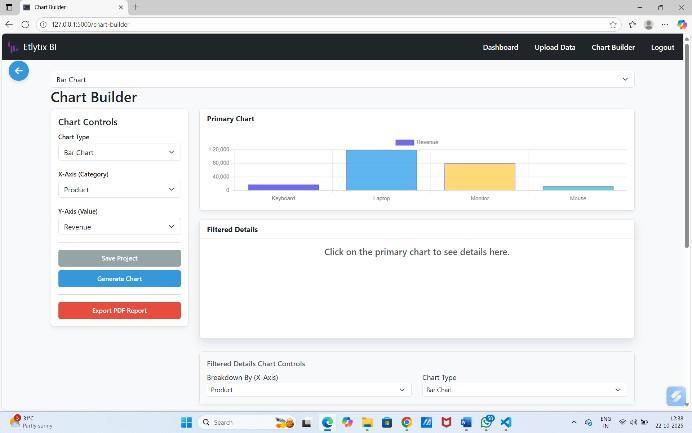
Visualization Engine Phase: Leveraging a POST request system where the backend processes DataFrames and returns JSON representations of graphstothefrontend.
Optimization & Hybridization: Converting the webbased Flask routes into a native window container usingrun_desktop.pyforversatiledeployment.
The implemented Etlytix BI project provides a streamlined and efficient approach to data analytics, specifically designed to empower users with self-service visualization capabilities. By successfully integrating the Pandas ETL engine and Plotly visualization library, the system allows for the rapid transformation of raw CSV, Excel, and SQL data into interactive dashboards. The architecture ensures high performance through inmemory processing and optimizes user accessibility by replacing complex coding requirements with an intuitive drag-and-dropinterface.
International Research Journal of Engineering and Technology (IRJET) e-ISSN: 2395-0056
Volume: 13 Issue: 03 | Mar 2026 www.irjet.net p-ISSN: 2395-0072
6. Conclusion
EtlytixBIsuccessfullydemonstratesthatarobustBusiness Intelligence tool can be both high-performing and costeffective. By utilizing open-source technologies like Flask and Pandas, the project provides a comprehensive solution for data ingestion, cleaning, and dynamic visualization tailored for SMEs. The inclusion of hybrid desktop capabilities via Pywebview ensures the tool is versatile enough for various deployment environments, from web servers to standalone local machines. This system serves as a foundational step toward democratizingdataanalytics,enablingnon-technicalusers to derive meaningful insights without the barriers of high licensing fees or specialized technical expertise. Future enhancements will focus on cloud scalability through Docker, AI-powered forecasting via Scikit-learn, and the integration of NoSQL database connectors to further expandthetool'sanalyticalreach.
The authors would like to express their sincere gratitude to Asst. Prof. Ashwini Thakare for his invaluable guidance, continuous encouragement, and technical supportthroughoutthedevelopmentof Etlytix BI.Wealso extend our thanks to Asst. Prof. Ashwini Thakare (Project Coordinator) and Prof. Radhika Nanda (Head of Department, Computer Engineering) for providing the necessary academic resources and laboratory facilities at Bharat College of Engineering, Badlapur.
Finally, we thank the University of Mumbai for providing the curriculum platform that motivated this research work.
References:
[1] H. Chen, R. H. L. Chiang, and V. C. Storey, "Business Intelligence and Analytics: From Big Data to Big Impact," MISQuarterly,vol.36,no.4,pp.1165-1188,2012.
[2] C. Vercellis, Business Intelligence: Data Mining and Optimization for Decision Making. Chichester, UK: Wiley, 2009.
[3] J. S. Saltz and K. Shamshurin, "Big data team process methodologies: A literature review and the identification of key factors for a project’s success," IEEE International ConferenceonBigData,pp.2872–2879,2016.
[4] S. Erevelles, N. Fukawa, and L. Swayne, "Big Data consumeranalyticsandthe transformationofmarketing," Journal of Business Research, vol. 70, pp. 263-286, Jan. 2017.
[5] F. Amalina, I. A. T. Hashem, Z. H. Azizul, A. T. Fong, A. Firdaus, M. Imran, and N. B. Anuar, "Blending Big Data Analytics:ReviewonChallengesandaRecentStudy,"IEEE Access,vol.7,pp.78378-78393,Jun.2019.
[6]I.A.Khan,A.Salam,F.Ullah,F.Amin,S.Tabrez,S.Faisal, and G. S. Choi, "Big Data Analytics Model Using Artificial Intelligence (AI) and 6G Technologies for Healthcare," IEEEAccess,vol.12,pp.91700-91715,2024.
[7] K. V. Metre, A. Mathur, R. P. Dahake, Y. Bhapkar, J. Ghadge, P. Jain, and S. Gore, "An Introduction to Power BI forDataAnalysis,"Int.J.Intell.Syst.Appl.Eng.,vol.12,no. 1s,pp.142-147,2023.
[8] J. Passlick, M. Hahnen, and B. Schauer, "A Self-Service Supporting Business Intelligence and Big Data Analytics Architecture,"inProc.WI2017Conf.St.Gallen,2017.

Niraj Rathod “currently pursuing BachelorofEngineeringin Computer Engineering from Bharat college of Engineering, Maharashtra, India. He hasInterestinDataanalytics,python programming,PowerBIandethicalhacking.

Gauri Pawar “pursuing Bachelor of Engineering in Computer Engineering from Bharat college of Engineering, Maharashtra, India. She has interest in Power BI, Data analytics,andpythonprogramming.


Sakshi Gund “currently pursuing BachelorofEngineeringinComputer Engineering from Bharat college of Engineering, Maharashtra, India. She has Interest in Ethical hacking, Data analytics, python programming and PowerBI.
Nisarg Manohar “pursuing Bachelor of Engineering in Computer Engineering from Bharat college of Engineering, Maharashtra, India. He
International Research Journal of Engineering and Technology (IRJET) e-ISSN: 2395-0056
Volume: 13 Issue: 03 | Mar 2026 www.irjet.net p-ISSN: 2395-0072
Has Interest in Python, Java, automatic testing, Data ScienceandDataanalytic