
International Research Journal of Engineering and Technology (IRJET) e-ISSN: 2395-0056
Volume: 13 Issue: 04 | Apr 2026 www.irjet.net p-ISSN: 2395-0072

International Research Journal of Engineering and Technology (IRJET) e-ISSN: 2395-0056
Volume: 13 Issue: 04 | Apr 2026 www.irjet.net p-ISSN: 2395-0072
Chinta
Naga Pavithra1 , Macharla Naga Mahesh2 , Kagita Adarsh3 , Ambati Pavan Kalyan4 , Kakarla Sashi Venkat5, Polisetti Karimulla6
1,2,3,4,5Undergraduate Students, Department of Electrical & Electronics Engineering, Bapatla Engineering College, Bapatla, Andhra Pradesh, India
6Assistant Professor, Department of Electrical and Electronics Engineering, Bapatla Engineering College, Bapatla, Andhra Pradesh, India
-***
Abstract - Electricity theft is a major issue faced by power distributioncompanies,leadingtosignificantfinanciallosses and reduced operational efficiency. Conventional detection methods, such as manual inspections and rule-based approaches, are often time-consuming, costly, and less accurate.Toovercomethesechallenges,thispaperpresentsa machine learning-based electricity theft detection system using both Support Vector Machine (SVM) and K-Nearest Neighbors (KNN) classifiers. The proposed system utilizes smartmeterconsumptiondatatoidentifyabnormalelectricity usage patterns effectively. Initially, the collected data is preprocessed to eliminate noise, handle missing values, and ensure data consistency. Subsequently, feature extraction is performed to identify key parameters such as energy consumption, time-based usage patterns, and voltage variations.Thesefeaturesarethenusedtotrainandevaluate both SVM and KNN models for classification. The system categorizes consumers into two classes: normal users and electricity theft cases. The performance of the models is evaluated using standard metrics such as accuracy and confusion matrix to ensure reliable results. Experimental resultsdemonstratethatbothmodelsareeffectiveindetecting electricity theft; however, the SVM model achieves higher accuracy of 99% compared to the KNN model. This indicates that SVM provides better classification performance for the given dataset. The proposed approach improves detection accuracy and helps reduce non-technical losses in power distribution networks, offering an efficient and reliable solution for modern smart grid systems.
Key Words: Electricity Theft Detection, Machine Learning, Support Vector Machine (SVM), K-Nearest Neighbors (KNN), Smart Meter Data, Classification.
Electricity theft is a serious issue in many countries, particularly in developing regions, where it contributes significantlytonon-technicallossesinpowersystems.Itcan occurthroughvariousmethodssuchasillegalconnections, meter tampering, bypassing meters, and manipulation of billinginformation.Theseactivitiesnotonlyresultinmajor financial lossesforpowerdistributioncompaniesbutalso
affectpowerquality,systemreliability,andthestabilityof theelectricalnetwork.
Conventionalelectricitytheftdetectionmethodsmainlyrely onmanualinspectionsandphysicalmeterreadings.These approaches require significant manpower, involve high operational costs, and are often inefficient in detecting complexandhiddentheftpatterns.Therefore,thereisaneed for more advanced, automated, and accurate detection techniques.
With the advancement of smart grid technologies and the deployment of smart meters, a large amount of electricity consumption data is now available. Machine learning techniquescananalyzethisdatatoidentifyunusualpatterns and detect electricity theft effectively. These methods improvedetectionaccuracywhilereducinghumaneffortand operationalcosts.
In this project, two machine learning algorithms, Support VectorMachine(SVM)andK-NearestNeighbors(KNN),are usedforelectricitytheftdetection.KNNisasimpleandeasyto-implement algorithm that classifies data based on similaritywithneighboringdatapoints.However,itrequires highcomputationaltimeandmaybelesseffectiveforlarge datasets.Ontheotherhand,SVMisapowerfulsupervised learning algorithm that can handle high-dimensional data and provides better classification accuracy by finding an optimaldecisionboundary.
The experimental results show that both algorithms are capable of detecting electricity theft, but the SVM model achieves higher accuracy compared to the KNN model. Therefore, SVM is considered more suitable for this application,asitprovidesefficientandreliableclassification of electricity consumption data into normal and theft categories.
Electricitytheftdetectionhasgainedsignificantattentionin recentyearsduetoitsimpactonpowerdistributionsystems andtheincreasingdemandforreliableenergymanagement. Traditional methods such as manual inspections and rulebased techniques have been widely used; however, these
International Research Journal of Engineering and Technology (IRJET) e-ISSN: 2395-0056
Volume: 13 Issue: 04 | Apr 2026 www.irjet.net p-ISSN: 2395-0072
approachesaretime-consuming,labor-intensive,andoften failtodetectcomplexandhiddentheftpatterns.Asaresult, there is a growing need for automated and intelligent detectionsystems
With the development of smart grid technologies and the deployment of smart meters, large volumes of electricity consumption data are now available. Researchers have exploredtheuseofmachinelearningtechniquestoanalyze this data and identify abnormal consumption patterns. VariousalgorithmssuchasDecisionTrees,ArtificialNeural Networks (ANN), Support Vector Machines (SVM), and KNearestNeighbors(KNN)havebeenappliedforelectricity theftdetection.Thesetechniquesprovideimprovedaccuracy andefficiencycomparedtoconventionalmethods
Among these methods, the K-Nearest Neighbors (KNN) algorithm is widely used due to its simplicity and ease of implementation. It classifies data based on similarity with neighboring data points. However, KNN requires higher computationaltime,anditsperformanceishighlydependent on the selection of the ‘k’ value. In contrast, the Support Vector Machine (SVM) algorithm is a powerful supervised learningmethodcapableofhandlinghigh-dimensionaldata andprovidingbetterclassificationaccuracybydetermining anoptimaldecisionboundary.
Several studies have reported that SVM-based models outperformothermachinelearningtechniquesindetecting electricitytheftwithhigheraccuracyandreliability.These models are effective in identifying complex consumption patternsandminimizingmisclassificationerrors. Basedontheanalysisofexistingliterature,itisobservedthat machine learning-based approaches provide an efficient solutionforelectricitytheftdetection.Therefore,thisproject focuses on implementing and comparing SVM and KNN algorithms,whereSVMdemonstratessuperiorperformance intermsofaccuracyandefficiency.
The proposed electricity theft detection system follows a structured process consisting of multiple stages, as illustrated in Fig. 1. Each stage plays a significant role in accurately identifying abnormal electricity consumption patterns
The system begins with the collection of electricity consumption data from smart meters. This data includes parameters such as energy usage (kWh), time-based consumptionpatterns,andvoltagelevels.Thecollecteddata serves as the primary input for further processing and analysis.
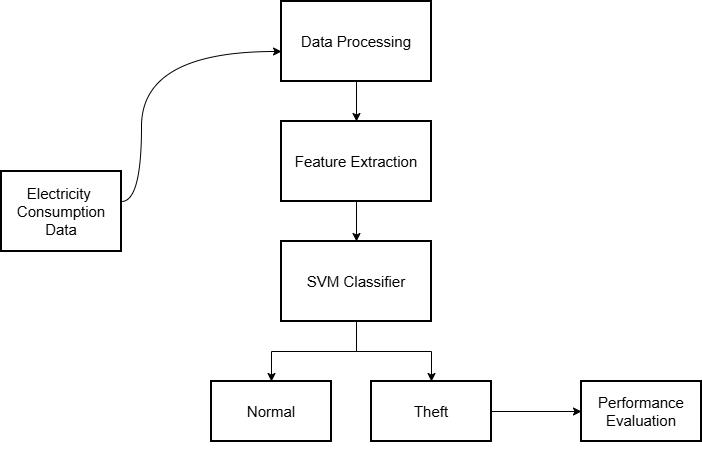
The raw data may contain noise, missing values, and inconsistencies.Therefore,itisprocessedinthisstageusing preprocessing techniques such as data cleaning, normalization, and handling of missing values. This step ensuresthatthedatasetisaccurate,consistent,andsuitable forfurtheranalysis.
In this stage, important features are extracted from the processed data. These features include daily energy consumption,peakusagetime,loadvariations,andvoltage fluctuations. Feature extraction helps reduce data dimensionalityandimprovestheefficiencyandaccuracyof theclassificationmodel.
The extracted features are fed into the Support Vector Machine (SVM) classifier. SVM is a supervised machine learning algorithm that determines an optimal decision boundary (hyperplane) to separate different classes. The model is trained using labeled data to classify electricity consumptionpatternsaseithernormalortheft.
International Research Journal of Engineering and Technology (IRJET) e-ISSN: 2395-0056
Volume: 13 Issue: 04 | Apr 2026 www.irjet.net p-ISSN: 2395-0072
BasedonthetrainedSVMmodel,thesystemclassifiesthe input data into two categories: normal consumption and electricitytheft.Thisclassificationhelpsinidentifyingusers involvedinfraudulentelectricityusage.
3.1.6
Theperformanceofthesystemisevaluatedusingstandard metrics such as accuracy and confusion matrix. These metricshelpinanalyzingtheeffectivenessofthemodelin detecting electricity theft. The proposed system achieves highaccuracy,indicatingreliableandefficientperformance.
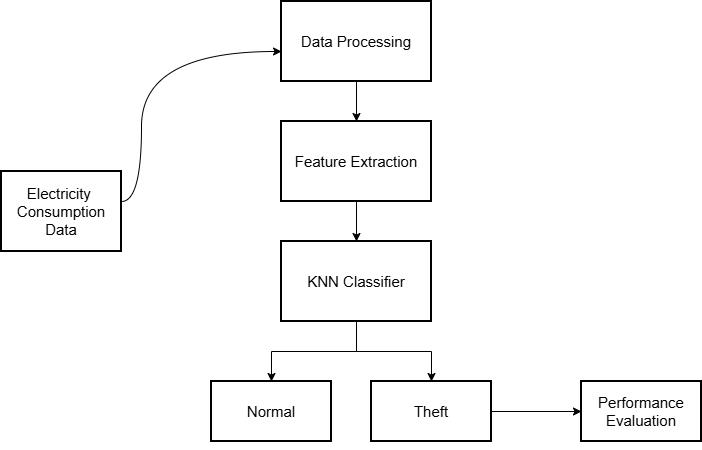
Theproposedelectricitytheftdetectionsystemalsoutilizes theK-NearestNeighbors(KNN)algorithmforclassification. TheoverallsystemarchitectureisillustratedinFig.2.The system processes electricity consumption data through multiplestagestoclassifyusersaseithernormalortheft.
3.2.1 Electricity Consumption
The system begins with the collection of electricity consumption data from smart meters. This data includes parameters such as energy usage (kWh), time-based consumptionpatterns,andvoltagelevels.Thecollecteddata servesastheprimaryinputforfurtheranalysis.
Thecollected raw data may contain noise, missingvalues, and inconsistencies. Therefore, preprocessing techniques suchasdatacleaning,normalization,andhandlingofmissing valuesareapplied.Thisstepensuresimproveddataquality andreliabilityforsubsequentprocessing.
In this stage, relevant features are extracted from the processed data. These features include daily consumption patterns, peak usage time, load variations, and voltage fluctuations.Featureextractionreducesdatacomplexityand enhancestheoverallperformanceofthemodel.
The extracted features are provided to the K-Nearest Neighbors (KNN) classifier. KNN is a supervised machine learningalgorithmthatclassifiesdatabasedonsimilarity.It identifies the ‘k’ nearest data points (neighbors) from the training dataset and assigns the class based on majority voting.Theselectionof‘k’playsacrucialroleindetermining theaccuracyofthemodel.
BasedontheKNNalgorithm,thesystemclassifiestheinput dataintotwocategories:normalconsumptionandelectricity theft.Thisclassificationisperformedbycomparingtheinput datawithitsnearestneighbors.
The performance of the KNN model is evaluated using standard metrics such as accuracy and confusion matrix. AlthoughKNNissimpleandeasytoimplement,itrequires highercomputationaltimeandmayprovideloweraccuracy comparedtoSVM,especiallyforlargedatasets.
https://drive.google.com/drive/folders/1ZoxiMc9JTzfSBkM QjEbkj4yqy5cbGcO5?usp=sharing
Electricity theft detection using supervised learning techniques is significantly influenced by the issue of class imbalance, where the number of normal (non-theft) consumers is considerably higher than that of fraudulent consumers.Duetothisimbalance,relyingsolelyonaccuracy asaperformancemetriccanleadtomisleadingresults.
To overcome this limitation, multiple evaluation metrics derived from the confusion matrix are considered in this study.Thesemetricsincludeaccuracy,precision,recall,and false positive rate, which together provide a more
International Research Journal of Engineering and Technology (IRJET) e-ISSN: 2395-0056
Volume: 13 Issue: 04 | Apr 2026 www.irjet.net p-ISSN: 2395-0072
comprehensive and reliable assessment of the model’s performance.
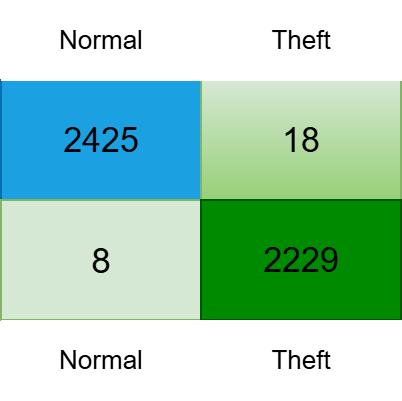
Fig -3: ConfusionMatrixforSVMApproach
The confusion matrix summarizes the performance of the classificationmodelindistinguishingbetweentwoclasses: NormalandTheft.Therowsrepresenttheactualclasslabels, whilethecolumnsrepresentthepredictedclasslabels.
True Positive [TP]: 2229
TheseareinstancescorrectlyclassifiedasTheft.Themodel successfullyidentified2229theftcases.
True Negatives (TN): 2425
ThesecorrespondtoNormalinstancesthatwerecorrectly classified.Themodelaccuratelylabeled2425normalcases.
False Positives (FP): 18
TheseareNormalinstancesincorrectlyclassifiedasTheft
Thisindicatesasmallnumberoffalsealarmswherenormal behaviorwasmistakenfortheft
False Negatives (FN): 8
These represent Theft instances incorrectly classified as Normal. This is a critical error type, as actual theft cases weremissedbythemodel.
4.1.2 Confusion
Fig.3showstheconfusionmatrixoftheSVMmodel,where the rows represent the actual classes and the columns represent the predicted classes. The model achieves high classification performance, with 2229 true positives and 2425truenegatives.Thenumberofmisclassificationsisvery
low,withonly18falsepositivesand8falsenegatives.This indicates that the model is effective in distinguishing betweennormalandtheftinstances,withalowfalsealarm rateandveryfewmissedtheftcases.
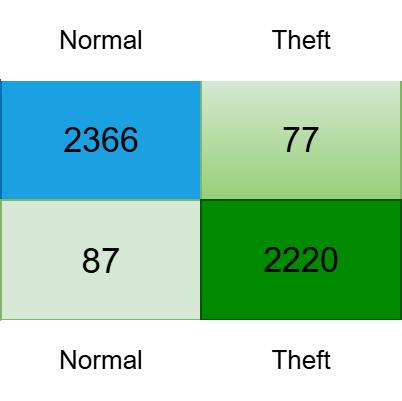
Fig -4: ConfusionMatrixforKNNApproach
The confusion matrix summarizes the performance of the classificationmodelindistinguishingbetweentwoclasses: NormalandTheft.Therowsrepresenttheactualclasslabels, whilethecolumnsrepresentthepredictedclasslabels.
True Positive [TP]: 2366
TheseareinstancescorrectlyclassifiedasTheft.Themodel successfullyidentified2229theftcases.
True Negatives (TN): 2220
ThesecorrespondtoNormalinstancesthatwerecorrectly classified.Themodelaccuratelylabeled2425normalcases.
False Positives (FP): 77
TheseareNormalinstancesincorrectlyclassifiedasTheft. Thisindicatesasmallnumberoffalsealarmswherenormal behaviorwasmistakenfortheft
False Negatives (FN): 87
These represent Theft instances incorrectly classified as Normal. This is a critical error type, as actual theft cases weremissedbythemodel.
International Research Journal of Engineering and Technology (IRJET) e-ISSN: 2395-0056
Volume: 13 Issue: 04 | Apr 2026 www.irjet.net p-ISSN: 2395-0072
Fig. 4 shows the confusion matrix of the proposed model, wheretherowsrepresenttheactualclassesandthecolumns represent the predicted classes. The model correctly classifies2220theftinstancesand 2366normalinstances. However,somemisclassificationsareobserved,with77false positives and 87 false negatives. This indicates that the model achieves good classification performance, although therearemoderateerrorsindistinguishingbetweennormal andtheftinstances.
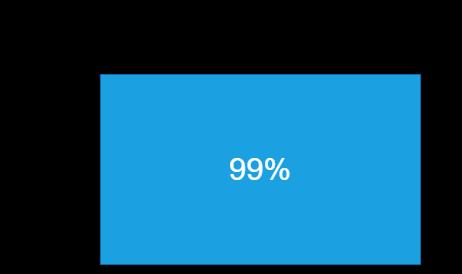
Fig -5: AccuracyofSVM
Fig. 5 shows the accuracy performance of the proposed model.Themodelachieveshighaccuracy,demonstratingits effectiveness in correctly classifying the data. The results indicate stable and reliable performance with minimal classificationerror.
Accuracy is defined as the ratio of correctly classified instancestothetotalnumberofinstances.
Accuracy=(TP+TN)/(TP+TN+FP+FN)
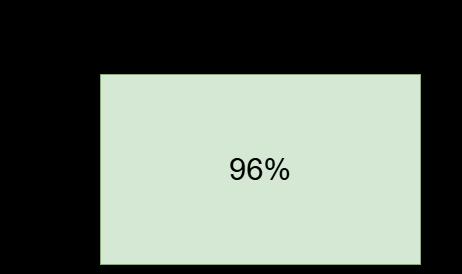
Fig -6: AccuracyofKNN
Fig.6showstheaccuracyperformanceoftheKNN model. The model achieves an accuracy of 96%, indicating good classification performance. It correctly classifies most instances, although some misclassifications are observed comparedtohigheraccuracymodels.
The performance of the models is compared based on accuracy.TheSVMmodelachievesanaccuracyof99%,while theKNNmodelachievesanaccuracyof96%.Thisshowsthat theSVMmodelperformsbetterthantheKNNmodel,with higheraccuracyandfewermisclassifications.Hence,SVMis moreeffectiveforelectricitytheftdetectioninthisstudy.
The performance of the Support Vector Machine (SVM) model is evaluated based on classification accuracy. The modelistrainedusingtheprocesseddatasetandtestedto determineitseffectivenessinidentifyingnormalandtheft cases. The following graph illustrates the accuracy of the SVMmodel.
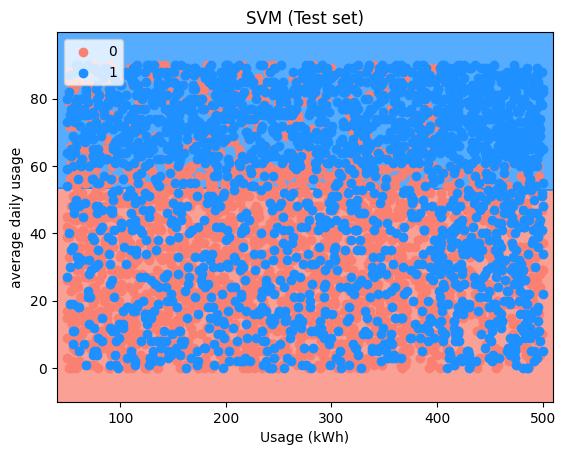
Fig -7: PerformanceofSVM
Fig.7showstheclassificationresultsoftheSVMmodelon thetestdataset,wherethex-axisrepresentselectricityusage (kWh)andthey-axisrepresentsaveragedailyusage.Orange indicates normal instances, while blue represents theft instances.Thedistributionshowsthatthemodelisableto distinguish between normal and theft patterns based on usage behavior. Theft instances are more prominent in higher usage regions, while normal instances are concentratedinlowerusageregions.However,someoverlap between the classes is observed, indicating minor misclassification.Overall,themodeleffectivelyseparatesthe two classes and demonstrates reliable performance in detectingelectricitytheft.
International Research Journal of Engineering and Technology (IRJET) e-ISSN: 2395-0056
Volume: 13 Issue: 04 | Apr 2026 www.irjet.net p-ISSN: 2395-0072
TheperformanceoftheK-NearestNeighbors(KNN)modelis evaluated based on classification accuracy. The model is trainedusingtheprocesseddatasetandtestedtoanalyzeits effectiveness in identifying normal and theft cases. The followinggraphillustratestheaccuracyoftheKNNmodel.
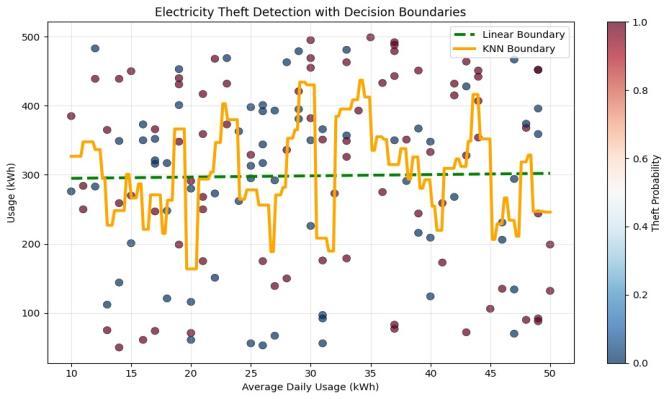
Fig.8illustratestheclassificationofelectricityconsumption patterns using machine learning models. The x-axis represents average daily usage (kWh), and the y-axis representspeakload(kW).Eachdatapointcorrespondsto anindividualconsumer,whilethecolorbarindicatestheft probability, where higher values represent a greater likelihoodofelectricitytheft.
Thegreendashedlinedenotesthelineardecisionboundary, which separates normal and suspicious consumption patterns using a linear approach. The orange curve represents the KNN (K-Nearest Neighbors) decision boundary,whichadaptsnon-linearlytothedatadistribution.
From the figure, it can be observed that the KNN model capturescomplexvariationsinconsumptionbehaviormore effectively than the linear model. Regions exhibiting irregular usage patterns and abnormal peak loads are identifiedaspotential theft cases.Thisindicatesthat nonlinearmodelsprovideimprovedperformanceindetecting electricitytheft.
In this paper, a machine learning-based approach for electricitytheftdetectionhasbeenproposedusingSupport Vector Machine (SVM) and K-Nearest Neighbors (KNN) algorithms.Thesystemutilizessmartmeterdatatoanalyze electricityconsumptionpatternsandclassifythemasnormal ortheft.
BothSVMandKNNmodelswereimplementedandevaluated usingstandardperformancemetricssuchasaccuracyand confusionmatrix.Theexperimentalresultsdemonstratethat both algorithms are capable of detecting electricity theft;
however, the SVM model outperforms the KNN model in termsofaccuracyandefficiency.TheSVMmodelachievedan accuracyof99%,indicatingitseffectivenessinidentifying abnormal consumption patterns with minimal misclassification.
The proposed system helps reduce non-technical losses, improvestheefficiencyofpowerdistributionsystems,and minimizes the need for manual inspection. It provides an automatedandreliablesolutionforelectricitytheftdetection inmodernsmartgridenvironments.
Inthefuture,thesystemcanbeenhancedbyincorporating largerdatasets,real-timemonitoring,andadvancedmachine learning or deep learning techniques to further improve detectionaccuracyandscalability.
[1]SafdarAliAbro,LyuGuangHua,JavedAhmedLaghari, MuhammadAkramBhayo,andAbdulAzizMemon,“Machine learning-based electricity theft detection using support vector machines,” International Journal of Electrical and ComputerEngineering(IJECE),vol.14,no.2,pp.1240–1250, Apr.2024,doi:10.11591/ijece.v14i2.pp1240-1250.
[2]M.S.Saeedetal.,“AnefficientboostedC5.0decision-treebased classification approach for detecting non-technical lossesinpowerutilities,”Energies,vol.13,no.12,Jun.2020, doi:10.3390/en13123242.
[3]H.Ghaedi,S.R.K.Tabbakh,andR.Ghaemi,“Improving electricity theft detection using combination of improved crowsearchalgorithmandsupportvectormachine,”Majlesi Journal ofElectrical Engineering, vol.15, no. 4, pp.63–75, Dec.2021,doi:10.52547/mjee.15.4.63.
[4]J.Nagi,A.M.Mohammad,K.S.Yap,S.K.Tiong,andS.K. Ahmed, “Non-technical loss analysis for detection of electricity theft using support vector machines,” in Proc. IEEE2ndInt.PowerandEnergyConf.(PECon),Dec.2008, pp.907–912,doi:10.1109/PECON.2008.4762604.
[5] R. Akram et al., “Towards big data electricity theft detectionbasedonimprovedRUSBoostclassifiersinsmart grid,” Energies, vol. 14, no. 23, Dec. 2021, doi: 10.3390/en14238029.
[6] W. Zhu, N. Zeng, and N. Wang, “Sensitivity, specificity, accuracy, associated confidence interval and ROC analysis with practical SAS® implementations,” in Northeast SAS UsersGroupConf.:HealthCareandLifeSciences,2010,pp. 19.
[7]Z.Zheng,Y.Yang,X.Niu,H.N.Dai,andY.Zhou,“Wideand deep convolutional neural networks for electricity-theft detection to secure smart grids,” IEEE Trans. Ind. Informatics, vol. 14, no. 4, pp. 1606–1615, Apr. 2018, doi: 10.1109/TII.2017.2785963.Industrial Informatics, vol. 14,
International Research Journal of Engineering and Technology (IRJET) e-ISSN: 2395-0056
no. 4, pp.1606–1615, Apr. 2018, doi: 10.1109/TII.2017.2785963.
[8]S.H.Hussain,A.Hussain,R.Shah,andS.A.Abro,“Mini rover-objectdetectinggroundvehicle(UGV),”Universityof Sindh Journal of Information and Communication Technology,vol.3,no.2,pp.104–108,2019.
[9] L. K. Ramasamy, S. Kadry, Y. Nam, and M. N. Meqdad, “PerformanceanalysisofsentimentsinTwitterdatasetusing SVM models,” Int. J. Electrical and Computer Engineering, vol. 11, no. 3, pp. 2275–2284, Jun. 2021, doi: 10.11591/ijece.v11i3.pp2275-2284.
[10]M.Zulqarnain,R.Ghazali,Y.M.M.Hassim,andM.Rehan, “Textclassificationbasedongatedrecurrentunitcombined withsupportvectormachine,”Int.J.ElectricalandComputer Engineering (IJECE), vol. 10, no. 4, pp. 3734–3742, Aug. 2020,doi:10.11591/ijece.v10i4.pp3734-3742.
[11]I.Slimanietal.,“Automatedmachinelearning:thenew data science challenge,” Int. J. Electrical and Computer Engineering (IJECE), vol. 12, no. 4, pp. 4243–4252, Aug. 2022,doi:10.11591/ijece.v12i4.pp4243-4252.
[12]T.B.Smith,“Electricitytheft:acomparativeanalysis,” EnergyPolicy,vol.32,no.18,pp.2067–2076,Dec.2004,doi: 10.1016/S0301-4215(03)00182-4.
[13] A. Foster and V. Pushak, “Ghana’s infrastructure: a continental perspective,” in The Oxford Handbook of ReligiousDiversity,2010.
[14] D. Carr and M. Thomson, “Non-technical electricity losses,” Energies, vol. 15, no. 6, Mar. 2022, doi: 10.3390/en15062218.
[15]M.N.Hasan,R.N.Toma,A.AlNahid,M.M.M.Islam,and J.M.Kim,“Electricitytheftdetectioninsmartgridsystems:A CNN-LSTMbasedapproach,”Energies,vol.12,no.17,Aug. 2019,doi:10.3390/en12173310.
[16] K. Fatima, M. Rafique, A. M. Soomro, and M. Kumar, “Tailoringhydrogenadsorptionanddesorptionpropertiesof Li-dopedSV(singlevacancy)monolayerh-BNsystemsusing abinitiocalculations,”CanadianJournalofPhysics,vol.101, no.11,pp.673–685,Nov.2023,doi:10.1139/cjp-2023-0072.
[17]I.H.Sarker,“Machinelearning:Algorithms,real-world applicationsandresearchdirections,”SNComputerScience, vol.2,no.3,May2021,doi:10.1007/s42979-021-00592-x.
[18] H. Kaur and V. Kumari, “Predictive modelling and analyticsfordiabetesusingamachinelearningapproach,” AppliedComputingandInformatics,vol.18,nos.1–2,pp.90–100,Jul.2022,doi:10.1016/j.aci.2018.12.004.
Volume: 13 Issue: 04 | Apr 2026 www.irjet.net p-ISSN: 2395-0072 © 2026, IRJET | Impact Factor value: 8.315 | ISO 9001:2008