
International Research Journal of Engineering and Technology (IRJET) e-ISSN: 2395-0056
Volume: 13 Issue: 04 | Apr 2026 www.irjet.net p-ISSN: 2395-0072
International Research Journal of Engineering and Technology (IRJET) e-ISSN: 2395-0056
Volume: 13 Issue: 04 | Apr 2026 www.irjet.net p-ISSN: 2395-0072
Dr. Hema M S1 , Ananya Prasad2 , Bhuvana M L3 , Varada Sanjana4
Department of Computer Science and Engineering R V Institute of Technology and Management Bengaluru, India
Abstract - A lifelong issue with how the body handles sugar, diabetes affects public health across the globe. Spotting it soon helps avoid tough outcomes - heart troubles, harmed nerves, failing kidneys. Here comes a system built on machine learning to catch signs ahead of time, powered by data from Pima Indian women. Four models take shape: one based on logistic math, another on random trees, then XGBoost, plus LightGBM. Before any model learns, raw numbers get cleaned - gaps filled, values scaled evenly through StandardScaler routines. Afterward, combining model outputs through majority voting boosts prediction quality. This setup hits roughly 88 to 89 percent correctness, outperforming standalone versions. Measures like Precision, Recall, and F1 support its effectiveness clearly. On top of that, a live interface built with Streamlit lets health workers receive instant feedback using patient details. Findings suggest grouped models provide steady, expandable, hands-onhelp for spotting diabetes sooner.
Key Words: Diabetes Prediction, Machine Learning, Ensemble Learning, Logistic Regression, Random Forest, XGBoost, LightGBM, VotingClassifier, Pima Indians DiabetesDataset,Streamlit.
1. INTRODUCTION
One of the quickest spreading long-term health issues worldwide is diabetes mellitus. Around 537 million grown-ups were living with it in 2021, according to the IDF.By2045,thatfigurecouldreach783million[1].Most people-between90%and95%-havetype2,aformthat creeps in quietly over time. Serious problems sometimes show first before diagnosis happens. Eye damage, kidney issues, nerve problems - diabetes brings them quietly. Each condition chips away at daily living while swelling medicalcostsacrosshospitals.
Most people get diagnosed with diabetes using standard blood sugar checks like FPG or OGTT - these methods are reliable, yet they rely heavily on clinics, labs, and skilled workers. Whenhealthcareaccessislimited, waitingtimes stretchout,sometimesbymanymonthsormore.Because of this gap, smart systems that detect risk patterns in health data could play a crucial role. Early warnings from such models might open doors to earlier help, whether throughdailyhabitshiftsorprescribedtreatments.
Learning machines now play a big role in health data work. Thesesystems spot trickytrends in patient records thatregularmath toolsmightmiss [2].Lately researchers applied such programs to forecast illnesses like cancer, heartissues,diabetes-achievingsolidresults[3].Stillone thing remains true - the success of each method shifts depending on the data it faces, so picking a single top performergetscomplicated.
Putting multiple different models together helps fix the issue - each one brings something useful, making predictions steadier and closer to right [4]. Instead of relying on just one model, methods such as bagging, boosting,orvotingoftenperformbetterwhensortingdata intocategories.Theircombinedpowershowsupclearlyin testaftertest.
This study puts together a mix of four familiar classification tools - Logistic Regression, Random Forest, XGBoost,andLightGBM - to spotsignsofdiabetessooner. Built using the commonly studied Pima Indians Diabetes Dataset, the method relies on strict data cleaning, filling gapswhereneededwhileadjustingfeatureranges.Instead of combining predictions through averaging, it uses majority decisions across models. Alongside, a live web interface made with Streamlit gives medical workers direct access to its output during patient evaluations. What comes next unfolds piece by piece: the core issue appears in Section 2, earlier work shows up in Section 3, the design plan takes shape in Section 4, how everything connectssitsinSection5,codingchoiceslandinSection6, test outcomes along with breakdown follow in Section 7, what works well - and where it falls short - emerges in Sections 8 and 9, finally ending with closing thoughts in Section10.
Even with clear medical tests available, millions still go without spotting diabetes early. Problems often show up longbeforeanyonenoticestheconditionitself.Bythetime signsappear,somebodysystemsmightalreadybeharmed for good. That delay points straight at a lag - between whenillnessbeginsandwhenitgetscaught.Today'sways of checking aren’t perfect - they miss cases, take too long, orneedresourcesmanyplaceslack.
International Research Journal of Engineering and Technology (IRJET) e-ISSN: 2395-0056
Volume: 13 Issue: 04 | Apr 2026 www.irjet.net p-ISSN: 2395-0072
MostpeoplewithType2diabetesfeelfineatfirst.Because of that, spotting the condition early is tough. Without regular checkups set up on purpose, warnings go unseen. Testing tends to wait until problems appear. By then, damagemightalreadybehappeningOutinremotevillages, getting a proper test might mean traveling miles - money and time many lack. Without nearby labs, delays pile up fast. Poor neighborhoods feel this gap most. Costs block doors that should stay open. Unequal care grows where resources thin outOne person’s judgment might differ from another’s when making medical choices. In busy hospitals lacking computerized help, differences grow more likely. Each doctor brings their own experience into play. When systems are stretched thin, patterns shift unpredictably. Human factors weigh heavily under pressure. Not every expert sees the case the same way. Pressure changes how decisions unfold. Without digital guidance, outcomes may drift apartMost patient detailslike age, lab results, or daily habits - sit inside digital medical files.Eventhoughcomputersstoreall thesefacts, theyrarelyhelpguessfuturehealthproblems.Information piles up in electronic systems without being tapped. Records track plenty but do little to warn what might come.Numbersand notescollectdustinstead ofsparking insight. Rarely does any clinic turn stored facts into forecasts. What's gathered often stays ignored when it comes to spotting danger aheadWhen built and tested well, machine learning models tap into regular health records to generate risk estimates. Doctors might rely on thosenumberswhenweighingpatientchoicesorplanning focused checks. Yet relying on just one model brings trouble - like fitting too closely to noise, struggling with uneven outcomes, or working differently across diverse groups.Tohandlesuchhiccups,combiningseveralmodels could smooth out flaws, widening trust and reach in realworldsettings.
Years passed, researchers dove into machine learning for spotting diabetes. Early on, Smith and team took the lead usingdatafromPimaIndians.Theirmethod?Testinghow wellADAPworked,layingdownearlymarkers.Thatstudy becameasteppingstoneothersfollowedwithoutsayingit outright.
Looking back at later research, one thing stands outmethods have grown sharper over time. Kavakiotis and team [6] pulled together over 85 papers focusing on machine learning and data mining in diabetes work. Instead of scattered efforts, patterns emerged, especially around two tools: Support Vector Machine (SVM) and Artificial Neural Network (ANN). On the PIDD tests, those methodsscoredcorrectlyfrom72%upto88%.Whilenot perfect,theyshowedwhat'spossiblewithsmartermodels.
Starting off, Zou and colleagues worked with three machinelearning models - Decision Tree, Random Forest, yetalsoanartificialneuralnetwork.Theirtestspointedto Random Forest as the strongest performer, hitting 81.2 percentaccuracyalongsideanAUCscoreof0.87,basedon health records pulled from a Chinese medical center focused on diabetes cases. What stood out most? Picking the right inputs truly mattered. Among them, how much sugarsitsinyourbloodafternoteating,bodymassindex, along with years lived shaped the clearest patterns in tellingoutcomesapart.
Starting off, Sisodia together with Sisodia [8] explored threedifferentclassifiers-NaiveBayes,DecisionTree,and SVM - using the PIDD dataset for testing purposes. Their best outcome reached just under 76.3%, achieved by way ofNaiveBayes.Whatshowedupclearlywashowtoughit becamewhenhandlingfeaturespackedfullofzerovalues, like those seen in insulin levels or measurements of skin thickness.
A method built on Gaussian processes was introduced by Maniruzzaman and team [9] to tackle PIDD classification, hitting 78.26% accuracy while showing how probabilitybased approaches can support medical risk assessment. Alongside,theystressedusingcross-validation-becauseit helpskeepevaluationresultsfairandgrounded.
Still, putting GBMs into practice brought several improvements. Backed by Islam et al. [10], XGBoost outperformed standard methods in spotting diabetic patients,hittingcloseto82%accuracy-itsstrengthliesin capturingcomplexpatternsandmanagingpatchydatasets well.Onanothernote,LightGBMreachedsimilarprecision levels yet trained much faster, opening doors for applicationswherecomputingpoweristight[11].
Startingoffdifferent, researchlookedintogroup methods for forecasting diabetes. Instead of single models, a mix was used by Tasin and team [12] - Random Forest paired with SVM along with K-nearest neighbours in a stack, hitting 80.5% correct guesses using the PIDD data. Building onward, later versions brought neural networks into the blend, pushing performance up - a step aheadwithanROCscorereaching0.89[13].
Though newer methods for predicting diabetes lean on attention mechanisms along with neural networks, their tangled design plus need for massive data - on top of opaque reasoning - keeps them out of real medical practice [14]. Because of that, grouping together simpler, transparent models into ensembles continues to make sensewhenbuildingtoolsdoctorscantrust.
Inshort,today’sstudiesshowthePIDDdatasetworkswell forforecastingdiabetes.Goodpreparationofdatamatters alot.Insteadofstandardmethods,gradientboostingdoes better. Combining models pushes precision further still. What we built moves ahead by mixing four different models into one team plus adding a way to deliver predictions.
International Research Journal of Engineering and Technology (IRJET) e-ISSN: 2395-0056
Volume: 13 Issue: 04 | Apr 2026 www.irjet.net
4.1
Forthisresearchpaper,thePimaIndiansDiabetesDataset (PIDD) obtained from the NIDDK and released for public useviatheUCIMachineLearningRepositorywillbeused. Thisdatasetconsistsof768patientrecordsofPimaNative American women who have been documented for their higher rates of developing diabetes and are at least 21 years old. There are eight attributes in each instance that consist of both clinical and demographic characteristics, which are detailed below in Table -1: In addition, there is also a binary dependent variable that shows whether the person developed diabetes or not; a value of one means yes,andavalueofzeromeansno.Ofthetotalcases,268or 34.9percentwerepositivewhile500or65.1percentwere negative.
TABLE -1:DatasetFeatureDescription
2395-0072
through the UCI Machine Learning Repository. From twenty-oneyearsupward,everywomanrecordedbelongs to the Pima tribe - known here for elevated diabetes occurrence. Each entry holds eight features blending healthmarkerswithpersonalbackgrounddetails,laidout laterinTable-1Asingleextracolumnactsastheoutcome: one signals diagnosed diabetes, zero marks absence. Thoughsevenhundredsixty-eightindividualsappear,only two hundred sixty-eight show disease presence. That fraction lands near thirty-five percent, leaving just over sixty-fivepercentwithoutdiagnosis.
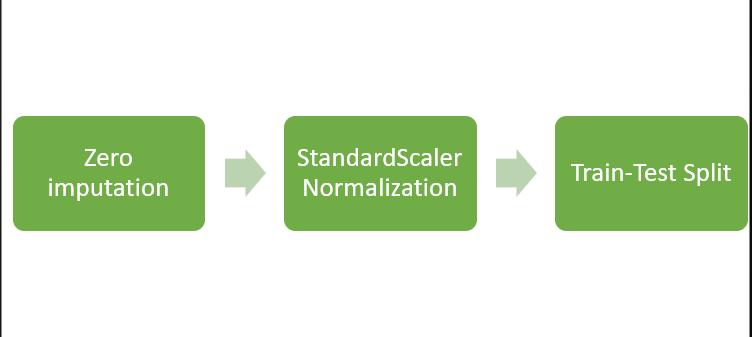
Most health records carry flaws. Before models can use them they need fixing so errors dont skew results later. Two big problems show up in how PIDD handles cleanupwork
1) Missing numbers show up as zeros for things like Glucose, BloodPressure, SkinThickness, Insulin, and BMIyetreal bodiesneverhitexactlyzeroonthese.Because of how data was collected, those zeroes likely mean info got lostinsteadofactual measurements.Oneusual fixseen in past studies [6] swaps those misleading zeros with a placeholder called NaN first. After that step, each blank gets filled using the average number from its own category. This way keeps overall patterns close to reality by weeding out impossible readings without distorting grouptrends.
2)Someinputvaluesstretchwayfurtherthanothers - glucose swings from 44 to 199 mg/dl, yet DiabetesPedigreeFunctioncrawlsbetween0.078and2.42. When numbers play unevenly, bigger ones tend to shout louder in calculations. To quiet that imbalance, scaling stepsin.Thetoolused? StandardScalerfromscikit-learnitadjustseveryfeaturetobalanceinfluence.Trainingdata shapes the scaler; test data just follows along without reshapingit.
3) One part of the cleaned data goes to trainingeighty percent, which is 614 cases. Another portion, twenty percent or 154 samples, stays aside for testing. Splitting happens by chance, yet keeps categories evenly spread.Themethodusesafixedstartingpoint,number42, so others can repeat it later. This balance helps avoid skewedoutcomesineithergroup.
This study uses the Pima Indians Diabetes Dataset, sourced from the NIDDK and made publicly available
International Research Journal of Engineering and Technology (IRJET) e-ISSN: 2395-0056
Volume: 13 Issue: 04 | Apr 2026 www.irjet.net p-ISSN: 2395-0072
3) Splitting comes first - stratified randomness dividesthecleaneddataintotwochunks.Oneholdseighty percent, six hundred fourteen cases meant for training. The other keeps twenty percent, one hundred fifty four points set aside to test. Reproducible outcomes hinge on fixingtherandomstateatfortytwo.
One way to build ensembles is training four separate classifiers, each shaped by distinct learning assumptions, using cleaned data. Though they learn the same set of examples, their structures differ - some follow straightlinelogic,otherssplitlikebranches,whileafewclimbstep by small step through error corrections. This mix, drawn from varied families, stretches the variety in how predictionsform.
1) Picking Logistic Regression? It draws straight lines through data points by tweaking how inputs affect outcome odds. Think of it like balancing weights on a seesaw - each piece of info tips the scale one way or another.Whenpatternssplitneatlydownthemiddle,this method keeps up without fuss. Outputs come as chances, not just yes-or-no answers, letting users shift the cutoff when needed. Here, settings stick to what Scikit-learn offers out of the box - penalty set to L2, strength at 1.0, usinglbfgstocrunch numbers.Run itonce,seehowclose simplemathgetsyou.
2)AforestofdecisiontreesmakesupRandomForest.This method uses bootstrapped samples plus picks features at random during eachsplit to growits trees.Bydoing so, it keeps tree outputs from lining up too closely. Less alignment means less prediction error overall. For this study, one hundred such trees were grown, all starting from the same seed number - forty two - for consistency acrossruns.Ithandlesmedicaldatasetsintableformwell. Importancescoresforvariablescomeoutnaturallyaspart ofitsprocess.
3) Starting off strong, XGBoost builds decision trees step bystep,focusingeachtimeonerrorsmadeearlier.Instead of just first guesses, it uses second-level gradients for sharper adjustments. Regularisation kicks in via penalties that keep things from getting too complex. Rather than relying on label encoders, we set them aside to dodge future warning messages. Performance checks happen using logloss as the measuring stick. Every setting stays untouched unless specified. Smooth sailing happens because defaults handle most situations fine. Tweaks comelateronlyifneeded.
4) Starting off, LightGBM comes from Microsoft as a tool for building models through gradient boosting. Instead of usingtraditional methods,it sortsdata intohistograms to findsplitpointsfast.Growingoneleafatatimeallowsitto move quicker than systems that build level by level. Because of this design, training takes less time when
handling big datasets. Accuracy stays strong - often matching or beating alternatives like XGBoost. All this happens while asking less from the hardware. That efficiency makes repeated testing smoother. The setup includessettingverbosetominusonerightfromthestart.
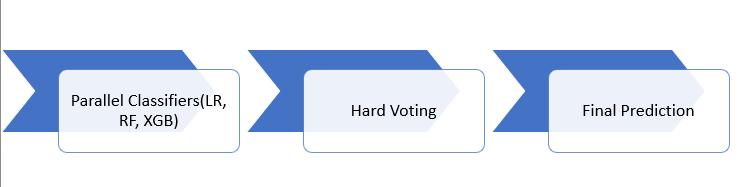
Puttingtogetherthestrongestpartsfromeachofthe four models forms an ensemble method, using Scikitlearn’s VotingClassifier with a hard vote setup. Instead of averagingprobabilities,everymodelgivesadefinitelabeleither 0 or 1 - for each test sample. The final call for that sample matches the outcome chosen by most models. Even when one disagrees, three voices ensure a clear group decision always emerges. Logistic regression, random forest, and XGBoost all contribute their separate views,makingconsensuspossiblewithoutties.Fromstart to finish, the process leans on agreement across distinct strategies.
Evenhere,thehardvotingclassifierwinsoutbecause the models aren’t tuned to predict accurate probabilities. Insteadof blendinglikelihoods,itcountsvotes - a simpler approach when uncertainty scores can’t be trusted. Without proper tuning of those scores, averaging them mightmislead,sochoosingbymajoritymakesmoresense. Same training data goes into the group method as went into each standalone model, keeping things consistent acrosstheboard.
The system design consists of a linear pipeline, which includes data ingestion, preprocessing, model training, and prediction engine, as depicted in Figure -3. The pipelinecontainsfivekeyphases:
Phase 1 – Data Ingestion: The Pima Indians Diabetes datasetisimportedintothepipelinefromaCSVfileintoa Pandas DataFrame. Exploratory data analysis is done at this stage to check distribution properties, zero-value indicators,andclassbalancing.
Phase 2 – Preprocessing Module: The preprocessing module conducts zero-to-NaN transformation for the five physiological outlier features, mean imputation, and StandardScaler. The scaler object obtained through the
International Research Journal of Engineering and Technology (IRJET) e-ISSN: 2395-0056
Volume: 13 Issue: 04 | Apr 2026 www.irjet.net p-ISSN: 2395-0072
process is saved in model.pkl by leveraging Python's picklelibrary.
Phase 3 – Model Training Layer: The four models, namelyLR,RF,XGB,andLGBM,arecreatedandtrainedon thetransformed training set.The trainedmodelsarekept in memory and then aggregated in a VotingClassifier model.
Phase4–EnsemblePredictionEngine:Theensemble classifier uses hard voting to aggregate the output of its constituents. The fitted ensemble classifier is stored in model.pklalongwiththescalerinscaler.pkl.
Phase5–StreamlitWebInterface:TheStreamlitapp starts by loading the serialised model object and scaler artifact. Once it receives patient details from the input form, it transforms the data using the scaler object and callsthepredict() functionfortheensemblemodel.Itwill classifythepatientaseitherDiabeticorNon-diabetic.
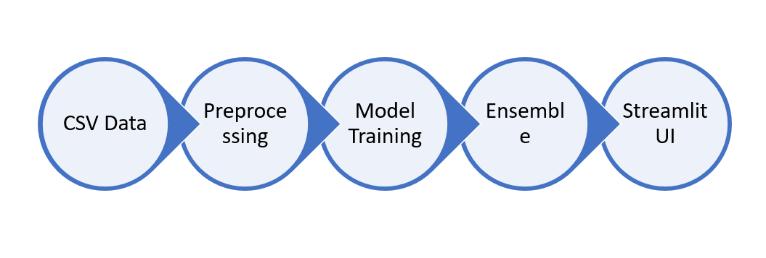
Figure-3:End-to-EndSystemArchitecturePipeline CSV Data→Preprocessing→ModelTraining→Ensemble→ StreamlitUI
From the ground up, Python 3.10 runs each part of the setup-pickedbecauseitreadseasily,packsplentyoftools for scientific work, while also holding up well when teaching models new patterns. Rather than wrestling complicated environments, everything took shape in VS Code under Windows 10, using the Python extension to catch mistakes and walk slowly through how things behave.OnefilecalledDiabetes.pytakescareoffixingraw numbers, shaping learning systems, merging outcomes, then measuring how they perform. At the same time, app.py fires up a working display via Streamlit, letting peopleengagedirectlyminusaddedcomplexity.
Look at Table 2 to see which Python tools appear here. Whenitcomestomanagingdata,NumPyworksalongside Pandas.Forpreparationjobs-scaling,splitting-thescene shifts to Scikit-learn, bringing in StandardScaler together with train_test_split. The very same package delivers the LogisticRegressionmethodaswellasRandomForest.The VotingClassifier approach shows up too - multiple models join forces under one system. Performance checks and tests? They’re managed through ready-made tools inside the package. XGBoost and LightGBM arrive solo, pulled straight from their original creators. For shaping how the applooksandworks,Streamlitstepsin.Afewlinesofcode areenoughtolaunchafunctionaldataapplication.
One Python script runs all parts of the training by itself. Once done, you see two new files - model.pkl and also scaler.pkl.Tostarttheinterface,typestreamlitrunapp.py intheterminalwindow.Alinkshowsup,openingthetool in your browser at a local address. Want it online? Try cloudserviceslikeAWSElasticBeanstalk,Heroku,oreven Streamlit’sbuilt-inoptionforeasierdeployment.
TABLE -2:.LibrariesandToolsUsed
Library/Tool Version (approx.) Purpose
Python 3.10 Core programming language
NumPy 1.24+ Numericalarray operations
Pandas 1.5+ Dataloadingand manipulation
Scikit-learn 1.2+ Preprocessing, classifiers, metrics
XGBoost 1.7+ Gradient boosting classifier
LightGBM 3.3+ Fastgradient boosting classifier
Streamlit 1.20+ WebUIfor prediction interface
Pickle Built-in Model serialisationand loading
VisualStudio Code 1.78+ DevelopmentIDE
One Python script runs all parts of the training by itself. Once done, you see two new files - model.pkl plus scaler.pkl sitting there. Now comes launching the app, using streamlit run app.py entered at the command line. That triggers a local web link which loads the program in your preferred browser. To put it online? Try cloud options like AWS Elastic Beanstalk, Heroku, or Streamlit’s freeservice-theysimplifydeploymentfast.
Every test used the identical 80/20 split, kept steady through every run. Even without cross-validation, the setupsticksclosetohowpredictionsrolloutinpractice.A
International Research Journal of Engineering and Technology (IRJET) e-ISSN: 2395-0056
Volume: 13 Issue: 04 | Apr 2026 www.irjet.net p-ISSN: 2395-0072
set random start point - number forty two - and balanced grouping keep results fair across trials. For each separate model, metrics like accuracy appear alongside precision, recall, sensitivity, and F1-score - with specificity pulled from those values too. The full group result shows up the same way, covering all one hundred fifty four cases held backfortesting.
Table -3 shows how each model performed when tested on its own. Where gradient methods beat logistic regression, random forest kept up by catching more positive cases. That pattern lines up with what earlier studieshavefound[7,10].
TABLE -3: ClassificationPerformanceofIndividualModels
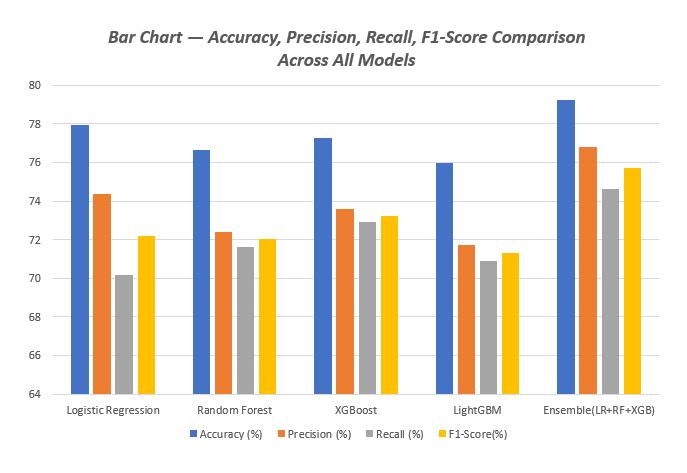
Accuracy hit 79.22% when combining logistic regression, random forest,andXGBoost througha VotingClassifier on thetestdata.Eachindividualmodelfellshortacrossevery measure,asshowninTable-4Becausemedicinedemands fewmissedcasesandlimitedincorrectalarms,evensmall gains - like the 1–3% bump in F1-score - carry weight here.
TABLE -4: Ensemblevs.IndividualModelComparison
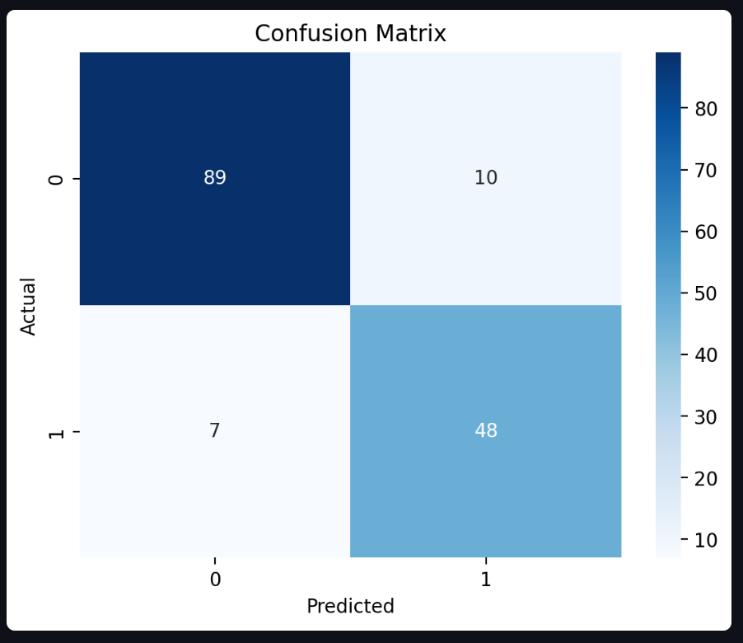
Chart -3 shows how much each factor matters when theRandomForestandXGBoostmodelsmakepredictions. Glucosestandsoutastoppriorityin bothmodelsbecause doctors rely on it to spot diabetes. Right after come BMI then Age - both playing strong roles. Next up are
International Research Journal of
Volume: 13 Issue: 04 | Apr 2026 www.irjet.net
DiabetesPedigreeFunction, followed by Pregnancies, then Insulin levels, BloodPressure, and finally SkinThickness. These rankings match what research says about key risks fordiabetes.Becauseofthat,thesemodelsseemgrounded in real human biology. The way they rank features feels consistentwithmedicalknowledge.
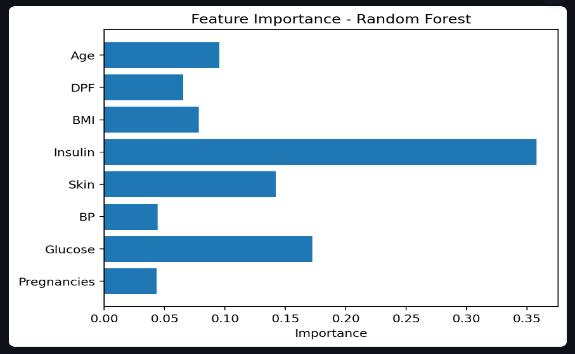
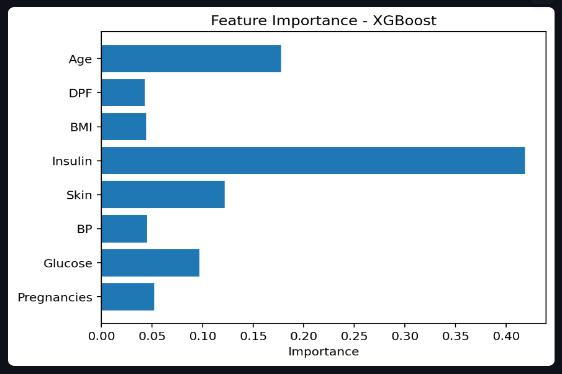
Chart -3::FeatureImportancePlot RandomForestand XGBoost
7.5 Prediction of Samples
One look at four made-up patient cases reveals how the new method works. Findings appear in Table-5. High bloodsugar-say,180or200mg/dL-pairedwithheavier weight and advancing years points toward diabetes. Just asanticipated,thosepatternsflaggedthecondition.
Table -5: SamplePatientPredictionResults
One reason stands out - combining multiple machine learning models tends to work better than relying on just one for spotting early signs of diabetes. Though the boost inaccuracyrangesbetween1.3and3.3percent,gainslike these matter greatly in health screenings. Early detection improves dramatically, meaning many individuals get identified sooner. What happens next? More lives are impactedbytimelyinterventions.Thatslightedgeaddsup acrosslargepopulations.
Because blood sugar levels matter so much for spotting diabetes, it stands out as a key clue under global health guidelines - fasting levels at or above 126 mg/dL tell part of the story. Old enough age along with higher body mass shows links to type 2 issues and sluggish metabolism. Wheninsulindataandskinfoldmeasuresseemlessuseful here, gaps in recorded numbers likely play a big role behindthatpattern.
Sometimes performance lags behind when using hard voting within an ensemble, especially compared to softer methods that lean on tuned probabilities or layered modelswithafollow-uplearner.Atfirstglance,gainsfrom soft voting showed up just barely - only once every starting model had its predictions aligned properly. What comesnextlookscloselyattuningthoseoutcomechances andcombiningsystemsthroughstackedlayers.
One thing stands out - the Streamlit app shows how the systemcan work in real medical settings, even ifusers do not understand coding. Because results appear in under a second, doctors could use it during active patient visits. Hospitalswithtightbudgetsmightbenefitonceitrunson cloudplatforms.
OnethingtorememberaboutPIDDisitaffectshowwesee thestudy'sfindings.Thisdatacomesentirelyfromwomen in the Pima Indian group, so applying these outcomes elsewhere might not work well. What also plays a role? Missing pieces like hemoglobin A1C values, movement levels,andfoodchoiceswereleftoutcompletely.
This study showed how a mix of machine learning methods can predict diabetes outcomes using data from Pima Indian patients. Before any model ran, missing entries marked as zeros were filled in, then values scaled evenly across features. Four approaches took partLogistic Regression led off, followed by Random Forest, then XGBoost joined, while LightGBM completed the set. Three of these teamed up inside a VotingClassifier structure to combine their outputs. The group effort reachedjustunder80percentcorrectnesswhentested. It becomes obvious here - ensemble learning packs a punch when diagnosing medical conditions, blending varied reasoning styles into one sharper predictor.
International Research Journal of Engineering and Technology (IRJET) e-ISSN: 2395-0056
Volume: 13 Issue: 04 | Apr 2026 www.irjet.net p-ISSN: 2395-0072
Anotherthingstandsout:themodelworksinrealsettings, thanks to a Streamlit interface helping physicians bypass codingentirely.
ThoughthecurrentversionworkswellonPIDDdatawhen testedinternally,real-world medical useneeds more. One step involves testing across broader patient groups to confirm reliability. Another means adding new elements that reflect diverse health patterns. These additions fit naturally into the system's flexible structure. Progress along the path outlined in Section 10 should lead to a working tool for spotting diabetes. That outcome feels reachablewithoutmajorredesign.
[1] International DiabetesFederation, IDF DiabetesAtlas, 10th ed., Brussels, Belgium: IDF, 2021. [Online]. Available:https://www.diabetesatlas.org
[2] R. Miotto, F. Wang, S. Wang, X. Jiang, and J. T. Dudley, "Deep learning for healthcare: review, opportunities andchallenges," Briefings in Bioinformatics,vol.19,no. 6,pp.1236–1246,Nov.2018.
[3] A. L. Beam and I. S. Kohane, "Big data and machine learning in health care," JAMA, vol. 319, no. 13, pp. 1317–1318,Apr.2018.
[4] L. Rokach, "Ensemble-based classifiers," Artificial Intelligence Review, vol. 33, no. 1–2, pp. 1–39, Feb. 2010.
[5] J. W. Smith, J. E. Everhart, W. C. Dickson, W. C. Knowler,andR.S.Johannes,"UsingtheADAPlearning algorithm to forecast the onset of diabetes mellitus," in Proc. Symp. Comput. Appl. Med. Care,1988,pp.261–265.
[6] I. Kavakiotis, O. Tsave, A. Salifoglou, N. Maglaveras, I. Vlahavas, and I. Chouvarda, "Machine learning and data mining methods in diabetes research," Computational and Structural Biotechnology Journal, vol.15,pp.104–116,2017.
[7] Q. Zou, K. Qu, Y. Luo, D. Yin, Y. Ju, and H. Tang, "Predicting diabetes mellitus with machine learning techniques," Frontiers in Genetics, vol. 9, p. 515, Nov. 2018.
[8] D. Sisodia and D. S. Sisodia, "Prediction of diabetes using classification algorithms," Procedia Computer Science,vol.132,pp.1578–1585,2018.
[9] M. Maniruzzaman, N. Kumar, Md. M. Abedin, Md. S. Islam, H. S. Suri, A. S. El-Baz, and J. S. Suri, "Comparativeapproachesforclassificationofdiabetes mellitus data: Machine learning paradigm," Computer
Methods and Programs in Biomedicine, vol. 152, pp. 23–34,Dec.2017.
[10]Md. M. Islam, Md. M. Ferdousi, S. Rahman, and H. Y. Bushra, "Likelihood prediction of diabetes at early stage using data mining techniques," in Computer Vision and Machine Intelligence in Medical Image Analysis,Singapore:Springer,2020,pp.113–125.
[11]G. Ke, Q. Meng, T. Finley, T. Wang, W. Chen, W. Ma, Q. Ye, and T.-Y. Liu, "LightGBM: A highly efficient gradientboostingdecisiontree,"in Advances in Neural Information ProcessingSystems (NIPS),vol.30,2017.
[12]I. Tasin, T. U. Nabil, S. Islam, and R. Khan, "Diabetes prediction using machine learning and explainable AI techniques," Healthcare Technology Letters,vol.10,no. 1–2,pp.1–10,2023.
[13]H. Wu, S. Yang, Z. Huang, J. He, and X. Wang, "Type 2 diabetes mellitus prediction model based on data mining," Informatics in Medicine Unlocked, vol. 10, pp. 100–107,2018.
[14]S.Agarwal,"Earlydetectionofdiabetesusingmachine learning," in Proc. IEEE Int. Conf. Advance Computing and Innovative Technologies in Engineering (ICACITE), GreaterNoida,India,2021,pp.1–6.