
International Research Journal of Engineering and Technology (IRJET) e-ISSN: 2395-0056
Volume: 13 Issue: 04 | Apr 2026 www.irjet.net p-ISSN: 2395-0072
International Research Journal of Engineering and Technology (IRJET) e-ISSN: 2395-0056
Volume: 13 Issue: 04 | Apr 2026 www.irjet.net p-ISSN: 2395-0072
Virendra Chaurasiya
Virendra Chaurasiya Sunder deep Engineering College Ghaziabad, India
Ms. Vandana Sharma Dept. Of Computer Science Sunder deep Engineering College Ghaziabad ,Dept. Of Computer Science Sunder deep Engineering College, Uttar Pradesh, India
Abstract - The research shows that organizations in today digital business environment create their sales data through customer purchases product sales and daily customer interactions. Organizations depend on data analysis for assessing their business results which helps them make better decisions. The research team used Microsoft Excel SQL and Power BI to study sales data in order to find important business insights. The dataset contains essentialinformation which includes product categories and sales amount and customer details and order dates and payment methods. The research team applied data preprocessing methods which include cleaning and filtering and removing inconsistencies to achieve accurate and reliable results.
Key Words: E-Commerce, Data Analysis, Data Visualization, PowerBI,SQL,CustomerBehavior,ProfitAnalysis,etc
Thecurrentdigitaleconomyexperiencesitsmostrapidgrowth through e-commerce which generates extensive daily transactional data. Online retail businesses keep gathering customer order data together with product category information and sales totals and payment method details and regionalsalesdata.Unprocessedsalesdatapresentschallenges for analysis because it requires specific analytical methods to extract meaningful insights from its unstructured state. The project analyzes sales data from structured CSV datasets which include Orders and Details to create valuable business insights throughdataanalyticsandvisualizationtechniques.Thedataset contains essential information which includes customer names andorderdates and productsub-categoriesand quantitiesand profitandpaymentmethods
1.1
The business performance assessment establishes a complete operational view through data integration and processing activities. The data preprocessing process used data cleaning procedurestoremoveduplicaterecordsandaddressmissingdata andformatdatathroughMicrosoftExceltoachieveaccurateand uniformresults.Theresearchidentifiedcriticalpatternsthrough analysis which examined how sales distributed among customers and profit fluctuated monthly and different product subcategoriesperformedinthemarket
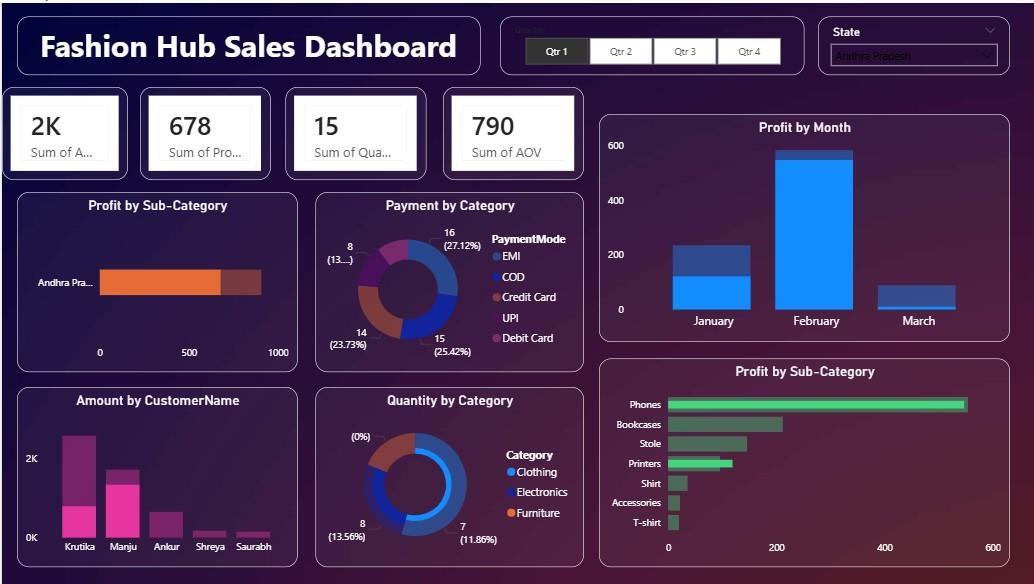
Power BI was used to develop interactive dashboards which enable effective data visualization through their interactive dashboard system. The dashboard displays essential performancemetricswhichincludetotalsalesandquantitysold and average order value (AOV) and total profit. The visual elements of the presentation include bar chartsand piecharts and donut charts which show profit distribution by subcategory and payment mode distribution and monthly profit trendsandcustomer-wisesalescontribution.
The analysis shows that sales and profit exhibit different patterns throughout the year because of seasonal variations. Certainproductcategoriescontributemoretooverallrevenue, whilespecificcustomersgeneratehighersalesvolumes.
Thecustomerpurchasingpreferencesarerevealedthrough the distribution of payment modes which includes EMI cash on delivery credit card and debit card payments. The study demonstrates that Excel data preprocessing combined with PowerBIvisualizationenablesorganizationstoconverttheirraw salesdataintousefulbusinessinsights.
The data analysis process enables businesses to gain insights about their customers and their sales results and their overall operationalefficiency.
Volume: 13 Issue: 04 | Apr 2026 www.irjet.net p-ISSN: 2395-0072
Thetechniquesenabletheprocessingofdatathroughfourdistinct operations which include handling missing values and removing duplicate records and correcting inconsistencies and organizing thedataintoastructured format.Theresearchteamconducteddata analysisaftertheycompletedthedatacleaningprocesstoidentify patternsandrelationshipsinthedatasetthroughvariousanalytical methods which included high-performing product identification and customer purchase behavior analysis and regional sales performance examination. The paper continues with Section 2 which examines existing research that relates to leaf disease detection.TheproposedmethodologyinSection3presentsallits components through a detailed step by-step explanation. The experimentsareexplainedinSection4throughthepresentationof results and evaluation methods which included specific equations. The research findings are examined in Section 5 through an assessment of the positive and negative aspects that were identified during the study. Section 6 provides a work summarywhileassessingupcomingresearchopportunities.
Thebusinessintelligencefieldnowdependsonsalesdataanalysis to support its decision-making processes which have become business-critical functions. Many researchers and professionals have explored different tools and techniques to transform raw sales data into meaningful insights that can improve organizationalperformanceOneofthemostcommonlyusedtools in sales data analysis is Microsoft Excel. According to Winston (2016), Excel provides powerful features such as pivot tables, charts, and conditional formatting that allow users to clean, organize, and visualize data effectively. People use this tool for basic data analysis because it offers an easy-to-use interface that anyonecanaccess.StructuredQueryLanguage(SQL)hasalsobeen highlightedasanessentialtoolformanagingandanalyzinglarge datasets. The data extraction process becomes easier through SQLwhichLinoff(2015)describedasapowerfultoolforlocating specific data from relationaldatabases while handling extensive structuredsalesinformation.SQLservesasanessentialcomponent requiredtoconvertrawdataintoformatssuitableforsubsequent analyticalproceduresanddatarepresentationactivities.PowerBI hasbecomeapowerfulbusinessintelligencesolutionthatenables userstobuildinteractivedashboardsanddisplayreal-time data. Clark(2020)describedPowerBIasareportingtoolthatenables organizations to view KPIs and monitor sales patterns while producing interactive business intelligence reports. The system provides effective sales analysis capabilities because it can connect with different data sources. People now choose Pythonbaseddataanalysistoolsbecausetheyprovideuserswithflexible yetpowerfultoolswhichallowadvanceddataanalysiswork.Data manipulation and visualization tasks depend on the Pandas and Matplotlib libraries which data scientists widely employ. ResearchershaveshownthatPythonenablesefficienthandlingof large datasets and supports advanced analytical techniques, including predictive analysis and machine learning. Research studies have demonstrated that people use data visualization techniques to comprehend complex datasets because these techniqueshelp them interpret complex information. Sales data visualization techniques, including bar charts, line graphs, and dashboards, assist users in tracking sales data through its various trendsandpatternswhileidentifyinganyoutliersalesactivities
The proposed methodology of this study focuses on transforming raw sales data into meaningful insights using a structured data analysis approach. The process involves multiple stages including data collection, preprocessing, analysis, and visualization using tools such as MicrosoftExcel and Power BI. the proposed methodology ensures a systematic approach to analyzing sales data by combining data preprocessing, analysis, and visualization techniques to generatemeaningfulandactionableinsights.
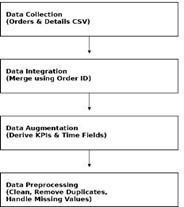
The data used in this project is obtained from structured CSV files, namely Orders and Details. These datasets contain important information such as order dates, customer names, product categories and sub-categories, quantity sold, sales amount, profit, and payment modes. The datasets are integrated to form a unified data model for analysis. The Orders dataset includes attributes such as Order ID, Order Date, Customer Name, State, and Payment Mode. This dataset primarily focuses on customer-related and transactional information. On the other hand, the Details dataset contains product-specific information such as Product Category, SubCategory, Quantity, Sales Amount, and Profit. Together, these datasets provide a complete view of sales activities from both customer and product perspectives. The collected data spans multiple transactions and includes various product categories such as clothing, electronics, and furniture. It also reflects different customer segments, regional sales distribution, and multiplepaymentmethodsincludingCashonDelivery(COD),
Volume: 13 Issue: 04 | Apr 2026 www.irjet.net p-ISSN: 2395-0072
EMI, credit card, and debit card. Overall, the collected dataset providesareliablefoundationforperformingdatapreprocessing, analysis, and visualization. It enables the identification of sales trends, customer purchasing behavior, and product performance, whichareessentialformakinginformedbusiness294.andproduct performance,whichare essentialformakinginformedbusiness.The study used data which was obtained from structured CSV files containing two files named Orders and Details which contain complete details about sales transactions. The datasets offer a real-worlde-commercesalessettingwhichenablesresearchersto studycustomerbehaviorandproductperformanceand business operations. The two datasets get connected through a shared key whichidentifiesallitemsinacustomer'sorder throughtheirunique OrderID.Therelevantattributesneedtobelinkedtogetherforthis stepbecausethisconnectionenablesefficientcombinedanalysis. Themethodologyrequiresdataintegrationtocreateasingledata structure whichcombines multiple datasets so thatanalystscan conducttheirresearch.Thestudyintegratedtwodatasets’Orders andDetailstoachievecompletesalestransactiondata.TheOrders dataset contains customer and transaction-level information such as Order ID, Order Date, Customer Name, State, and Payment Mode. The Details dataset provides product-level information through its Category, Sub Category, Quantity, Sales Amount, and Profit fields. The two datasets exist as separate entities which show limited information but their combination delivers a comprehensiveviewofcustomerbehaviortogetherwithproduct performance.Dataintegrationimproveddatasetqualitythrough its enhancement process which enabled advanced analysis and valuableinsightstosupportbusinessdecisionmaking.
The researchers used data augmentation in their study to improvetheexistingsalesdatasetwhichresultedinbetterdata quality and deeper data analysis capabilities. The original datasets which included Orders and Details contained fundamental transactional and product information but researchersdevelopedextraderivedattributestoenablemore usefulanalysisandvisualization. Theexistingdatasetwasused to create new features which served as the basis for augmentationinsteadofacquiringadditionalexternaldata.The OrderDate fieldenabled the extractionofadditionaltime-based attributeswhichincludedmonth,quarter,andyear.Thederived attributes enabled researchers to study seasonal patterns and evaluatemonthlysalesresults.
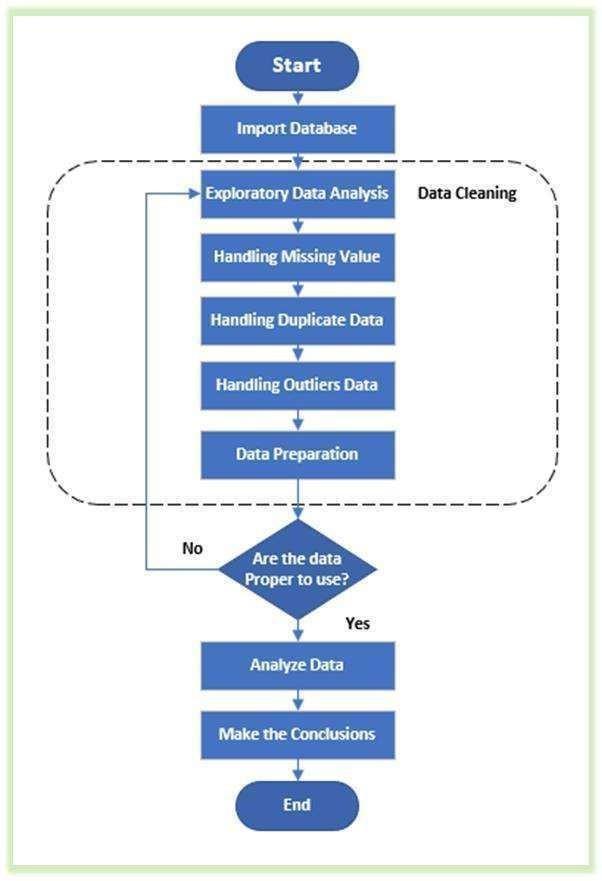
Before analysis, the data is cleaned and prepared using MicrosoftExcel.Theprocessinvolveshandlingmissingdataand eliminating duplicate records and correcting entry errors and proper column formatting. The process of data filtering and sorting improves the quality and structural organization of the data. The team evaluated both outliers and data points that showed inconsistent behavior. The research team examined extreme values which had the potential to disrupt their analysis process. The research team handled the extreme values with caution to ensure their analysis results remained unaffected. Datapreprocessingservesasanessentialfundamentalprocess because it establishes clean and consistent data standards which enable subsequent analytical work. The study team used Microsoft Excel to preprocess the Orders and Details datasets before they started data integration and visualization workinPowerBI.
The initial process involved checking the datasets to find missingdataandduplicateentriesanddatainconsistencies.The analysisprocessrequiredmissingdatatobemanagedthrough two methods, which involved filling missing data with appropriate values or discarding incomplete records. The process helped to maintain data accuracy while ensuring the dataset remained trustworthy. The process of duplicate entry detection and deletion was performed to eliminate duplicate records, which would have led to incorrectanalysis results. The calculationofsalesandprofitandquantitymetricsneedsevery transaction to be treatedasadistinct eventto achieve precise results.
The process of EDA begins after the completion of data preprocessing since it helps to discover both patterns and trends. The calculation process determines key metrics which includetotalsalesandtotalprofitandquantitysoldandaverage order value AOV. The research analysis includes the following areas of study: Profit by sub-category Sales distributionacross customersMonthlysalesandprofittrendsCategory-wisequantity distributionPaymentmodepreferencesTheinitialevaluationof business performance used key performance indicators KPIs which included total sales and total profit and total quantity soldandaverageordervalueAOV.Thedatasetmetricsprovided asummarywhichhelpedtoidentifythecompletesalespattern. The analysis of payment modes examined how customers use differentpaymentmethodsby studying theirusage ofCash on DeliveryCODandEMIandcreditcardanddebitcardpayment methods. The data analysis process changed raw sales information into useful business insights which enabled better marketing decisions and product performance improvements anddata-leddecisionsupport.
Thisresearchstudydependsondatavisualizationbecauseit uses graphicalrepresentationtomakedifficult-tounderstandandlarge amounts of sales data accessible. The analysis results were shownthroughvariousPowerBIvisualizationtechniqueswhich interactive presentationmethodtodisplaytheobtainedinsights. Themaingoalofdatavisualizationinthisprojectexiststomake sales data easier to understand while showing critical patterns
2395-0056
Volume: 13 Issue: 04 | Apr 2026 www.irjet.net p-ISSN: 2395-0072
andexisting trendsandtheir associated connections. Business performance becomes easier to understand through visual elements that include charts and dashboards because these tools enable users to see the information without needing to analyze the actual numerical data. The "Fashion Hub Sales Dashboard" interactive dashboard was created to display essential business information. The dashboard displays vital keyperformanceindicators(KPIs)whichtracktotalsalesand total profit and total quantity sold and average order value (AOV) metrics. The indicators deliver a rapid assessment of totalbusinessperformance.
4.6 Insight Generation
Thevisualanalysisprocesscreatesbusinessinsightswhichhelp organizationsidentify theirbest-selling productsand seasonal salestrendsandtheirmostimportantcustomersandtheirmost popular payment methods. The resulting insights from this processhelpguidemarketingeffortsandinventorymanagement andbusiness strategydevelopment.
CreditCard,andDebitCard.Thedonutchartshowshowmuchof the total transactions were completed using each payment method through its different segments. The data shows that customers use various payment methods because no payment method has become completely dominant in customer preferences. The customer base prefers payment methods that enable them to make payments at their own schedule because EMI and COD account for a large portion of transactions. CustomersuseEMItobuyexpensiveitems,whileCODservesasa payment method forpeoplewho wantto payafterthey receive theirproductsbecausetheyhavetrustissueswiththeproduct.The usageofcreditcardanddebitcardpaymentshasgrownbecause these payment methods now make up a large part of all transactions.Peoplepreferthesemethodsfortheirfastandeasy and safe online transaction capabilities. The study of payment modes gives businesses important information about how customers buy products and choose their payment methods. Businesses can use this information to create better payment systemsbydetectingpaymentpatternsthatwillhelpcustomers find their preferred payment methods. The information helps organizationsdeveloptheirpromotionalcampaignsbychoosing suitableEMIoffersanddigitalpaymentdiscountsandonline
transactionrewards.
4.7 Decision support
Theprocessendswithresearchersusingtheircreatedinsights tosupportbusinessmanagersanddecision-makers whoneedto make data-driven choices. The method provides organizations with a functional framework which they can use to enhance theirperformancetoachievesuccessfulbusinessgrowth.The proposed methodology establishes a systematic sales data analysisprocesswhichcombinesdata preprocessing, analysis, and visualization methods to produce valuable insights for decision-making.andManagers canthenuseittoadapttomarket changesquicklyviaontimedata-supportedstrategicdecisions
YourdatatrainingextendsuntilthemonthofOctoberintheyear 2023. The "Payment by Category" visualization shows how customers use different payment methods to make their purchases. The chart shows that customers use four main paymentmethods,whichincludeEMI,CashonDelivery(COD),
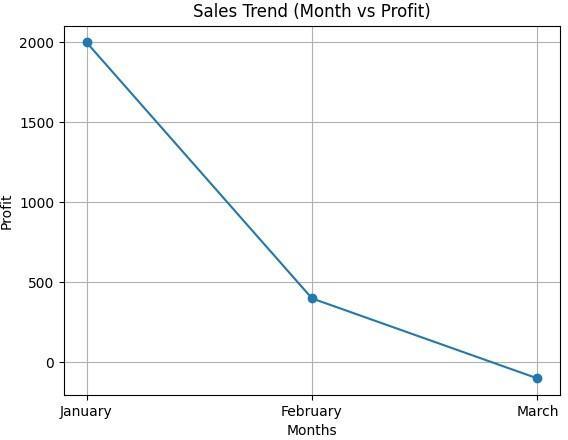
The "Profit by Month" visualization shows how profit changes between different months, which enables users to detect businessperformance patternsbased ontime. The chartshows that profit levels throughout the period display substantial variations because they do not maintain a constant value. The analysisshowsthatFebruaryproduces the highest profit figure when compared to January and March because sales performance reaches its highest point during that month. The analysisprovidescashflowinsightswhichenablebetterfinancial planning because it shows cash flow patterns that occur during variousperiods.Businessesneedtoidentifythesetrendsbecause ithelpsthemcreatebetteroperationalplans
Volume: 13 Issue: 04 | Apr 2026 www.irjet.net p-ISSN: 2395-0072
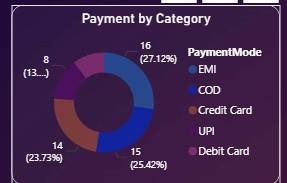
Fig.4.DistributionofPaymentModesbyCategory
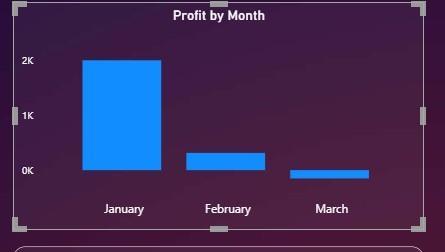
Fig.5ProfitTrendAcrossMonths
Theprofitbysub-category visualizationdemonstrateshow different product subcategories contribute to total profit. The analysis helps identify products that perform well along with products that perform poorly within the company. The chart shows that phones and bookcases generate much more profit than other product subcategories. These products serve as essential revenue sources which drive business financial success. The subcategories of accessories and tshirts with shirts generate less profit which demonstrates their performance level.Sub-category profit differences arise fromcustomerdemandpatternsandpricingstrategiesand product popularity within the market. Businesses should promotetheirhigh-performingproductswhilekeepingthemin stock and they should evaluate their low-performing products through new marketing techniques and pricing modifications. The analysis provides executives with essential support for making decisions about product management and pricing strategies and resource distribution. Businesses that concentrate their efforts on profitable sub-categories will achieve maximum profitability whichleadstotheirsustainablegrowth
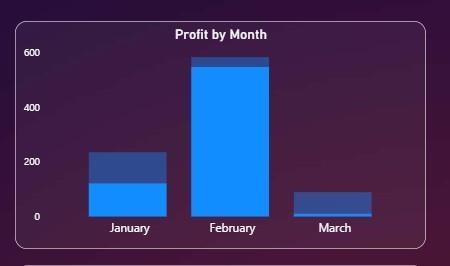
Fig.6-Sub-CategoryPerformanceBasedonProfit
The research results demonstrate that dataanalysisand data visualization techniques serve as essential tools for comprehending sales performance and customer behavior. The integrated sales dataset analysis uncovered multiple significant patterns which companies can use to make better businessdecisions. The monthly profitanalysisshowsthat business performance patterns change throughout the year because of seasonal fluctuations. Certain months, such as February, show higher profitability, while others experience relatively lower performance. The customer demand fluctuations stem from three main factors which include promotional activities, market trends, and seasonal preferences. Businesses can enhance their marketing strategy development and resource distribution through understandingthese variations.The discussionprovesthat organizations can use data-driven insights from proper analysis and visualization to achieve their strategic goals while theiroperationalefficiency and businessgrowth will becomemoresustainable.
TheresearchworkusesMicrosoftExcelandPowerBItoolsto analyzeand visualize e-commerce salesdata. The main goal of the study required transforming the direct transactional data into business insights which would help organizations make better decisions. The research discovered essential patterns and trends from the data through sequential operations which included data collection, data integration, datapreprocessing anddataanalysisanddatavisualization. The analysis showed that sales and profit numbers vary between months because seasonal demand patterns exist. The research identified multiple product sub-categories which contribute to total profit while others showed lower profit results. The customer analysis showed that a small numberofcustomersaccountformostofthetotalsaleswhich
e-ISSN: 2395-0056
Volume: 13 Issue: 04 | Apr 2026 www.irjet.net p-ISSN: 2395-0072
makes customer retention strategies crucial for business success.Thestudyshowedthatcustomersusevariouspayment methodswhichcreateaneedforbusinessestoofferdifferent transaction methods for better customer service. Through Power BI dashboards, users can apply data visualization techniquesto obtainactionableinsightsfromintricateprojects which they can follow through to their end results.Thestudy shows that researchers can use Excel data preprocessing methods together with Power BI visualization tools to conduct effective sales data analysis. Researchers can enhance the dataset by adding customer demographic data and geographic data and market data from outside their organization. The marketing strategies of organizations can benefitfromtheseinsightswhiletheirproductperformancewill increase and their businessgrowth will proceed to the next level. The research study plans to use modern technologies which will enable data expansion to achieve better business intelligence results which will assist with decision-making and sustainable growth activities. Organizations can use advanced visualization tools and techniques to build interactive dashboards which users find easiertonavigateandinteractwith.
7.
1. Clark D 2020 Beginning Microsoft Power BI A Practical GuidetoSelfServiceDataAnalyticsApress.
2.McKinney W 2022 Python for Data Analysis 3rd ed OReilly Media.
3.Provost F FawcettT2023 Data Science forBusiness 2nd edOReillyMedia.
4. Shmueli G Bruce P Gedeck P 2023 Data Mining for BusinessAnalytics4thedWiley.
5. Microsoft Corporation 2024 Power BI Documentation Availableathttpslearnmicrosoftcom.
6. Microsoft Corporation 2024 Excel Data Analysis Tools GuideAvailableathttpslearnmicrosoftcom.
7. Oracle Corporation 2023 SQL Language Reference Availableathttpsdocsoraclecom.
8.Stack Overflow 2024 Developer Discussions on SQL and PowerBIAvailableathttpsstackoverflowcom.
9.Google Cloud 2023 Data Analytics and Visualization Tools Availableathttpscloudgooglecom.
10.Chen H Chiang R H Storey V C 2022 Business Intelligence andAnalyticsFromBigDatatoBigImpactMISQuarterly.
11.Davenport T H Harris JG 2021 Competing on Analytics UpdatedEditionHarvardBusinessReviewPress.
12.Marr B 2023 Data Strategy How to Profit from a World of BigDataKoganPage.
13.KnaflicCN2020StorytellingwithDataWiley.
14. ONeil C 2021 Weapons of Math Destruction Crown Publishing.
15. AggarwalCC2022DataMiningThe TextbookSpringer.
16. IBM Data Science Team 2024 Introduction to Data AnalyticsIBMLearningResources.
17. MicrosoftLearn 2025 PowerBI Data Visualization and DashboardDesignAvailableathttpslearnmicrosoftcom.
18.GoogleAnalyticsAcademy2023AdvancedDataAnalysis.