
International Research Journal of Engineering and Technology (IRJET) e-ISSN: 2395-0056
Volume: 13 Issue: 03 | Mar 2026 www.irjet.net p-ISSN: 2395-0072
International Research Journal of Engineering and Technology (IRJET) e-ISSN: 2395-0056
Volume: 13 Issue: 03 | Mar 2026 www.irjet.net p-ISSN: 2395-0072
Dr.
Bandla Srinivas Rao1 , B.N. Meenakshi2 , A. Sathwika3 , A. Bhavanjali4 , B. Prashanth Reddy5
1 Professor, Department of CSE, Teegala Krishna Reddy Engineering College, Telangana, India
2,3,4,5 B.Tech Students, Department of Computer Science and Engineering, Teegala Krishna Reddy Engineering College, Telangana, India
Abstract - Airpollutionhas becomeoneofthemostcritical environmentalandpublichealthchallengesworldwide.Rapid urbanization, industrialization, and increased vehicular emissionshavesignificantlydeterioratedairquality,affecting millions of people, particularly in densely populated cities. Existing air quality monitoring systems often provide limited spatial coverage, delayed updates, and minimal predictive capabilities, which restrict timely decision-making for both authorities and citizens. To address these limitations, this researchproposesthedevelopmentofanAirQualityVisualizer and Forecast Application that provides granular, real-time, and predictive air quality information through an intelligent data integration and forecasting framework.
The proposed system integrates multiple data sources, including air monitoring stations, meteorological data, and environmental APIs such as OpenAQ and OpenWeatherMap. Pollutant parameters including PM2.5, PM10, NO₂, CO, and O₃ are processed to calculate the Air Quality Index (AQI) according to CPCB standards. A centralized data processing module stores real-time and historical information, enabling trend analysis and visualization through an interactive webbased dashboard. Machine learning and time-series forecasting models, such as ARIMA and Prophet, are used to predictAQIlevelsforthenext24–72hours,allowingusersand authorities to anticipate potential air quality deterioration. The application provides dynamic dashboards displaying pollutant breakdown, historical AQI trends, location-based monitoring, and predictive insights. Additionally, the system generates health recommendations based on AQI severity levels, helping users take preventive measures. By combining real-time monitoring, predictive analytics, and user-friendly visualization, the proposed system enhances environmental awareness and supports data-driven decision making for pollution control and public health planning. The framework also aims to extend air quality coverage to rural and underserved regions, ensuring equitable access to environmental information.
Key Words: Air Quality Index (AQI), Air Pollution Monitoring, Machine Learning, Time Series Forecasting, ARIMA, Prophet, Environmental Data Visualization, Real-Time Monitoring, Predictive Analytics, Public Health.
Air pollution has become one of the most serious environmental and public health challenges worldwide. Rapid industrialization, urban expansion, and increasing vehicular emissions have significantly contributed to the deteriorationofairqualityinmanyregions.Accordingtothe World Health Organization (WHO), air pollution is responsibleformillionsofprematuredeathseveryyearand isconsideredoneoftheleadingenvironmentalhealthrisks globally [1]. Pollutants such as particulate matter (PM2.5 andPM10),nitrogendioxide(NO₂),carbonmonoxide(CO), and ozone (O₃) have severe impacts on respiratory and cardiovascularhealth.
Tomeasureandcommunicateairpollutionlevelseffectively, the Air Quality Index (AQI) has been widely adopted by environmental monitoringagencies.TheCentral Pollution ControlBoard(CPCB)inIndiahasestablishedAQIstandards that classify air quality into different categories such as Good,Moderate,Unhealthy,andHazardous,helpingcitizens understandpollutionlevelsandassociatedhealthrisks[2]. However, traditional monitoring systems often rely on a limited number of regulatory monitoring stations, which leadstosparsespatialcoverageanddelayedupdates.
Modernadvancementsindataanalytics,machinelearning, and environmental sensing technologies have created opportunities to improve air quality monitoring systems. Integrating real-time data from multiple sources such as environmental sensors, meteorological information, and satellite observations can provide more accurate and detailed insights into air pollution patterns. Additionally, predictiveanalyticstechniquesenableforecastingoffuture airqualityconditions,allowingauthoritiesandindividualsto takepreventivemeasures.
Thisresearchproposesthe development ofan Air Quality VisualizerandForecastApplicationthatprovidesgranular, real-time,andpredictiveairqualityinformation.Thesystem integrates environmental datasets from APIs such as OpenAQandOpenWeatherMap,processespollutantdatato calculateAQI,andappliestime-seriesforecastingmodelslike ARIMAandProphettopredictairqualityforthenext24–72 hours. The application also offers interactive dashboards, pollutant breakdowns, historical trends, and health
International Research Journal of Engineering and Technology (IRJET) e-ISSN: 2395-0056
Volume: 13 Issue: 03 | Mar 2026 www.irjet.net p-ISSN: 2395-0072
recommendationstoimprovepublicawarenessandsupport data-drivendecision-making.
Air pollution monitoring has traditionally relied on government-operated monitoring stations equipped with high-precision instruments. These stations measure pollutant concentrations and provide validated environmental data. While these systems offer high accuracy,theirlimitednumberrestrictsthespatialcoverage of monitoring, especially in rural or underserved regions [14]. Consequently, many areas lack real-time air quality information that could help residents understand environmentalconditionsandprotecttheirhealth.
Forecasting air pollution levels plays a critical role in environmental management and public health planning. Predictivemodelsenableauthoritiestoanticipatepollution spikes and implement control strategies such as traffic restrictionsorindustrialregulations.Machinelearningand time-seriesforecastingtechniques,includingARIMAmodels andstatisticalforecastingapproaches,havedemonstrated effectiveness in predicting environmental variables and pollution trends [4][5]. Advanced forecasting frameworks likeProphet,developedforscalabletime-seriesprediction, furtherenhancepredictionaccuracyandreliability[6].
Datavisualizationandintegrationareessentialcomponents of modern environmental monitoring systems. Platforms thatcombinemultipledatasetsand present themthrough intuitive dashboards allow users to easily interpret air quality conditions. Environmental data platforms such as OpenAQprovideopen-accessairqualitydatasetscollected from global monitoringstations[7]. Whencombined with meteorological data from services like OpenWeatherMap, these datasets enable comprehensive environmental analysis and visualization [8]. Interactive dashboards displaying AQI values, pollutant concentrations, and historicaltrendscansignificantlyimprovepublicawareness andencourageinformeddecision-making.
Despitetheavailabilityofairqualitymonitoringplatforms, manyexistingsystemslackreal-timepredictivecapabilities, hyperlocal coverage, and integrated health recommendations.Mostapplicationsprovideonlycurrent AQI information without forecasting future conditions or offeringactionableinsights.Therefore,thereisaneedfora comprehensivesystemthatcombinesreal-timemonitoring, predictive analytics, and user-friendly visualization. The proposed Air Quality Visualizer and Forecast Application addresses these challenges by integrating multiple
environmental data sources, applying machine learningbased forecasting techniques, and presenting information through an interactive dashboard. By providing real-time AQIupdates,pollutantbreakdowns,andpredictiveinsights, the system aims to support environmental monitoring, publichealthawareness,andpolicydecision-making.
TheproposedsystempresentsacomprehensiveAirQuality Visualizer and Forecast Application designed to provide granular,real-time,andpredictiveairqualityinformationfor different geographic locations. The system integrates environmental data from multiple sources, processes pollutantconcentrationstocalculatetheAirQualityIndex (AQI),andappliesmachinelearningtechniquestoforecast futureairqualityconditions.Unlikeconventionalairquality platformsthatprimarilydisplaycurrentpollutionlevels,the proposedsystemcombinesreal-timemonitoring,historical trend analysis, and predictive forecasting within a single web-based platform. This integration enables users, researchers, and policymakers to understand current environmental conditions and anticipate future pollution trendsforimproveddecision-makingandhealthprotection.
The system is structured around several interconnected modules that handle data acquisition, data processing, prediction, visualization, and health advisory generation. Environmentaldatacollectedfrommonitoringstationsand public APIs is stored in a centralized database where it undergoespreprocessingandanalysis.Forecastingmodels such as ARIMA and Prophet analyze historical patterns in pollutantconcentrationsandmeteorological conditions to generate AQI predictions for the next 24–72 hours. The processedresultsarethenpresentedthroughaninteractive dashboard that allows users to monitor air quality conditionsandreceivehealthrecommendations.
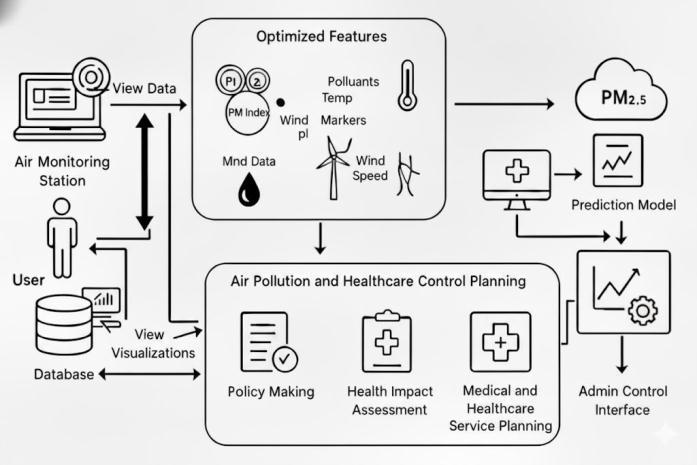
Fig. 1 illustrates the overall system architecture of the proposed Air Quality Visualizer and Forecast System, showing the interaction between data sources, processing modules, prediction models, and user interfaces.
International Research Journal of Engineering and Technology (IRJET) e-ISSN: 2395-0056
Volume: 13 Issue: 03 | Mar 2026 www.irjet.net p-ISSN: 2395-0072
Theproposedsystemcollectsairqualityandenvironmental datafrommultiplereliablesourcestoensureaccurateand comprehensive monitoring. Real-time pollutant measurements are obtained from environmental data platforms such as OpenAQ, which aggregate information from government air monitoring stations. In addition, meteorologicalparametersincludingtemperature,humidity, and wind speed are retrieved from weather data services suchasOpenWeatherMap.
These datasets contain important pollutant indicators including particulate matter (PM2.5 and PM10), nitrogen dioxide(NO₂),carbonmonoxide(CO),andozone(O₃).The integrationofmeteorologicalandpollutantdataenablesthe systemtocaptureenvironmentalconditionsthatinfluence pollutiondispersionandaccumulation.Allcollecteddatais transmittedtoacentralizeddatabasewhereitisstoredfor furtheranalysisandforecasting.
After collecting environmental data, the system performs preprocessing operations to clean and normalize the datasets.Pollutantconcentrationvaluesareconvertedinto standardized Air Quality Index values based on the guidelinesestablishedbytheCentralPollutionControlBoard (CPCB). The AQI calculation module evaluates pollutant concentrations and categorizes air quality into different health-related levels ranging from good to hazardous conditions. The processed AQI values allow the system to present pollution information in a simplified and understandable format. This conversion helps users interpretenvironmental conditions easilyandunderstand potential health risks associated with different pollution levels.
Toprovidepredictiveinsights,theproposedsystememploys time-series forecasting techniques to estimate future air pollution levels. Historical AQI data and environmental parametersareanalyzedusingforecastingmodelssuchas AutoRegressive Integrated Moving Average (ARIMA) and Prophet. These models identify temporal patterns and seasonal trends within the data, enabling the system to generate accurate predictions of air quality conditions for theupcoming24to72hours.
Theforecastingcomponenthelpsusersanticipatepotential pollution spikes and take preventive measures. By incorporating predictive analytics into the monitoring system,theapplicationenhancesenvironmentalawareness andsupportsproactivepublichealthplanning.
Theprocessedandpredicteddataispresentedthroughan interactivewebdashboarddesignedtoprovideintuitiveand informativevisualizations.Thedashboarddisplaysreal-time AQI levels, pollutant concentrations, and historical air quality trends for selected locations. Users can monitor multiple cities simultaneously and observe variations in pollutionlevelsovertime.Graphicalrepresentationssuchas AQItrendchartsandpollutantbreakdownpanelshelpusers understand changes in environmental conditions quickly. The dashboard also supports location-based monitoring, allowinguserstosaveandtrackairqualityinformationfor specificregions.
An important feature of the proposed system is the generation of health recommendations based on AQI severitylevels.Whenpollutionlevelsexceedsafelimits,the systemautomaticallyprovidesprecautionaryguidelinesto help users reduce exposure to harmful pollutants. These recommendationsmayincludereducingoutdooractivities, wearingprotectivemasks,orimprovingindoorventilation.
In addition to supporting public awareness, the insights generated by the system can assist policymakers and environmental authorities in developing pollution control strategiesandhealthcareplanninginitiatives.Bycombining monitoring, forecasting, and health advisory features, the proposed system offers a comprehensive solution for managingairqualityinformation.
TheimplementationoftheproposedAirQualityVisualizer and Forecast Application focuses on developing a reliable systemcapableofcollectingenvironmentaldata,processing pollutantconcentrations,forecastingairqualitylevels,and presentingtheresultsthroughaninteractivewebinterface. The system is implemented using a combination of web technologies,dataprocessinglibraries,andmachinelearning models to ensure efficient data handling and accurate prediction of air quality conditions. The overall implementation process includes data acquisition, data preprocessing, AQI computation, forecasting model integration, and visualization through a user-friendly dashboard.
The first stage of the implementation involves collecting real-timeenvironmentaldatafromreliableexternalsources. AirqualitydataisobtainedthroughenvironmentaldataAPIs suchasOpenAQ,whichaggregatespollutantmeasurements from multiple monitoring stations worldwide. Meteorologicalparametersincludingtemperature,humidity, andwindspeedareretrievedusingtheOpenWeatherMap
International Research Journal of Engineering and Technology (IRJET) e-ISSN: 2395-0056
Volume: 13 Issue: 03 | Mar 2026 www.irjet.net p-ISSN: 2395-0072
API.Theseparametersplayasignificantroleindetermining the dispersion and concentration of air pollutants. The systemperiodicallysendsAPIrequeststoretrieveupdated environmentalinformation.Theretrieveddataisstoredin the system database, ensuring that both real-time and historicalairqualityrecordsareavailableforanalysisand forecasting.
Afterdataacquisition,thecollectedenvironmentaldatasets undergo preprocessing to improve data quality and consistency. This step includes handling missing values, removing inconsistent entries, and normalizing pollutant concentration values. Cleaned data is then stored in a centralized database that supports efficient retrieval for analysisandpredictiontasks.
Thedatabasealsomaintainshistoricalrecordsofpollutant concentrations and meteorological parameters. These historical datasets are essential for identifying pollution trends and training forecasting models used in the predictionmodule.
The AQI calculation module processes pollutant concentrationvaluesandconvertsthemintostandardized AirQualityIndexvaluesaccordingtotheguidelinesprovided by the Central Pollution Control Board (CPCB). Each pollutantcontributestotheoverallAQIvaluebasedonits concentration level and health impact. The module categorizes air quality into different levels such as good, moderate,unhealthy,veryunhealthy,andhazardous.This categorizationallowsuserstoeasilyunderstandtheseverity ofairpollutionandthepotentialhealthrisksassociatedwith differentAQIlevels.

Topredictfutureairqualitylevels,thesystemimplements time-series forecasting models including ARIMA and Prophet. These models analyze historical AQI data and identifytemporalpatterns,seasonaltrends,andvariationsin pollutantconcentrations.Theforecastingmoduleprocesses historicaldataandgeneratespredictionsforthenext24to 72hours.
ThepredictedAQIvaluesenableuserstoanticipatefuture pollution levels and take preventive measures when pollution levels are expected to rise. The integration of
predictive models significantly enhances the system’s capabilitytoprovideproactiveenvironmentalinsights.
Thefinalstageofimplementationfocusesonpresentingthe processed data through an interactive web interface. The application dashboard visualizes real-time AQI levels, pollutant concentrations, and historical air quality trends using graphical representations such as line charts and comparison graphs. The user interface is designed to be intuitive and accessible, enabling users to easily navigate throughdifferentsectionsoftheapplication.Thedashboard also displays predicted AQI values and health recommendations based on pollution severity. This visual representation of environmental data helps users better understand air quality conditions and supports informed decision-making.
TheperformanceoftheproposedAirQualityVisualizerand ForecastApplicationwasevaluatedbyanalyzingitsabilityto collect real-time environmental data, compute Air Quality Index(AQI)values,forecastfutureairqualityconditions,and presenttheresultsthrough aninteractivedashboard.The systemsuccessfullyintegratesdatafromenvironmentalAPIs andprocessespollutantinformationsuchasPM2.5,PM10, NO₂,CO,andO₃togenerateAQIvaluesaccordingtoCPCB standards.Thedevelopedapplicationprovidesuserswitha comprehensiveviewofairpollutionlevels,historicaltrends, andpredictedAQIvalues.
The implementation results demonstrate that the system effectivelyretrievesreal-timeairqualitydataandvisualizes it in a structured format. Users can observe pollutant concentrationlevels,AQIcategories,andhistoricalvariations through graphical representations displayed on the dashboard. In addition, the forecasting models generate short-term predictions of air quality conditions, enabling userstoanticipatefuturepollutionlevels.
Fig.2showsthemaindashboardinterfaceoftheAirQuality Visualizer application, where users can monitor real-time AQIvalues,pollutantconcentrations,andairqualitystatus for selected locations. The dashboard presents environmentalinformationinaneasilyinterpretableformat, allowing users to quickly understand current pollution conditions.
International Research Journal of Engineering and Technology (IRJET) e-ISSN: 2395-0056
Volume: 13 Issue: 03 | Mar 2026 www.irjet.net p-ISSN: 2395-0072
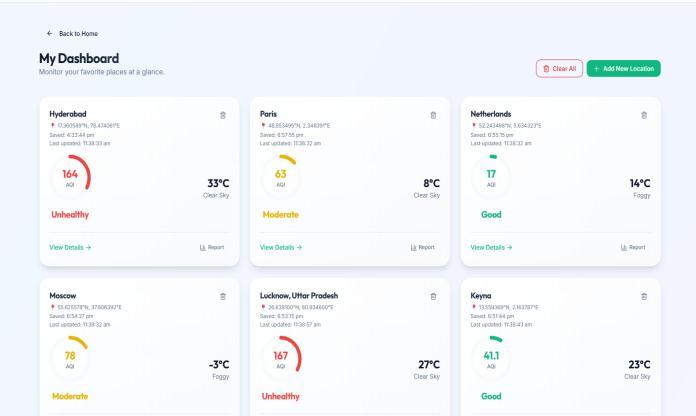
Thedashboardvisualizationprovidesaclearrepresentation ofpollutionlevelsandsupportslocation-basedmonitoring. Bydisplaying real-time environmental data alongsideAQI categories,thesystemhelpsusersassesspollutionseverity andidentifypotentialhealthrisksassociatedwithpoorair quality.
Theforecastingcomponentofthesystemanalyzeshistorical AQI data and generates predictive results for upcoming hours or days. The prediction module evaluates pollutant trendsandmeteorologicalconditionstoestimatefutureAQI values. These predictions allow users and authorities to anticipatepollutionspikesandtakepreventiveactions.
Fig.3illustratestheAQItrendvisualizationandprediction results generated by the forecasting module. The graph displayshistoricalAQIdataalongwithpredictedairquality levels, enabling users to analyze pollution trends and understandexpectedchangesinenvironmentalconditions.
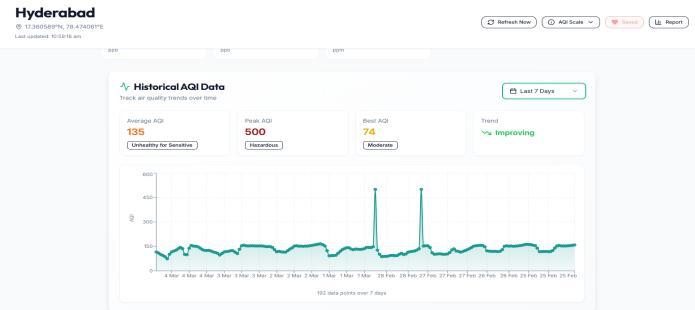
Theexperimentalresultsindicatethatintegratingreal-time monitoring with machine learning-based forecasting significantlyimprovestheusabilityofairqualitymonitoring systems.Theproposedsystemsuccessfullyprovidesdetailed environmental insights, predictive analysis, and healthrelated recommendations, making it a valuable tool for environmental awareness and public health protection. Overall, the results confirm that the developed system effectively combines data acquisition, AQI computation,
forecastingmodels,andvisualizationtechniquestodeliver accurate and user-friendly air quality information. The application demonstrates the potential of intelligent environmentalmonitoringsystemsinsupportingpollution control strategies and promoting sustainable urban development.
Airpollutionhasbecomeacriticalenvironmentalandpublic health issue that requires effective monitoring and timely decision-making. The proposed Air Quality Visualizer and Forecast Application was developed to provide granular, real-time,andpredictiveairqualityinformationthroughan integrateddata-drivenframework.Thesystemsuccessfully combines environmental data from multiple sources, including air quality monitoring APIs and meteorological services,togenerateaccurateAirQualityIndex(AQI)values and visualize pollution conditions through an interactive web-baseddashboard.
The implementation of the system demonstrates that integratingreal-timemonitoringwithmachinelearningand time-seriesforecastingtechniquescansignificantlyimprove the accessibility and usefulness of air quality information. Forecasting models such as ARIMA and Prophet analyze historicalenvironmentaldatatopredictfutureAQIlevelsfor the next 24 to 72 hours, enabling users to anticipate pollution trends and take precautionary measures in advance.Thedashboardvisualizationfurtherenhancesuser understandingbypresentingpollutantconcentrations,AQI categories,andhistoricaltrendsinanintuitiveformat.
In addition to monitoring and prediction, the system also provides health recommendations based on AQI severity levels. This feature helps individuals reduce exposure to harmful pollutants and supports public awareness about environmental health risks. By combining real-time monitoring, predictive analytics, and health advisory capabilities, the proposed system offers a comprehensive solutionforimprovingairqualityawarenessandsupporting environmentaldecision-making.
Overall, the developed application demonstrates the potentialofintelligentenvironmentalmonitoringsystemsin addressing the challenges of air pollution. The proposed frameworkcanassistpolicymakers,researchers,andcitizens in understanding pollution patterns, predicting environmental changes, and implementing strategies to improveairqualityandprotectpublichealth.
AlthoughtheproposedAirQualityVisualizerandForecast Application successfully provides real-time monitoring, visualization, and short-term prediction of air pollution levels, several improvements can be made to enhance the system’s capabilities in the future. The current system
International Research Journal of Engineering and Technology (IRJET) e-ISSN: 2395-0056
Volume: 13 Issue: 03 | Mar 2026 www.irjet.net p-ISSN: 2395-0072
focusesonintegratingenvironmentalAPIsandforecasting AQI values using time-series models; however, additional technologies and data sources can further improve predictionaccuracyandsystemfunctionality.Infuturework, thesystemcanbeextendedbyincorporatingadvanceddeep learningmodelssuchasLongShort-TermMemory(LSTM) and Recurrent Neural Networks (RNN), which are highly effectiveforanalyzingsequentialandtime-seriesdata.These modelscanimprovetheaccuracyofairqualityforecasting by capturing complex temporal patterns and long-term dependenciesinenvironmentaldatasets.
AnotherpossibleenhancementistheintegrationofsatellitebasedenvironmentalmonitoringdataandInternetofThings (IoT)sensornetworks.Bycombiningsatelliteobservations with ground-based sensors, the system can provide more preciseandhyperlocalairqualityinformation,particularly for rural and underserved regions where monitoring stationsarelimited.Theapplicationcanalsobeexpanded intoamobileplatformtoimproveaccessibilityandusability forawiderrangeofusers.Amobileapplicationwithpush notificationscouldalertuserswhenpollutionlevelsexceed safe thresholds, allowing individuals to take immediate precautionarymeasures.Inaddition,futureversionsofthe systemcouldincorporatepollutionsourceidentificationand mappingtechniquestodeterminethemajorcontributorsto air pollution in specific areas. This feature would help environmental authorities and policymakers develop targetedpollutioncontrolstrategies.
Finally, integrating advanced visualization tools and geographicinformationsystems(GIS)canfurtherenhance spatial analysis and allow users to explore air quality patterns across different regions. These improvements would make the system more effective in supporting environmental monitoring, public awareness, and sustainableurbanplanning.
[1] World Health Organization, Air Pollution and Health, WHOReport,Geneva,Switzerland,2023.
[2] Central Pollution Control Board (CPCB), National Air QualityIndex,MinistryofEnvironment,ForestandClimate Change,GovernmentofIndia,2014.
[3] J. Zhang and K. Smith, “Indoor air pollution: a global healthconcern,”BritishMedicalBulletin,vol.68,no.1,pp. 209–225,2019.
[4]S.ArunrajandP.Ahrens,“AhybridARIMAandartificial neural network model for air quality forecasting,” AtmosphericEnvironment,vol.80,pp.545–556,2013.
[5] R. Hyndman and G. Athanasopoulos, Forecasting: PrinciplesandPractice,3rded.,OTexts,Australia,2021.
[6] S. Taylor and B. Letham, “Forecasting at scale,” The American Statistician, vol. 72, no. 1, pp. 37–45, 2018. (FacebookProphetmodel)
[7] OpenAQ, “Open Air Quality Data Platform,” Available: https://openaq.org
[8] OpenWeatherMap API Documentation, Available: https://openweathermap.org/api
[9] D. C. Montgomery, C. L. Jennings, and M. Kulahci, IntroductiontoTimeSeriesAnalysisandForecasting,Wiley, 2015.
[10]M.Chen,Y.Tang,andL.Li,“Airqualitypredictionusing machinelearning algorithms,” Environmental Science and PollutionResearch,vol.27,pp.134–145,2020.
[11] K. Zhang, Y. Zheng, and L. Qi, “Deep spatio-temporal residual networks for citywide crowd flows prediction,” IEEETransactionsonKnowledgeandDataEngineering,vol. 29,no.8,pp.1616–1628,2017.
[12]UnitedStatesEnvironmentalProtectionAgency(EPA), Air Quality Index: A Guide to Air Quality and Your Health, 2022.
[13]Y.Zheng,F.Liu,andH.Hsieh,“U-Air:Whenurbanair qualityinferencemeetsbigdata,”inProceedingsofthe19th ACMSIGKDDConferenceonKnowledgeDiscoveryandData Mining,Chicago,USA,2013.
[14]P.Kumar,L.Morawska,andC.Martani,“Theriseoflowcost sensing for managing air pollution in cities,” EnvironmentInternational,vol.75,pp.199–205,2015.
[15]S.Gupta,A.Kumar,andR.Sharma,“Machinelearning based air pollution prediction and monitoring system,” International Journal of Environmental Science and Technology,vol.18,pp.2785–2796,2021.
[16] Geetha L S, Prof. Ts. Dr. Yousef A.Baker El-Ebiary, Dr BandlaSrinivasaRao,Dr.RevatiRamraoRautrao,TSubha Mastan Rao, Janjhyam Venkata Naga Ramesh, Omaia AlOmari, “Challenges and Solutions in Agile Software Development:AManagerialPerspectiveonImplementation Practices” , International Journal of Advanced Computer ScienceandApplications(IJACSA),Vol.16,No.3,2025.