
International Research Journal of Engineering and Technology (IRJET) e-ISSN: 2395-0056

International Research Journal of Engineering and Technology (IRJET) e-ISSN: 2395-0056
Aboli Sontakke¹, Sayali Suradkar², Sanskruti Tirvir³, Isha Save´, Prof. Shriya Mundheµ
¹²³´ Student, Dept. of Computer Engineering, Pimpri Chinchwad College of Engineering, Pune, India
µ Professor, Dept. of Computer Engineering, Pimpri Chinchwad College of Engineering, Pune, India
Abstract
The rapid growth of digital technologies has transformed communication, accessibility, and information sharing. Web-based assistive tools such as image-to-text conversion, speech transcription, text-to-speech systems, and content highlighting enable individuals with visual, auditory, or cognitive challenges to engage effectively, promoting digital inclusion. While their social benefits are well recognized, the environmental impact of these technologies is often overlooked. Every digital interaction consumescomputationalresourcesthatrequireelectricity, generating carbon emissions depending on the energy source.
This study evaluates the carbon footprint of web-based assistive applications using a framework that estimates emissions based on the execution time of various assistive modules.Energyconsumptionismonitoredinrealtime using average power metrics, and carbon emissions are calculated according to standard grid intensity values. A centralized dashboard tracks and visualizes emissions for each module, enhancing transparency and environmental awareness.
Experimental results indicate that computationally intensive tasks, such as optical character recognition and live transcription, produce higher emissions than lighter text processing tasks. A clear correlation is observed between task duration and carbon output, validating the time-based estimation approach. Even brief digital operations generate measurable emissions, which can accumulate significantly when multiple modules run consecutively. This research highlights the importance of incorporating carbon-awareness into software design, supporting environmentally responsible and sustainable developmentofdigitalsystems.
Key Words: Digital Carbon Footprint, Green Computing, Web-Based Assistive Technologies, Carbon Emission Estimation, Energy Modeling, Sustainable Software Engineering.
Volume: 13 Issue: 03 | Mar 2026 www.irjet.net p-ISSN: 2395-0072 © 2026, IRJET | Impact Factor value: 8.315 | ISO 9001:2008 Certified Journal | Page1882
The rapid growth of digital technologies has changed nearly every part of modern life, including communication,education,healthcare,andaccessibility. Web-based assistive technologies like image-to-text converters, text-to-speech systems, live transcription tools,andvisualcontentreadershavegreatlyimproved digital inclusivity. These applications help people with visual, auditory, and cognitive challenges participate moreeffectivelyinthedigitalworld.Asdigital
accessibility keeps evolving, more users are depending ontheseassistiveplatforms.however,theenvironmental impactofthesedigitalsystemsisrarelydiscussed.Every digitalaction,whetherloadingawebpage,processingan image, running a speech model, or converting text, uses computational resources. These tasks require electricity forprocessing power,memory, storage, and network communication. The electricity that computing devices usecomesfrom energysourcesthatmayreleasecarbon emissions,dependingonthelocalenergymix.Thus,even software-based actions indirectly contribute to global greenhousegasemissions.
The idea of a digital carbon footprint refers to the total greenhouse gas emissions created by digital activities and online systems. While there has been considerable research on large-scale data centers and cloud systems, less attention has been paid to carbon emissions at the application level. Web- based tools run on personal devicesalsousesignificantamountsofenergy,especially when they perform demanding tasks like optical character recognition, real-time speech processing, or dynamic content rendering. When considered across thousands or millions of users, these seemingly small emissions can add up to a substantial environmental impact.
International Research Journal of Engineering and Technology (IRJET) e-ISSN: 2395-0056
Volume: 13 Issue: 03 | Mar 2026 www.irjet.net p-ISSN: 2395-0072
As awareness of climate change and sustainable developmentincreases,researchersarelookingintothe environmental impact of digital technologies. Several studies have focused on measuring energy use and carbon emissions linked to computing systems, data centers,andinternetinfrastructure.However,analyzing the carbon footprint at the application level is still a developingareaofresearch.
Early research in green computing mainly focused on energy- efficienthardwareandoptimizingdatacenters. Studies on cloud computing environments emphasized thehighenergydemandoflargeserverinfrastructures. They suggested techniques like virtualization and load balancing to lower energy use. This work laid the groundwork for understanding the environmental cost ofdigitalservices.
Later research shifted toward software-level energy profiling. Researchers showed that inefficient algorithms, too many background processes, and unoptimized web scripts lead to extra energy use. Energy-aware programming techniques were introduced to reduce processor use and lower power draw. These studies highlighted how software design choicesdirectlyaffectenergyconsumption.
Recently, web sustainability has attracted attention as internetusecontinuestoriseglobally.Researchershave analyzedthecarbonfootprintofwebsitesbasedonpage size, data transfer volume, and hosting infrastructure. Studies found that media- heavy websites with large scripts, images, and third-party integrations consume more energy when loading and rendering. Tools and frameworks were created to estimatewebsite carbonemissionsbycombiningdata transfer metrics with average grid carbon intensity values.
Other research efforts have focused on estimating carbon emissions using execution-time models. These models calculate energy consumption by multiplying processing time by average device power ratings. Carbon emissions are then derived by applying regional carbon intensity factors. Such methods allow for practical estimation without needing special hardwaresensors.
Whiletheexistingliteratureoffersvaluableinsightsinto digital sustainability, there is limited research on
assistive web technologies. Most studies focus on large systems or static website analysis instead of dynamic, computation-intensive assistive modules like optical characterrecognition,speechprocessing,andreal-time
In recent years, sustainability has become a major focus in engineering. However, sustainable software development is still a developing area of research. Developers often prioritize speed and usability, but environmental efficiency is rarely taken into account during design and implementation. There is a growing need to build carbon awareness directly into digital platforms so that both users and developers can better understandtheenvironmentalcostoftheiractivities.
Thisresearchaimstofillthisgapbyproposingacarbon footprintestimationframeworkforweb-basedassistive technologies. The proposed model calculates energy consumption based on execution time and estimated system power usage. Carbon emissions are then calculated using standard grid carbon intensity values. Theframeworkworksacrossmultipleassistivemodules, allowingforbothindividualemission measurement and overalltrackingthroughacentralizeddashboard.
The main goal of this study is to measure the environmental impact of commonly used assistive web applications and raise awareness of sustainable computing practices. By showing that digital accessibility tools also produce measurable carbon emissions, this research encourages the adoption of greener software design principles and responsible digitaluse.
The proposed system estimates carbon emissions generated by web-based assistive technologies using an execution-time-based energy modeling approach. Instead of relying on external hardware sensors or server-level monitoring tools, the framework calculates emissionsdirectlywithintheapplicationduringruntime. Foreachassistivemodule(suchasimage-to-text,speech transcription, or text-to-speech), the execution duration ismeasuredusingahigh-resolutiontimer.Thestarttime is recorded before the computational task begins, and the end time is captured after the task completes. The difference between these timestamps represents the processingduration.
Energy consumption is estimated by multiplying the execution duration by the assumed average system power consumption. This provides an approximation of
International Research Journal of Engineering and Technology (IRJET) e-ISSN: 2395-0056
Volume: 13 Issue: 03 | Mar 2026 www.irjet.net p-ISSN: 2395-0072
theelectricalenergyconsumedduringtaskexecution.
The carbon emission is then calculated by applying a carbon intensity factor, which represents the amount of carbon dioxide emitted per kilowatt-hour (kWh) of electricity generated. This approach allows lightweight, real-time estimation without complex hardware integration.
3.2 Mathematical Formulation
The carbon estimation process follows the equations below:
1. Energy Consumption Calculation
Where:
Power is the estimated system power consumptioninwatts
Timeistheexecutiondurationinseconds
2. Carbon Emission Calculation ( )
In this research, a standard average carbon intensity value is used to represent grid emissions. The final emission value is displayed in grams for better interpretabilityatsmallscales.
3.3 Cumulative Emission Tracking
Thetotalcumulativecarbonemissiongeneratedduringa sessioniscalculatedasthesummationofemissionsfrom allexecutedassistivemodules:
Tot CO ∑
Where representsthecarbonemission(ingrams) generatedbythe i-th moduleexecution,and denotesthetotalnumberofmoduleexecutionsduring thesession.
Since each module emission is derived from its corresponding energy consumption, it can be expressed as: where istheenergyconsumedbythe i-th module(inkWh), and isthec rbonintensityf ctor(gCO₂/kWh). Substitutingintothecumulativeequation: Tot CO ∑
Further, energy consumption for each module is calculatedusing: where istheaveragesystempowerconsumption(inWatts), and istheexecutiontimeofthe i-th module(inhours). Therefore,thefinalcumulativecarbonemissionformula becomes:
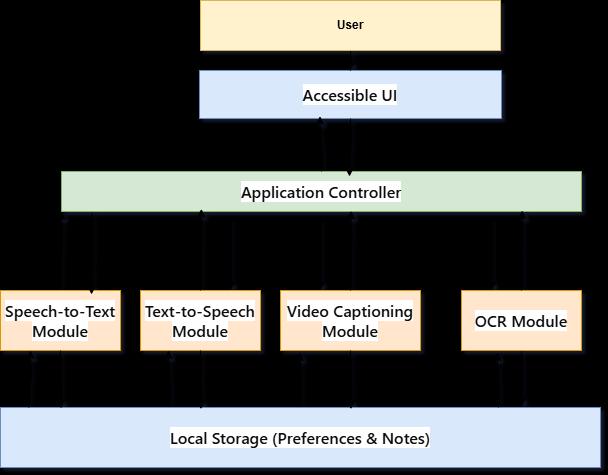
Fig: Architecture Diagram
Thesystemarchitectureconsistsofthreeprimary components:
1. Assistive Modules
Independentweb-basedtoolssuchasimage-totextconversion,speechtranscription,andtextto-speechprocessing.
2. Carbon Monitoring Service Acentralizedservicethat:
Receivesexecutiondurationfrom modules
Calculatesenergyconsumption
2026, IRJET | Impact Factor value: 8.315 | ISO 9001:2008
International Research Journal of Engineering and Technology (IRJET) e-ISSN: 2395-0056 Volume: 13 Issue: 03 | Mar 2026 www.irjet.net
Computescarbonemissions
Maintainscumulativetotals
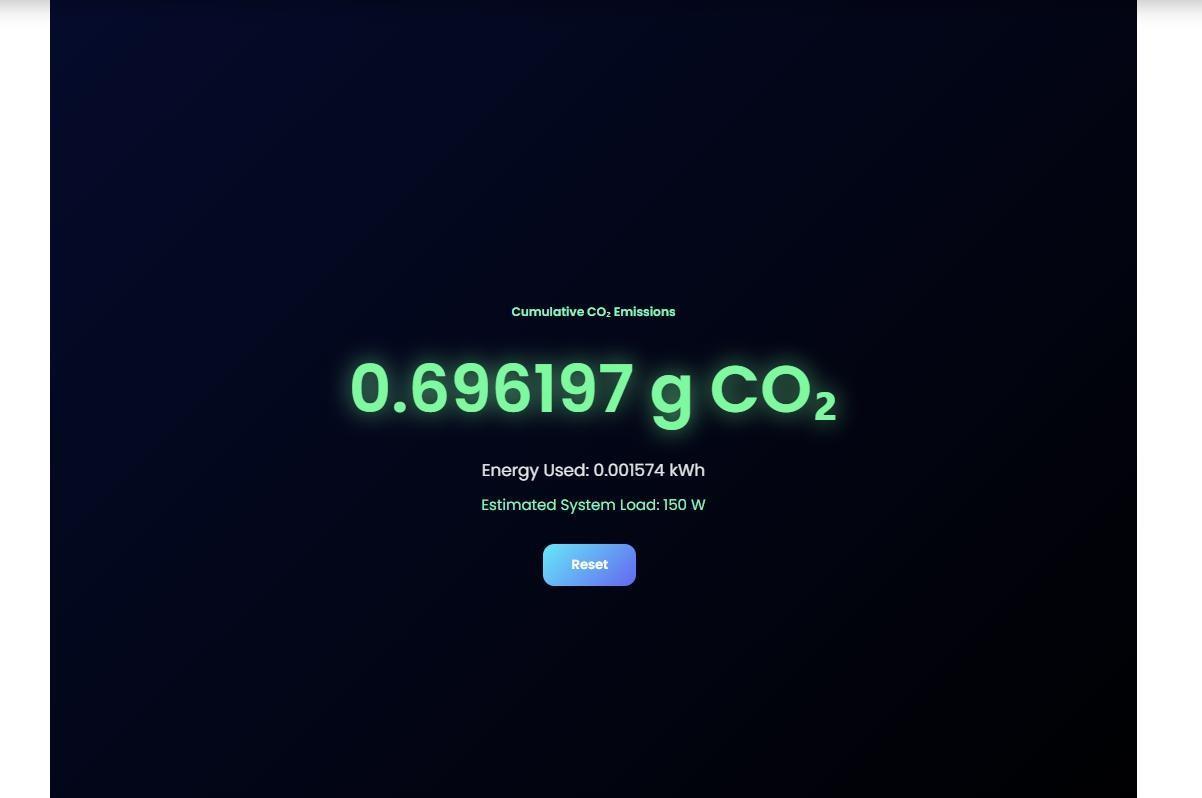
3. Carbon Dashboard Avisualizationinterfacethatdisplays:
Cumu tiveCO₂emissions
Totalenergyconsumption
Estimatedsystemload
Each module sends its execution duration to the carbon monitoring service, ensuring consistent and centralized emissioncalculationsacrosstheapplication.
4. Assumptions
Since direct hardware-level power monitoring is not implemented,thefollowingassumptionsaremade:
4.1 The system operates at an average power consumption of approximately 150 W during activeprocessing
4.2 A constant grid carbon intensity value is usedforemissioncalculations.
4.3 Network-related emissions and server-side cloud processing are not separately measured.
4.4 The estimation focuses on client-side computationalenergyconsumption.
These assumptions provide a simplified yet practical estimation model suitable for application-level carbon tracking.
5. RESULTS AND DISCUSSION
Thissectionpresentstheemissionvaluesobtainedfrom different assistive modules and analyses their environmental impact. The goal is not only to report numerical results but also to interpret their significance intermsofsustainablecomputing.
5.1 Individual Module Emissions
Each assistive module was executed independently, and carbon emissions were calculated based on execution duration.
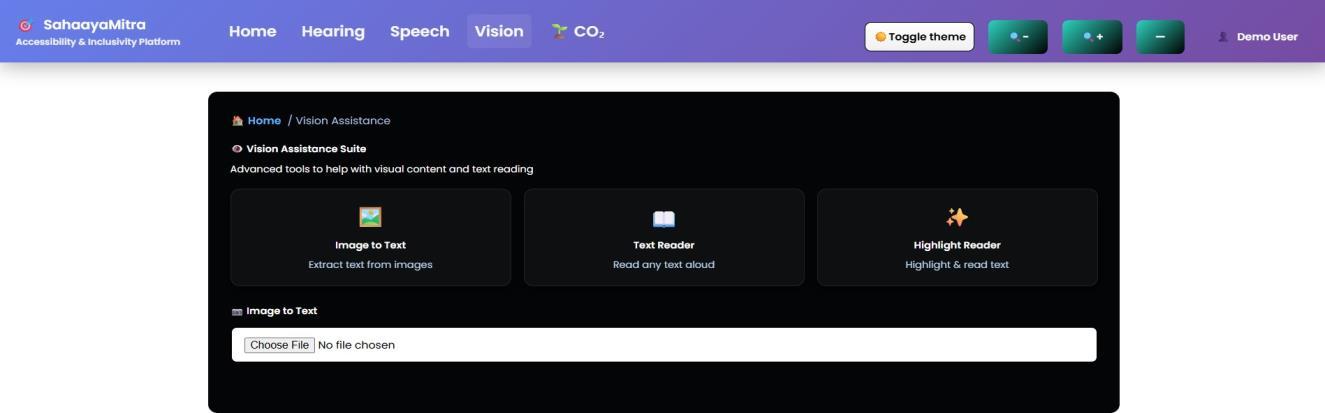
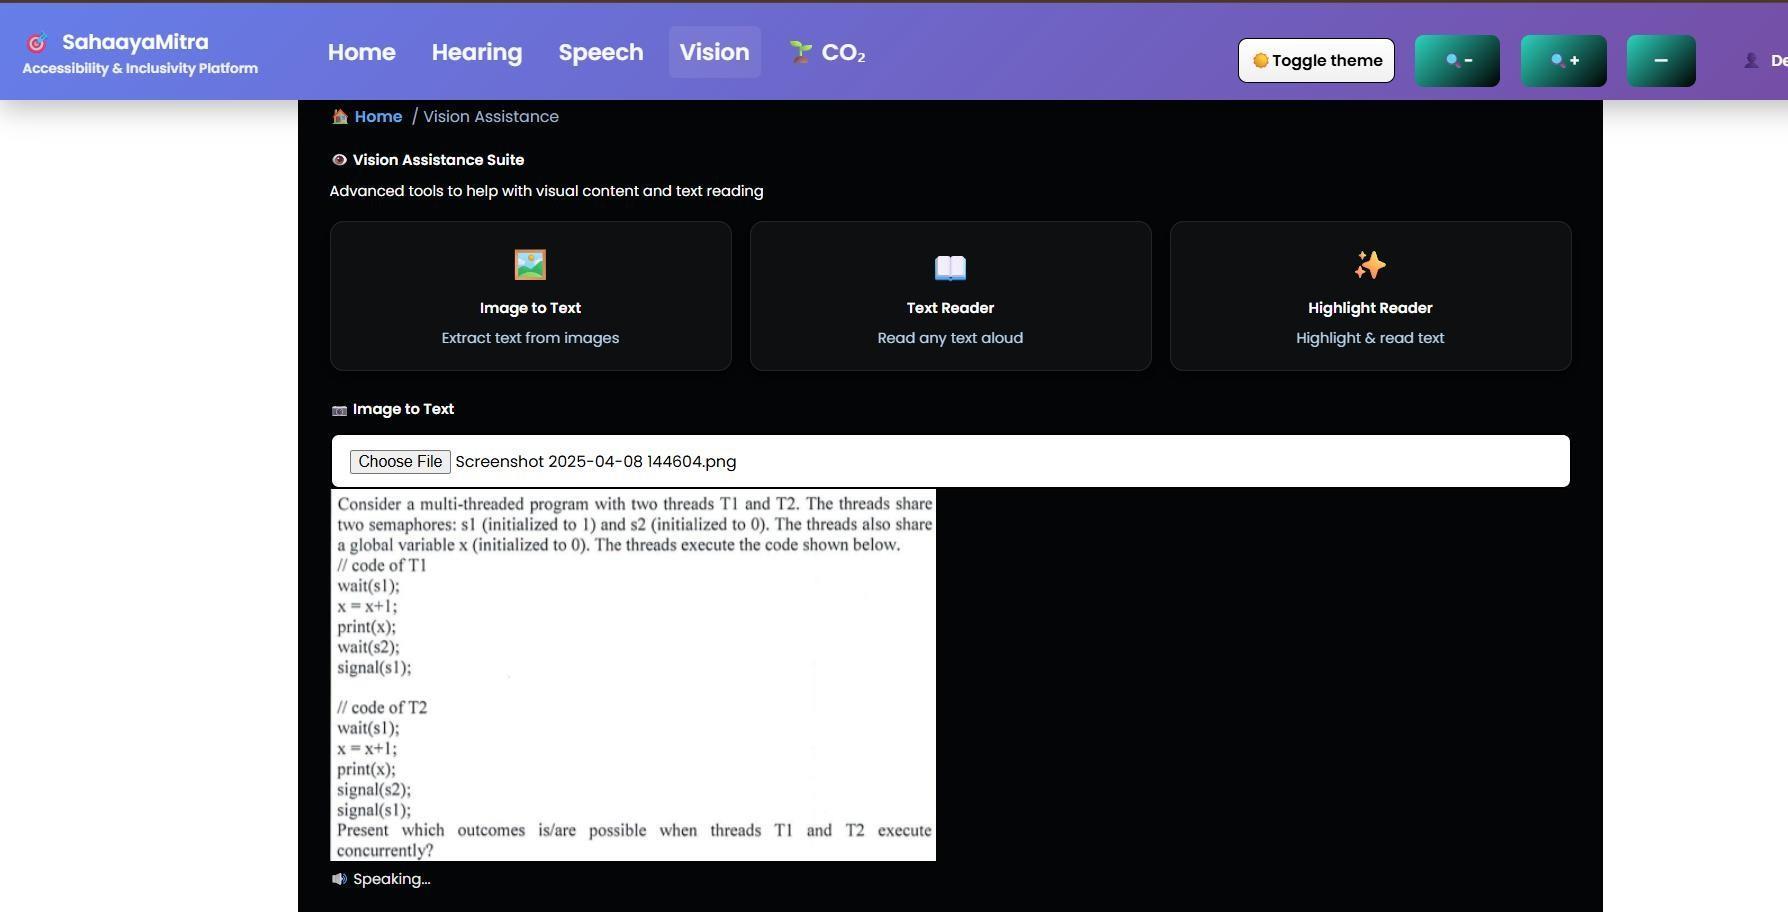
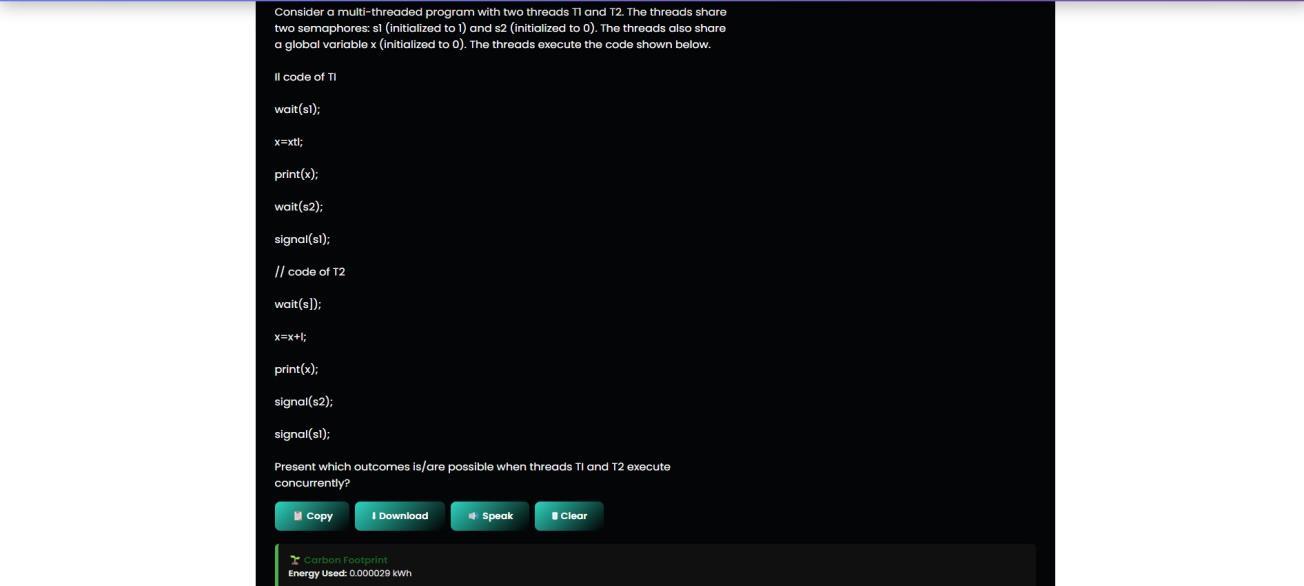
5.1.1 Image-to-Text Module
EnergyUsed:0.000015kWh
CO₂Emission:0.006488gr ms
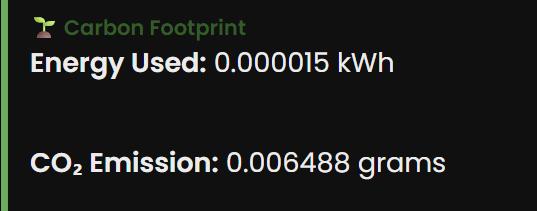
The image-to-text module involves optical character recognition processing, which requires image decoding, text extraction, and rendering. The processing duration directly influenced energy consumption and emission output.
Similarly, other modules such as speech transcription and text-to-speech conversion generated emissions proportional to their execution time and computational complexity.
These results confirm that even short-duration computational tasks generate measurable carbon emissions.
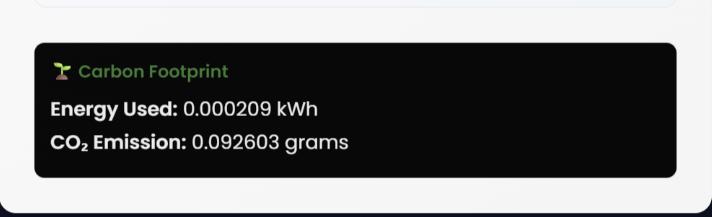
The speech transcription module performs real-time audio capture and converts speech signals into textual data using browser-based recognition engines. This process requires continuous audio sampling, signal processing, and text generation. Compared to static tasks, real-time processing leads to higher processor engagement, resulting in comparatively increased energyconsumptionandcarbonemissions.Theemission values observed confirm that continuous processing tasks contribute more significantly to digital carbon footprint.
Furthermore, this framework encourages future improvementssuchas:
Dynamic power estimation instead of fixed powerassumptions
Regionalcarbonintensityadaptation
Cloud-sideemissionmonitoring
Overall, the findings highlight the importance of embeddingsustainabilityconsiderationswithinsoftware developmentpractices.
International Research Journal of Engineering and Technology (IRJET) e-ISSN: 2395-0056 Volume: 13 Issue: 03 | Mar 2026 www.irjet.net
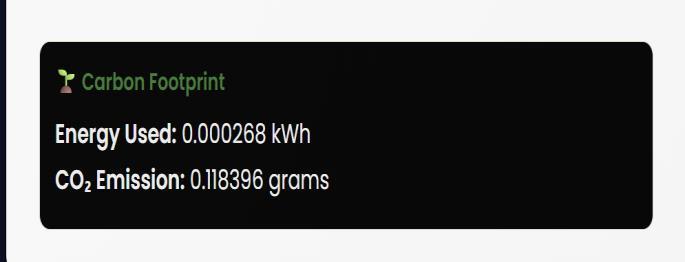
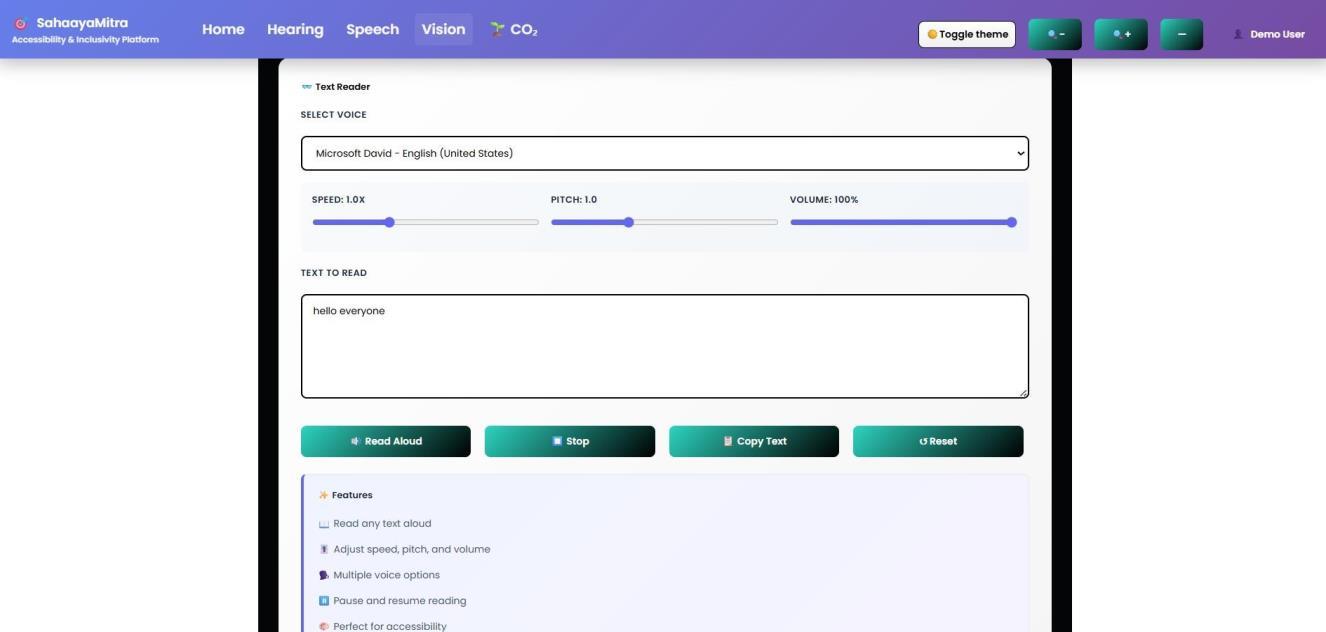
The text-to-speech module converts written input into synthesized speech output. This involves text parsing, phoneme generation, and audio waveform synthesis. Although less computation-intensive than real-time transcription,theaudiogenerationprocessstillrequires measurable processing power. The recorded emissions indicate moderate energy consumption proportional to thelengthoftheinputtextanddurationofplayback.
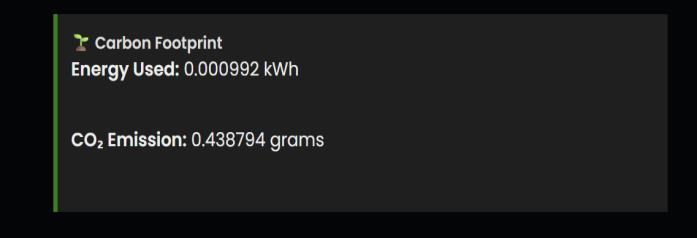
The highlight reader module performs lightweight text processing operations such as content selection, rendering, and visual highlighting. Since this task does not involve heavy signal processing or image decoding, the computational load remains relatively low. Consequently, the observed carbon emissions were minimal compared to OCR and speech-based modules. This demonstrates how algorithmic complexity directly influencesenvironmentalimpact.

The live speech transcription module performs continuousreal-timeaudiocaptureandconvertsspoken input into textual output. Unlike static modules that processafixedinput,thisfeaturerequiresongoingaudio sampling, signal buffering, speech recognition processing,anddynamictextrendering. Becausethe moduleoperatesinreal time,theprocessor remains actively engaged throughout the duration of speechinput.Thissustainedcomputationalactivityleads to higher energy consumption compared to shortduration tasks such as text highlighting or simple renderingoperations.
Theemissionvaluesobservedforlivetranscriptionwere comparatively higher than lightweight modules,
primarilydueto:
Continuousmicrophoneinputprocessing
Real-timespeech-to-textconversion
Backgroundrecognitionengineactivation
Dynamictextupdating
These findings indicate that real-time assistive technologies contribute more significantly to digital carbonfootprintthanstaticorsingle-executiontasks.
When multiple assistive modules were executed sequentially,thecentralizedcarbondashboarddisplayed thefollowingcumulativesession-levelvalues:
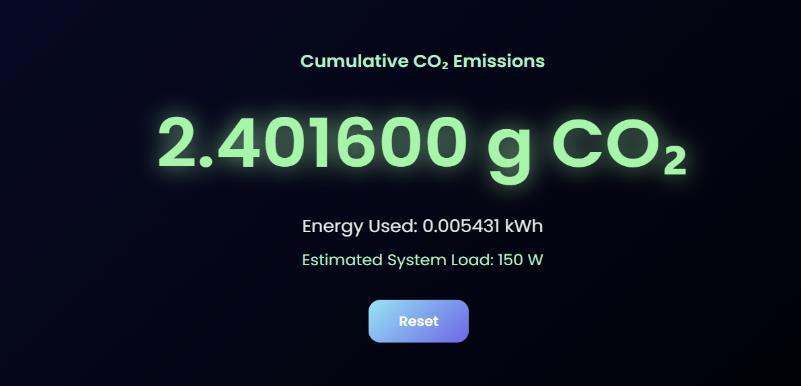
The cumulative emission values are noticeably higher than those observed for individual modules. This difference occurs because the dashboard aggregates emissions from all executed modules during the session ratherthandisplayingisolatedtask-levelmeasurements. Unlike individual module outputs, which represent emissions for a single computational event, the dashboard continuously sums emissions generated across multiple interactions. As a result, the cumulative values provide a more realistic representation of the totalenvironmentalimpactduringpracticalusage. It is also important to note that even if a user actively interacts with only one visible module, background processes, previously executed modules, or prolonged sessionactivitymaycontributetotheoverallcumulative totalunlessthesystemisexplicitlyreset.Thishighlights how digital systems can continue consuming energy beyondimmediatevisibleinteractions.
The cumulative emission value of 2.401600g CO₂ demonstrates that while individual module
International Research Journal of Engineering and Technology (IRJET) e-ISSN: 2395-0056
Volume: 13 Issue: 03 | Mar 2026 www.irjet.net p-ISSN: 2395-0072
emissionsmayappear negligible, repeated orsequential usagesignificantlyincreasestotalenvironmentalimpact. This reinforces the importance of session-level monitoring rather than focusing solely on isolated executionevents.
Furthermore, the dashboard-based aggregation approachprovides:
Better transparency of total digital energy consumption
Improvedsustainabilityawarenessforusers
A measurable way to evaluate optimization strategies
Overall, cumulative tracking offers a broader sustainability perspective by capturing the combined environmental effect of multiple assistive operations withinasingleusersession.
Based on the experimental observations, several meaningful insights were derived regarding the environmentalbehaviorofdifferentassistivemodules.
First, modules involving continuous or real-time processing, such as live transcription, generated comparatively higher carbon emissions than shortduration static tasks. This is primarily due to sustained processor utilization during continuous audio capture, speech recognition, and dynamic text rendering. In contrast,lightweightoperationssuchastexthighlighting or brief content processing required minimal computational engagement and therefore resulted in loweremissions.
Second, a direct proportional relationship was observed between execution time and energy consumption. As execution duration increased, energy usage increased correspondingy, e ding to higher c cu ted CO₂ emissions. This confirms the validity of the executiontime-basedestimationmodelusedinthisresearch.
Third, cumulative tracking provided a more comprehensive representation of environmental impact compared to isolated module measurements. While individual emission values appeared relatively small, session-level aggregation revealed a measurable carbon footprint. This demonstrates that sustainability analysis must consider repeated and prolonged interactions ratherthansinglecomputationalevents. Finally, although emission values were recorded in grams and may seem negligible at the individual level, large-scale deployment across thousands or millions of users could significantly amplify the overall environmental footprint. Therefore, even minor efficiency improvements at the application level can havemeaningfulimpactwhenscaled.
The results demonstrate that web-based assistive technologies, while socially beneficial and essential for digitalinclusivity,arenotenvironmentallyneutral.Every computational process whether image decoding, speechprocessing,ortextrendering requireselectrical energy,whichindirectlycontributestocarbonemissions dependingontheenergysource.
However, it is important to contextualize the findings. The measured emissions per session remain relatively small, indicating that assistive technologies do not pose high immediate environmental risk at the individual level. The primary contribution of this study lies not in highlighting excessive emissions, but in revealing their existenceandmakingthemmeasurable.
By integrating carbon estimation directly within assistive applications, this research introduces environmental awareness into the software development lifecycle. Developers are encouraged to consider algorithmic efficiency, execution duration, and processing optimization as sustainability factors alongsideperformanceandusability.
Furthermore, the study demonstrates that transparency plays a key role in sustainable computing. When users canvisualizecumulativeemissionsthroughadashboard, they gain a clearer understanding of the environmental impact of their digital interactions. Such awarenessdrivensystemscanpromote responsibleusagebehavior andencouragegreenersoftwaredesignpractices.
In summary, the findings reinforce the need to incorporate sustainability metrics into application-level design,particularlyasdigitalaccessibilitytoolscontinue toexpandglobally.
Sustainability in computing has become increasingly important as digital technologies expand globally. While assistive technologies enhance accessibility and social inclusion, it is equally essential to ensure that these digital solutions align with environmental sustainability goals. The proposed carbon footprint monitoring framework contributes to this objective by promoting awarenessofenergy-efficientdigitalpractices.
This research directly supports the following United NationsSustainableDevelopmentGoals(SDGs):
By estimating the energy consumption of web-based applications, the system highlights the importance of efficient energy usage in digital platforms. Encouraging optimized software design helps reduce unnecessary powerconsumption,therebycontributingtoresponsible energyutilization.
International Research Journal of Engineering and Technology (IRJET) e-ISSN: 2395-0056
Volume: 13 Issue: 03 | Mar 2026 www.irjet.net
The integration of carbon monitoring into assistive technologies promotes sustainable innovation in software engineering. Instead of focusing solely on performance and usability, this research introduces environmental impact as an additional design parameter. Such an approach strengthens sustainable digitalinfrastructuredevelopment.
Digital resources, including computational power and electricity,areformsofconsumption.Bymakingcarbon emissionsvisibletousers,thesystemfostersresponsible digital usage behavior. Awareness-driven systems can
reduce redundant processing and encourage efficient applicationinteraction.
Althoughindividualemissionsfromwebapplicationsare relatively small, their cumulative global impact can be significant. Monitoring and minimizing digital carbon footprints support broader climate action initiatives by reducing indirect greenhouse gas emissions associated withelectricitygeneration.
Overall, this research bridges the gap between digital accessibility and environmental sustainability. It demonstrates that socially beneficial technologies can alsobedesignedwithecologicalresponsibilityinmins.

International Research Journal of Engineering and Technology (IRJET) e-ISSN: 2395-0056
Volume: 13 Issue: 03 | Mar 2026 www.irjet.net p-ISSN: 2395-0072

International Research Journal of Engineering and Technology (IRJET) e-ISSN: 2395-0056
Volume: 13 Issue: 03 | Mar 2026 www.irjet.net p-ISSN: 2395-0072
International Research Journal of Engineering and Technology (IRJET) e-ISSN: 2395-0056
Volume: 13 Issue: 03 | Mar 2026 www.irjet.net

International Research Journal of Engineering and Technology (IRJET) e-ISSN: 2395-0056
Volume: 13 Issue: 03 | Mar 2026 www.irjet.net p-ISSN: 2395-0072
This research presented a digital carbon footprint analysis framework for web-based assistive technologies. While such technologies significantly improve accessibility and inclusivity, their environmental impact is often overlooked. The proposed system integrates a lightweight carbon estimation model directlyintotheapplication, enabling real- time monitoring of energy consumption nd CO₂ emissions.
By measuring execution time and applying power and carbonintensityassumptions,theframework estimates both individual module emissions and cumulative session-level impact. Experimental results demonstrated that even short computational tasks generate measurable carbon emissions. Although the values appear small at an individual level, large- scale usageacrossusersandplatformscanleadtosubstantial environmentalimpact.
The study highlights the importance of embedding sustainability metrics within software systems. Rather than treating carbon analysis as an external audit process, integrating emission tracking at the application level encourages responsible software designandusagebehavior. The centralized dashboard further enhances transparency by visualizing cumulativeemissions.
However, the current model relies on fixed assumptionsforsystempowerconsumptionandcarbon intensity. Future work may focus on dynamic power profiling, real-time regional carbon intensity integration, cloud-side emission monitoring, and automated optimization suggestions for reducing digitalcarbonfootprints.
Inconclusion,thisresearchdemonstratesthatassistive technologies and environmental sustainability are not mutuallyexclusive.Byincorporatingcarbonawareness into digital systems, developers can contribute toward climate- consciousinnovation while maintaining social impact.
[1]M. Tauseef, S. G. Naik, and K. S. Harsha, “Spe kE sy Reader: An OCR-Based Text-to-Speech Device for Enhanced Accessibility inAssisting ReadingCh enges,” inProc.ICCCNT,IITMandi,India,2024.
[2] Y. Joh nd J. Lee, “Im ge Accessibiity for Screen Re der Users: A System tic Review nd Ro dm p,” Electronics,vol.10,no.8,pp.1–22,Apr.2023.
[3] A. Kerdar, M. Al-Khalifa, and S. Al-Mut iri, “The Accessibility of Digital Technologies for People with Visu Imp irment nd Bindness: A Scoping Review,” DiscoverComputing,vol.2,no.1,pp.1–18,2024.
International Research Journal of Engineering and Technology (IRJET) e-ISSN: 2395-0056 Volume: 13 Issue: 03 | Mar 2026 www.irjet.net p-ISSN: 2395-0072
[4] R. P te, S. Meht , nd A. Sh h, “Screen Re der AI: A Conversational Web-Accessibility Assistant for Blind and Low-VisionUsers,”Int.J.Eng.Sci.Inf.Technol.,vol.5,no. 2,pp.45–52,2025.
[5]M. Maashi, H. G. Iskandar, and M. Rizwanullah, “IoTdriven smart assistive communication system for the hearing impaired with hybrid deep learning models for sign ngu ge recognition,” Scientific Reports, 2025. [Online]. Available: https://doi.org/10.1038/s41598025-89975-1
[6]X.Chen,“OverviewofSpeechRecognitionAgorithms nd Their Appic tions,” Appied nd Comput tion Engineering,vol.183,pp.7–13,2025.
[7] H. Lou et ., “SpeechAgent: An End-to-End Mobile Infr structureforSpeechImp irmentAssist nce,”2025.
[8] K. Rev nk r et ., “S nv d: A Mutimod Accessibility Framework for ISL Recognition and VoiceBasedInter ction,”2025.
[9]A. Beloglazov and R. Buyya, “Energy Efficient Allocation of Virtu M chines in Coud D t Centers,” Future Generation Computer Systems, vol. 28, no. 5, pp. 755–768,2012.
[10]L. A. Barroso and U. Ho e, The Datacenter as a Computer: An Introduction to the Design of WarehouseScaleMachines,2nded.Morgan&Claypool,2013.
[11] S. N um nn, M. Dick, E. Kern, nd T. Joh nn, “The GREENSOFT Model: A Reference Model for Green and Sust in be Softw re Engineering,” Sust in be Computing: Informatics and Systems, vol. 1, no. 4, pp. 294–304,2011.
[12] T.Mytton,“Digit C rbonFootprint:Estim tingthe C rbon Emissions of Internet Use,” Journal of Cleaner Production,vol.209,pp.135–144,2019.
[13] Website C rbon C cu tor, “How Website C rbon Emissions re C cu ted.” [Onine]. Av i be: https://www.websitecarbon.com
[14] A.Hinde,“GreenMining:AMethodologyofRelating Softw re Ch nge to Power Consumption,” in Proc. IEEE MSR,2012,pp.78–87.
2026, IRJET | Impact Factor value: 8.315 | ISO 9001:2008 Certified Journal | Page1893