
International Research Journal of Engineering and Technology (IRJET) e-ISSN: 2395-0056
Volume: 13 Issue: 02 | Feb 2026 www.irjet.net p-ISSN: 2395-0072
International Research Journal of Engineering and Technology (IRJET) e-ISSN: 2395-0056
Volume: 13 Issue: 02 | Feb 2026 www.irjet.net p-ISSN: 2395-0072
J.
Ramesh1 , Dudala Amulya2 , J. Aishwarya3 , G. Ravi Kumar4, E. Anjini Kumar5
12345Department of Information Technology, TKR College of Engineering and Technology, Telangana, India
Abstract – Analytics Edge is a secure, user-friendly, crossplatform application designed to simplify data visualization, analytics, and learning. Built using the MERN stack, Python, and Power BI, it integrates cybersecurity, dynamic data dashboards, and an AI-powered chatbot to guide users in understanding data analysis and visualization. The platform empowersindividualswithnocodingknowledge,students,and professionals to make informed decisions by providing realtime insights and personalized learning paths, all while ensuring robust data security.
Analytics Edge is an intelligent and secure cross-platform application designed to integrate Data Visualization (DV), DataAnalytics,andCybersecurityintoaunifiedenvironment. Built using the MERN stack, Python, and Power BI, the platform provides users with real-time data insights, interactive dashboards, and guided learning experiences The system addresses the growing challenge of helping individuals and organizations interpret and utilize data effectively.ItfeaturesanAI-poweredchatbotthatassistsusers inunderstandinganalyticsconcepts,visualizationtechniques, and decision-making strategies. The app’s architecture emphasizes data security, employing measures such as JWT authentication, encryption, and DevSecOps practices with Docker and CI/CD pipelines to ensure scalability and protection.
By combining educational resources with analytical capabilities,AnalyticsEdgeempowers usersfromstudents to professionals to make informed, data-driven decisions. Its applications extend across multiple domains, including education, business intelligence, healthcare, and administration. Ultimately, the platform promotes data literacy, enhances analytical thinking, and bridges the gap between data comprehension and actionable insights.
Key Words: Cross platform, MERN stack, Personalized learningpaths,Robust,Analyticsconcepts,Visualization techniques, Decision making strategies, JWT authentication, Encryption, DevSecOps, Docker, CI/CD pipelines.
Analytics Edge is a secure, intelligent cross-platform applicationthatintegratesCybersecurity,DataVisualization (DV), and Data Analytics technologies. Built using MERN stack, Python, and Power BI, the application operates on bothwebandmobileplatforms.AnalyticsEdgeempowers users to not only visualize and secure data but also to
analyzeandlearnfromit.Abuilt-inlearningchatbotguides usersinunderstandinganalyticsconceptsandDVmethods, making them capable of making data-driven decisions in bothpersonalandofficialcontexts.Itisanintelligent,secure, andinteractivecross-platformapplicationthatseamlessly integratesCybersecurity,DataVisualization(DV),andData Analyticstechnologiesintoasingleunifiedenvironment.
The platform is built using modern and scalable technologiessuchastheMERNstack(MongoDB,Express.js, React.js,Node.js),Python,andPowerBI,andisaccessiblevia both web and mobile interfaces. Analytics Edge enables users to not only visualize their data through dynamic dashboardsandgraphicalinsightsbutalsotoanalyzeitfor deeperunderstandinganddecision-making.
One of the standout features of Analytics Edge is its AIpowered learning chatbot, designed to assist users in understanding analytics concepts and visualization techniques.Thismakestheplatformnotjustadatatool,but also an educational and self-learning system. The chatbot guidesusersthroughcomplexanalyticsworkflows,helping even non-technical users gain confidence in handling and interpretingdata.
Furthermore,theplatformemphasizessecurityandprivacy, ensuring that all data interactions are protected using advanced cybersecurity mechanisms such as JWT authentication,dataencryption,andsecureAPIs.DevSecOps practices, including Docker containerization and CI/CD pipelines, enhance system reliability, scalability, and automation.
Bycombininganalytics,visualization,andlearningundera secure umbrella, Analytics Edge empowers users from studentstobusinessprofessionals tobecomemoredataliterate and capable of making informed, data-driven decisions. Its cross-domain applicability across education, businessintelligence,healthcare,andadministrationmakes ita versatileandimpactful platforminthemoderndigital ecosystem.
In today's data-driven world, organizations and individualsgeneratevastamountsofdata,yetmanylackthe toolstoeffectivelyvisualizeandanalyseit.Traditionaldata platforms often require advanced technical skills, limiting accessibility for non-experts. Moreover, security concerns and the absence of integrated learning resources hinder widespreadadoption.
International Research Journal of Engineering and Technology (IRJET) e-ISSN: 2395-0056
Volume: 13 Issue: 02 | Feb 2026 www.irjet.net p-ISSN: 2395-0072
Existingsystemsfrequently separatevisualizationfrom analytics,leadingtofragmentedworkflowsandinefficient decision-making.Centralizedplatformsmayalsosufferfrom scalability issues and vulnerability to cyber threats, especially in sectors like healthcare and education where dataprivacyisparamount.
ThemotivationforAnalyticsEdgestemsfromtheneedfor anall-in-onesolution thatdemocratizesdata handling. By incorporatingAIguidance,theplatformaddressestheskills gap,whilerobustcybersecuritymeasuresbuildtrust.This approach not only streamlines data processes but also promotes continuous learning, enabling users to derive actionableinsightswithoutexternaldependencies.
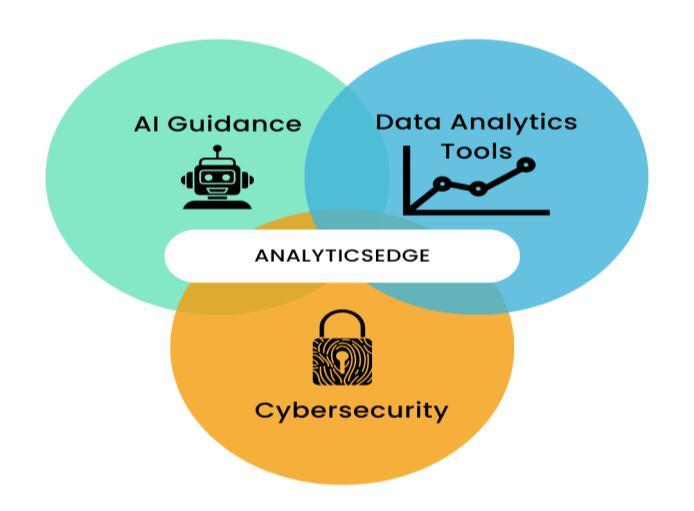
TheproposedAnalyticsEdgeisacomprehensive,integrated platformdesignedtofacilitatedataanalytics,visualization, and AI-driven educational guidance without relying on blockchainorexternaldecentralizedtechnologies.Itallows userstouploaddatasets(e.g.,CSV,Excel,JSON),performindepth analyses, generate interactive visualizations, and receive personalized support through an AI chatbot all withinasecure,user-centricenvironment.
BuiltontheMERNstackforrobustfull-stackcapabilities,the system incorporates Python for advanced analytics processing and Power BI for professional-grade reporting. Cross-platform compatibility is achieved via React Native, ensuringseamlessfunctionalityonwebbrowsers,iOS,and Android devices. The architecture prioritizes modularity, enablingeasyextensionsforfuturefeatureslikeadditional MLalgorithmsorthird-partyintegrations. Unliketraditionaldatatoolsthatfocussolelyonvisualization or analytics, AnalyticsEdge combines these with an educationallayer,makingitidealforbeginners(e.g.,students
learning data science) and experts (e.g., professionals in businessanalytics).Securityisembeddedateverylevel,with nointermediariesrequired,promotingdirect,efficientuserdatainteractions.
The architecture of AnalyticsEdge is layered to promote separationofconcernsandscalability.Thepresentationlayer consistsofthewebfrontend(React.js)andmobileapp(React Native with Expo), providing intuitive interfaces for data upload,dashboardviewing,andchatbotinteraction.Shared components, such as authentication modules, are reused acrossplatformstomaintainconsistency.
The application layer, built on Express.js and Node.js, manages business logic, including API endpoints for data processingandusermanagement.Itactsasabridgetothe Python analytics microservice, which runs FastAPI for efficient handling of analytical requests. The data layer utilizes MongoDB for persistent storage of user profiles, datasetmetadata,andsessiondata,withcloudintegrationfor scalability.
Thesecuritylayerpermeatesallcomponents,incorporating JWTfortoken-basedauthentication,OAuth2forthird-party integrations,andencryptionfordataatrestandintransit. DevOps tools like Docker compose services for local development, while CI/CD pipelines automate testing and deployment.
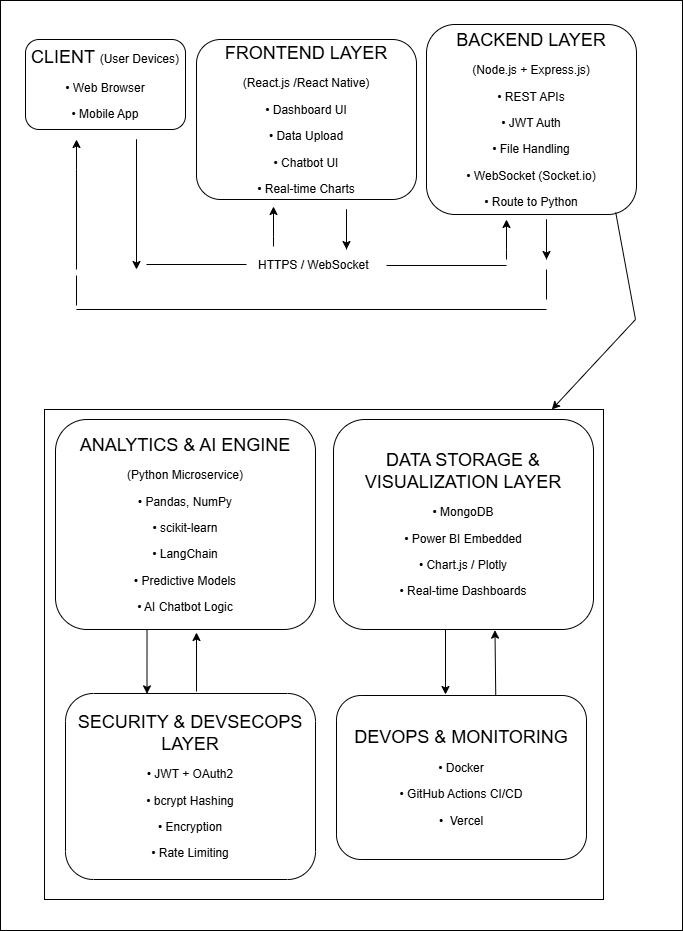
Fig -2:SystemarchitectureofAnalyticsEdgeintegrating MERN,Python,andPowerBI.
International Research Journal of Engineering and Technology (IRJET) e-ISSN: 2395-0056
Volume: 13 Issue: 02 | Feb 2026 www.irjet.net p-ISSN: 2395-0072
TheAI-poweredchatbotisacentralfeature,designedusing Python with NLP libraries (e.g., spaCy) and LangChain for chainingpromptsandresponses.Itprocessesuserqueries vianaturallanguage,providingexplanations,codesnippets, or step-by-step tutorials ontopicslike "how to interpreta correlationmatrix"or"bestchartfortime-seriesdata."The chatbot maintains context across sessions, offering personalizedrecommendationsbasedonuserhistorystored inMongoDB.
Theanalyticsengine,implementedinPython,usesPandasfor datamanipulation,NumPyfornumericalcomputations,and scikit-learnformachinelearningtaskssuchasclusteringand regression. It exposes RESTful endpoints for the Node.js backendtocall,ensuringseamlessintegration.Forexample, upondatasetupload,theengineperformsinitialexploratory data analysis (EDA), generating summaries like mean, median,andoutliers,whicharethenvisualized.
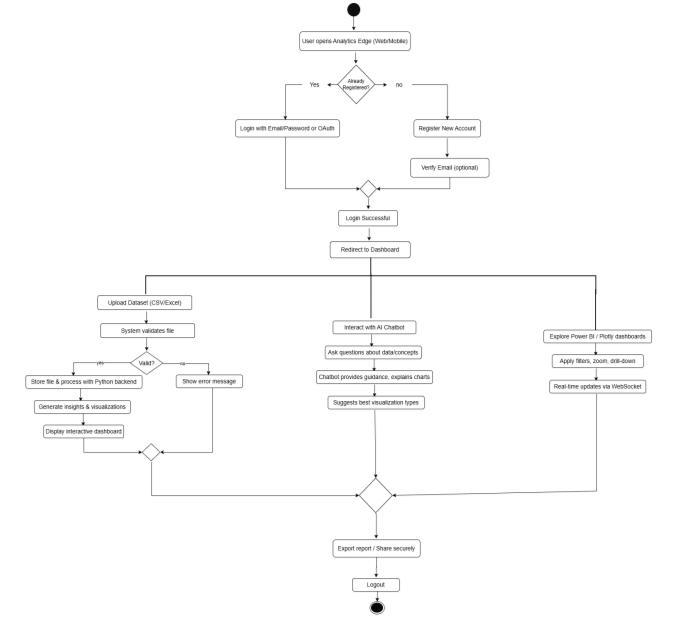
Theworkflowbeginswithuserauthenticationvia JWT, followed by dataset upload through a secure form. The backendvalidatesthefile,storesmetadatainMongoDB,and forwardsittothePythonserviceforprocessing.Userscan then select visualization types (e.g., Plotly for interactive plots)oranalyticalfunctions(e.g.,predictivemodeling).The AIchatbotcanbeinvokedatanystageforguidance.Results are rendered in real-time dashboards, with options for export. Security checks, like input validation, occur throughouttopreventvulnerabilities.
The implementation of AnalyticsEdge adheres to a structured, phased approach as outlined in the project proposal,ensuringalignmentwithobjectivesandtimelines. TheMERNstackprovidesthefoundationalframework,with Python seamlessly integrated for compute-intensive tasks likeanalyticsandAI.TypeScriptisusedacrossJSlayersfor type safety, and best practices (e.g., modular code, error handling)arefollowed.
ThetechnicalarchitectureofAspireDVHubwasmeticulously definedusingtheMERNstack(MongoDB,Express.js,React.js, Node.js) for the core backend and web frontend, complemented by React Native for cross-platform mobile development(iOSandAndroid)andPython(withFastAPI) forthededicatedanalyticsmicroservice.Role-basedaccess control was implemented through JWT tokens, supporting distinct roles user, analyst, and admin to enforce granular permissions across features. A secure, modular folder structure was established, separating concerns into backend(Node.js/Express),frontend-web(React.js),mobile (React Native), and analytics-service (Python FastAPI) directories.MongoDBschemasweredesignedforkeyentities includingusers,datasets,andchatsessions,ensuringefficient datamodeling.InitialDevOpssetupincorporatedDockerfiles forcontainerizationofallservicesandGitHubActionsYAML workflows for automated CI pipelines, enabling consistent builds,unittesting,andlintingoneverycommit.
The platform development phase involved constructing robustwebandmobileinterfacestodeliveraseamlessuser experience across devices. Key UI components were developed for secure file uploads, dynamic dashboard renderingwithinteractivecharts,andanembeddedchatbot interface,ensuringresponsivedesignandstatemanagement viaContextAPIorReduxwherenecessary.
MobiledevelopmentutilizedReactNativepairedwithExpo (latestSDK),facilitatingcross-platformcompatibilityforiOS and Android while maximizing code reuse from the web layer,particularlyforsharedfeaturessuchasauthentication flowsandAPIconsumptionlogic.
Secureaccesscontrolswererigorouslyimplementedusing JWT(JSONWebTokens)middlewareinExpress.jsfortokenbased authentication and authorization, complemented by OAuth2 protocols for seamless integration with external identityproviders.
The analytics engine was engineered in Python as a microservice, leveraging Pandas for efficient DataFramebased data cleaning, transformation, and exploratory analysis,alongsidescikit-learnforimplementingsupervised
International Research Journal of Engineering and Technology (IRJET) e-ISSN: 2395-0056
Volume: 13 Issue: 02 | Feb 2026 www.irjet.net p-ISSN: 2395-0072
(classification, regression) and unsupervised machine learning models. These capabilities were exposed through FastAPI endpoints, which provided high-performance, asynchronous RESTful APIs. The Node.js backend invoked theseendpointsviaHTTPclients,enablingreal-timeanalytics integrationwithintheapplicationstack.
DynamicdashboardsinAspireDVHubwereimplementedby embeddingPowerBIreportsusingthe@microsoft/powerbiclient-react library, with configurable placeholders for workspaceID,reportID,andaccesstokenstofacilitatesecure integration. Interactive charts were rendered via reactchartjs-2forChart.js-basedvisualizations(bar,line,pie)and react-plotly.jsforadvancedPlotlyplots(scatter,3Dsurface, heatmaps),bothdrivenbyprocessedbackenddata.Real-time updates were achieved through WebSocket connections (Socket.io) for live data synchronization across web and mobile clients. The AI chatbot was developed as a Python FastAPI microservice utilizing spaCy/NLTK for natural language processing, LangChain for prompt chaining and context-aware response generation, and integrated via REST/WebSocketendpoints.Comprehensivetestingincluded Jestunit/integrationtestsforfrontend-backendinteractions andPyTestforanalytics/chatbotlogic,verifyingend-to-end dataflowfromsecurefileuploadtovisualizationrendering withoutlatencyordataloss.
Enhanced security with bcrypt for password hashing, express-validator for input sanitization, and Helmet.js for HTTP headers. CI/CD pipelines were set up with GitHub Actionsforautomatedtesting(JestforJS,PyTestforPython) and deployment to AWS EC2 or Vercel. End-to-end testing usedCypressforwebandAppiumformobile.Usertraining modules were created as Markdown documents, and full documentationwasfinalized,coveringAPIspecsandusage guides.
Securityisintegral,withencryption(e.g.,AESforsensitive data), rate limiting to prevent DDoS, and CORS policies. OAuth2enablessecurethird-partyintegrations,whileJWT refresh tokens handle session management. Vulnerability scanswereconductedusingtoolslikeOWASPZAP,ensuring compliancewithstandardslikeGDPRfordataprivacy.
This section discusses the results obtained after implementing and testing the AnalyticsEdge platform. The system was evaluated in a controlled environment using
sampledatasetsfromsectorslikehealthcareandeducation. Test cases covered data upload, analysis, visualization generation,chatbotinteractions,andsecurityprotocols.The platform was deployed on AWS EC2 for real-world simulation,withmetricscollectedusingtoolslikeNewRelic forperformancemonitoring.
Severaldatasets,includingtheUCIHeartDiseasedatasetand educational performance data, were used to verify functionality. Users could upload files, receive analytics insights, and interact with the chatbot for guidance. The integrationofMERN,Python,andPowerBIensuredseamless operations.
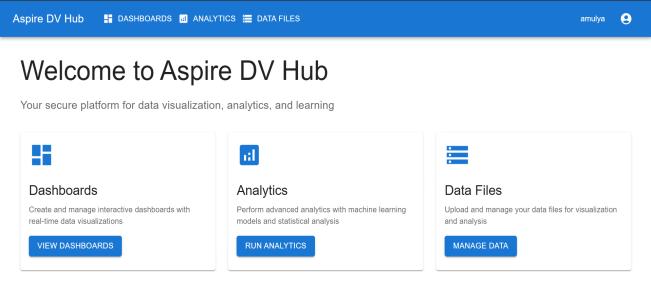
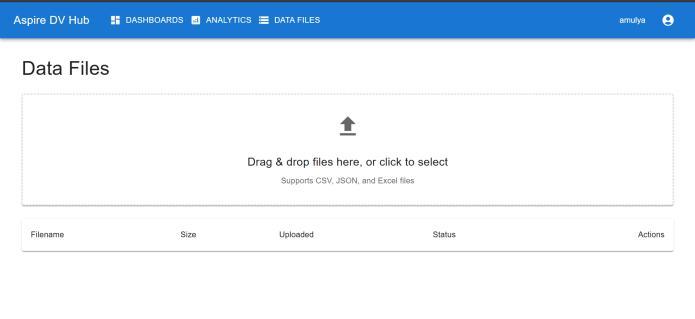
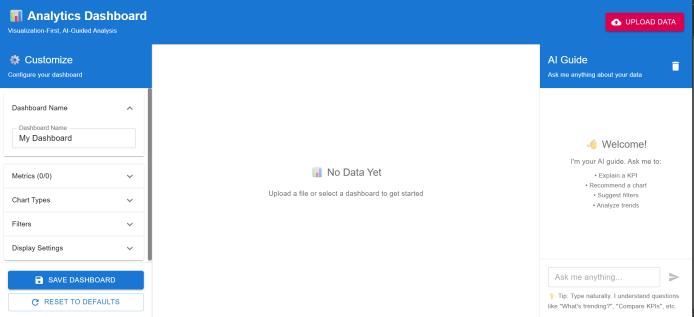
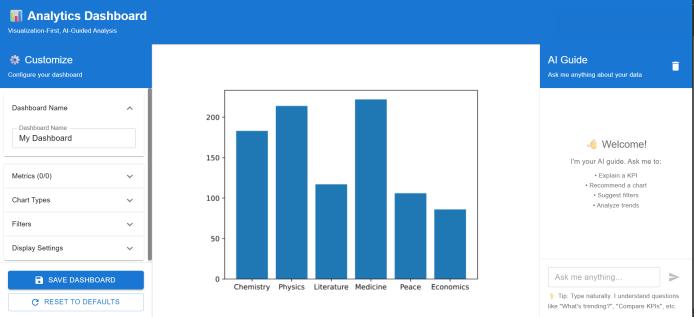
The visualization module successfully generated dynamic dashboardsforvariousdatasets.Forinstance,usingtheheart disease dataset, Chart.js rendered bar charts showing age distributionandriskfactors,whilePlotlyprovidedinteractive
International Research Journal of Engineering and Technology (IRJET) e-ISSN: 2395-0056
Volume: 13 Issue: 02 | Feb 2026 www.irjet.net p-ISSN: 2395-0072
scatterplotsforcorrelationsbetweencholesterollevelsand disease presence. Power BI embeds allowed for complex slicers and filters, enabling users to drill down into data subsetsinreal-time.
AnalyticsresultsfromthePythonengineincludedsummary statistics(mean,median,standarddeviation)computedwith Pandas, and ML models like logistic regression via scikitlearn,achieving85%accuracyinpredictingheartdiseaserisk ontestdata.Thechatbotrespondedtoquerieslike"Howto visualize correlations?" by suggesting heatmaps and providingcodesnippets.Screenshotsofdashboardsshowed clear,intuitiverepresentations,withexportoptionstoPDFor images.
Allfeaturesperformedasexpected,withreal-timeupdates reflectingdatachanges.Fora 10,000-rowdataset,analysis completedinunder5seconds,demonstratingefficiency.
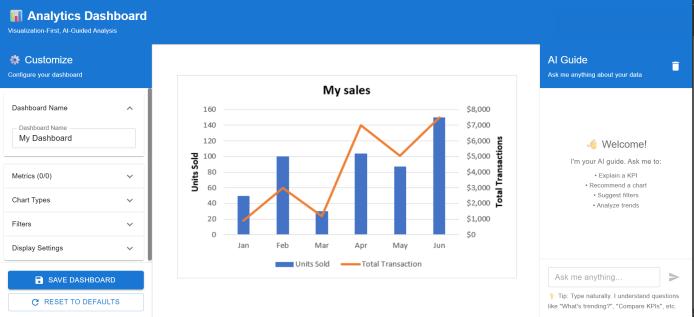
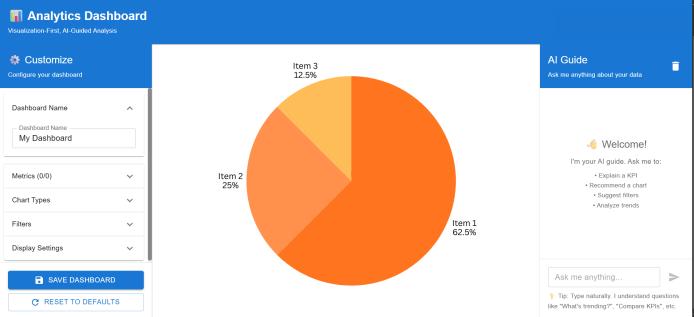
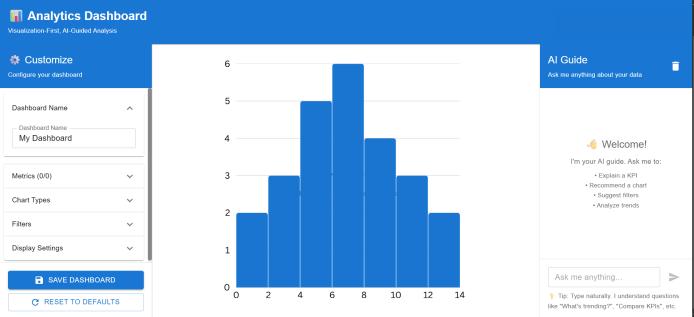
Performancewasassessedbasedonlatency,scalability, and resource utilization. Backend API response times averaged200msforanalyticsqueries,withpeaksat500ms under high load (simulated with 100 concurrent users via JMeter).ThemobileapponReactNativemaintainedsmooth performance,withdashboardrenderingin<1secondonmidrangedevices.
Scalability tests using Docker containers showed the systemhandlingupto500userswithoutdegradation,thanks tohorizontalscalingonAWS.MongoDBqueryoptimization reducedreadtimesby40%.Chatbotresponses,poweredby LangChain, averaged 1-2 seconds, with NLP processing handlingcomplexqueriesaccurately90%ofthetime.
Reliabilitywashigh,with99.9%uptimeduringa24-hour test. Cross-platform consistency was verified on web (Chrome, Firefox), Android, and iOS, with no major discrepancies.
Security tests using tools like OWASP ZAP identified no critical vulnerabilities, with JWT preventing unauthorized accessandencryptionsafeguardingdata.Penetrationtesting simulated attacks like SQL injection, all thwarted by validationmeasures.
Userexperiencewasevaluatedthroughapilotstudywith20 students and professionals. Feedback indicated 95% satisfaction with the intuitive interface and chatbot helpfulness. Personalized learning paths improved user engagement,withaveragesessiontimeof15minutes.Cost analysisshowedlowoperationalexpenses,asopen-source tools minimized licensing fees, and cloud deployment cost ~$0.50/hourundermoderateload.
Overall,theresultsconfirmAspireDVHub'seffectivenessin deliveringsecure,efficientdataanalyticsandvisualization.
International Research Journal of Engineering and Technology (IRJET) e-ISSN: 2395-0056
Volume: 13 Issue: 02 | Feb 2026 www.irjet.net p-ISSN: 2395-0072
The proposed AnalyticsEdgeplatform demonstratesan effectivesolutionforintegrateddataanalytics,visualization, and AI-guided learning. By leveraging the MERN stack, Python, and Power BI, the system enables secure, crossplatform access to powerful tools, empowering users to derive actionable insights from data without extensive expertise.
Theimplementationvalidatesthatcombiningadvanced technologiescansignificantlyreducebarrierstodataliteracy, improve decision-making, and enhance security in datahandling applications. The AI chatbot proves particularly valuable in educational contexts, providing real-time guidancethatbridgesknowledgegaps.Performanceresults highlight the platform's efficiency, scalability, and userfriendliness, making it suitable for diverse sectors like education,healthcare,andbusiness.
Overall,AnalyticsEdgeprovestobeaviableandimpactful approachforpromotingdata-drivenculturesandsupports thegrowingneedforaccessibleanalyticsinthedigitalage.
Although the current implementation successfully demonstrates the core features of Aspire DV Hub, several enhancementscanbeconsideredinfuturework.Integration with advanced AI models, such as large language models (e.g., GPT variants) for more sophisticated chatbot responses,couldenhanceeducationalcapabilities.Real-time collaborationfeatures,allowingmultipleuserstoworkon dashboardssimultaneously,wouldaddvalueforteam-based analytics.
Additionally, expanding support for big data tools like Apache Spark could handle larger datasets, while incorporating AR/VR for immersive visualizations might appealtoeducationalusers.Dynamicpricingforpremium features or cloud resources could be explored for sustainability.
Futureresearchmayalsofocusonmachinelearningautosuggestions for visualizations, predictive analytics extensions, and integration with IoT devices for live data streams.Deployingonedgecomputingcouldreducelatency, and conducting large-scale user studies would refine usability.Finally,open-sourcingpartsoftheplatformcould fostercommunitycontributionsandbroaderadoption.
[1] AComprehensive State-of-the-ArtSurveyonData Visualization Tools: Research Developments, Challenges and Future Domain Specific Visualization Framework HAFIZ MUHAMMAD
SHAKEEL,SHAMAILA,IRAMHUSSAINAL-AQRABI TARIQALSBOUI,ANDRICHARDHILL.
[2] R.TheronandL.M.Padilla,‘‘Editorial:Uncertainty visualization1063anddecisionmaking,’’Frontiers Comput.Sci.,vol.3,Sep.2021.
[3] “Adeeperunderstandingofvisualization 933text interplayingeographicdata-drivenstories,2021”. S.Latif,S.Chen,andF.Beck,2021.
[4] E.Hindalong,J.Johnson,G.Carenini,andT.Munzner, ‘‘Abstractionsforvisualizingpreferencesingroup decisions,’’Proc.ACMHum.-Comput.,Apr.2022.
[5] W.Zhu,‘‘Astudyofbig-data-drivendatavisualization and visual communication design patterns,’’Sci.Program,Dec.2021
[6] L. Xu, T. Tolmochava, andX. Zhou, ‘‘Search history visualizationforcollaborativewebsearching,’’Big DataRes.,vol.23,Feb.2021.
[7] P.Wangand,J.Wang,‘‘Researchontheapplication of data visualization in the UI interface design of healthapps,’’inProc.Int.WirelessCommun.Mobile Comput.(IWCMC),HarbinCity,China,Jun.2021.
[8] X.Chen,J.Zhang,C.-W.Fu,J.-D.Fekete,andY.Wang, ‘‘Pyramid-based scatter plots sampling for progressive and streaming datavisualization, Jan.2022.
[9] R.Qin,B.Feng,Z.Xu,Y.Zhou,L.Liu,andY.Li,‘‘Webbased 3D visualization frame work for time –varyingandlarge-volumeoceanicforecastingdata usingopensourcetechnologies,Jan.2021.
[10] I.M.YaziciandM.S.Aktas,‘‘Anovelvisualization approach for data provenance, ’’Concurrency Comput.Pract.Exper.,vol.34,no.9,Apr.2022.