
International Research Journal of Engineering and Technology (IRJET) e-ISSN: 2395-0056
Volume: 13 Issue: 03 | Mar 2026 www.irjet.net p-ISSN: 2395-0072
International Research Journal of Engineering and Technology (IRJET) e-ISSN: 2395-0056
Volume: 13 Issue: 03 | Mar 2026 www.irjet.net p-ISSN: 2395-0072
Harsh Majmundar1 , Prof. Vishudha Dattani2 , Dr. Nanak Pamnani3
1M.Tech Student, Department of civil engineering , S.P.C.E.T. Anand, Gujarat, India
2Professor,Department of civil engineering, S.P.C.E.T. Anand , Gujarat, India
3Principal, S.P.C.E.T. Anand , Gujarat, India
Abstract - Wind load governs the design of overhead transmissiontowers due to their height,slendermembers,and continuous exposure to atmospheric actions. Different design standards adopt different representations of wind characteristics and gust effects, resulting in variation in estimated wind forces and structural response. IS 802 (Part 1/Sec 1):2015 evaluates wind load by converting a 3-second gust wind speed into an equivalent mean wind speed and applyinggust responsefactors.Incontrast,AS/NZS7000:2016 directly uses the 3-second gust wind speed with terrain, shielding, and span-related modification factors and allows separate consideration of synoptic and downdraft wind mechanisms.
In the present study, wind forces on transmission tower components are evaluated using IS 802 (Part 1/Sec 1):2015 and AS/NZS 7000:2016 under identical site conditions. A 132 kV and a 220 kV suspension-type lattice tower are modeled and analyzed using STAAD Pro. Wind forces on conductors, earth wires, and tower body, along with resulting member forces, are compared. The results show that IS 802 generally produces higher forces under synoptic wind conditions, while the difference reduces significantly when downdraft wind provisions of AS/NZS 7000 are considered. This indicates that the higher forces in IS 802 mainly arise from its gust factor–based approach.
Keywords: Transmission tower, Wind load, IS 802, AS/NZS 7000, Synoptic wind, Downdraft wind
Transmission towers are critical structures for power transmissionandarehighlysensitivetowindloadingdueto their tall height, open lattice configuration, and long conductorspans.Windloadestimationplaysamajorrolein the design of tower members, foundations, and even moderate variation in wind forces can significantly affect structuralsafetyandeconomy.
In India, transmission towers are designed in accordance with IS 802 (Part 1/Sec 1):2015, which evaluates wind effects using a mean wind speed combined with gust response factors. International standards such as AS/NZS 7000:2016adoptadifferentapproachbydirectlyusingthe 3-secondgustwindspeedalongwithterrain,shielding,and span modification factors. AS/NZS 7000 also permits
separate consideration of synoptic and downdraft wind mechanisms,whichisnotexplicitlyaddressedinIS802.
Understandingthedifferencesbetweentheseapproachesis importantforevaluatingtherelativeconservatismofwind loadprovisionsandtheirinfluenceontransmissiontower design. The present study compares wind forces and structuralresponseobtainedfromIS802andAS/NZS7000 through analytical modelling and numerical analysis of typicaltransmissiontowers.
2.WINDLOADPROVISIONSINDESIGNSTANDARDS
Windloadontransmissiontowersdependsonwindspeed definition, terrain exposure, height variation, gust effects, andspatialcorrelationalongconductorspans.IS802(Part 1/Sec 1):2015 and AS/NZS 7000:2016 adopt different formulationsfortheseparameters,leadingtovariationsin calculatedwindforces.
2.1 Wind Load Provisions as per IS 802 (Part 1/Sec 1):2015
IS802definesthebasicwindspeedasa3-secondgustat10 m above ground level. For design, this gust wind speed is convertedtoanequivalentmeanwindspeedusingterrain and height factors. Gust effects on conductors, insulators, andtowermembersareincorporatedthroughgustresponse factors.
2.2 Wind Load Provisions as per AS/NZS 7000:2016
AS/NZS7000usesthe3-secondgustwindspeeddirectlyfor design, modified by direction, terrain, shielding, and topographicmultipliers.Gusteffectsareinherentlyincluded, and no separate gust response factor is applied. For conductors, span reduction factors account for spatial correlation, while tower body forces are evaluated using forcecoefficientsbasedonmembershapeandsolidityratio.
Volume: 13 Issue: 03 | Mar 2026 www.irjet.net p-ISSN: 2395-0072
AS/NZS 7000 allows different wind models based on the governingwindmechanism.Synopticwindsrepresentlargescale wind systems with relatively uniform wind fields, wherespanreductionfactorssignificantlyreduceconductor forces.Downdraftwindsareshort-duration,localized,highintensitywindsassociatedwithconvectivestorms,resulting inhigherlocalwindpressuresandreducedeffectivenessof spanreductionfactors.
InmanypartsofIndia,severewindsaffectingtransmission lines are commonly associated with thunderstorms and convectiveactivity,whichexhibitdowndraft-typebehavior. IS 802 indirectly accounts for such effects through gust responsefactors,leadingtohigherwindforceestimates.
The results of the present study indicate that when downdraftwindprovisionsofAS/NZS7000areapplied,the difference between IS 802 and AS/NZS 7000 reduces compared to synoptic wind conditions, particularly for conductorsatlowerheights.However,IS802continuesto predicthigher windforces onconductorsand towerbody acrossmostheightandspanranges.Thisindicatesthatthe higherforcesobtainedfromIS802primarilyarisefromits gustfactor–basedformulation,whichintroducesincreasing conservatism with height, rather than from differences in basicwindspeeddefinition.
3. Methodology
Basedontheaboveunderstandingofwindload modelling approaches,numericalwindforcecalculationsandstructural analysesareperformedforrepresentative132kVand220 kV suspension type transmission towers. Wind loads are evaluated using IS 802 (Part 1/Sec 1):2015 and AS/NZS 7000:2016 under identical site and terrain conditions, consideringbothsynopticanddowndraftwindmodels.The resultingforcesonconductors,insulators,towerbody,and overall structural responses are compared to quantifythe influenceofeachstandard.
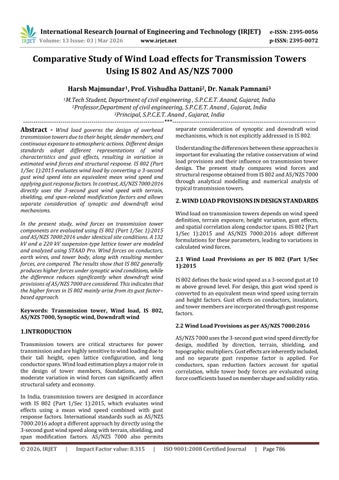
a) Towergeometryfor132kVTower
No.ofcircuit:Doublecircuit
Angleofdeviation:0-to-2-degreedeviation
Towertype:Suspensiontower
Spanlength:260m
Totalheight:26.677m
Heightoftopconductor:22.71m
HeightofMiddleconductor:18.714m
Heightofbottomconductor:14.666m
Basewidthoftower:4.250m
Conductor:ACSRPanther
Opticalgroundwire=48fibers
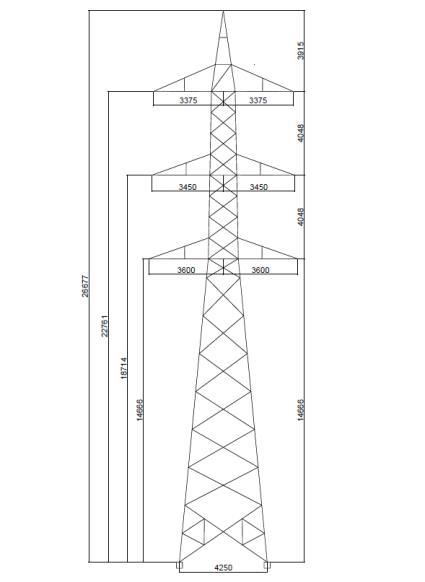
b) Towergeometryfor220kVTower
No.ofcircuit:Doublecircuit
Angleofdeviation:0-to-2-degreedeviation
Towertype:Suspensiontower
Spanlength:350m
Totalheight:32.165m
Heightoftopconductor:27.280m
HeightofMiddleconductor:22.130m
Heightofbottomconductor:16.955m
Basewidthoftower:6.4m
Conductor:ACSRZebra
Opticalgroundwire=48fibers
International Research Journal of Engineering and Technology (IRJET) e-ISSN: 2395-0056
Volume: 13 Issue: 03 | Mar 2026 www.irjet.net p-ISSN: 2395-0072
Thefollowingparametersareusedforbothstandards:
Basicwindspeed(3-secondgust):47m/s
Terraincategory:Openterrain
Airdensity:1.225kg/m³
3.3. Tower forces evaluation as per IS 802 (Part 1/Sec 1):2015
1) Forces evaluation for 132kV Tower
a) Wind force on conductor (Fwc)
Fwc=Pd xAxCdxGt
Were,
Pd =Designwindpressure=0.6Vd2
Vd =Designwindspeed=VR xK1 xK2
VR =Referencewindspeed=Vb /K0
K1 =Riskcoefficient
K2 =Terrainroughnesscoefficient
K0 =1.375
L=Windspan,inm
d=diameterofconductor,inm
Cdc =Dragcoefficient,1.0forconductor
1.2forEarthwire/OPGW
Gc=Gustresponsefactor,asperTable7.
ForWindspeed47m/s
Designwindpressure,
Pd =0.6x(47/1.375)2 x1x1,(K1 &K2 =1)
Pd =701.04N/m2
Forceonconductor
Fwc=701.04x260x0.021x1x2.09 =8000N
b) Wind force on OPGW (Fwc)
Fwc=Pd xAxCdxGt
Fwc=701.04x260x0.0121x1.2x2.09 =5531.31N
c) Wind force on Insulator (Fwi)
Fwi=Pd xAxGxCdt =701.04x2.0x0.3x2.2x1.2 =1110.44N
d) Wind force on tower body (Fwt)
Fwt=Pd xAxCdxGT
A=netareaoftower
Cd = Drag coefficient of tower based on solidity
ration,aspertable5,
Solidityratio=Netarea/Totalarea =13.98/63.96=0.22
Cd=3.42
Fwt=701.04x13.98x3.42x2.2 =73739N
Nos.ofnodes=57
Loadoneachnode=73739/57 =1293.67N
e) Self-weight of conductor
Vc =Spanlengthxunitweight =260x9.55 =2483N
f) Self-weight of OPGW
Vc =Spanlengthxunitweight =260x3.79=985N
g) Self-weight of insulator and man-tools load
Vi = 300kg=3000N
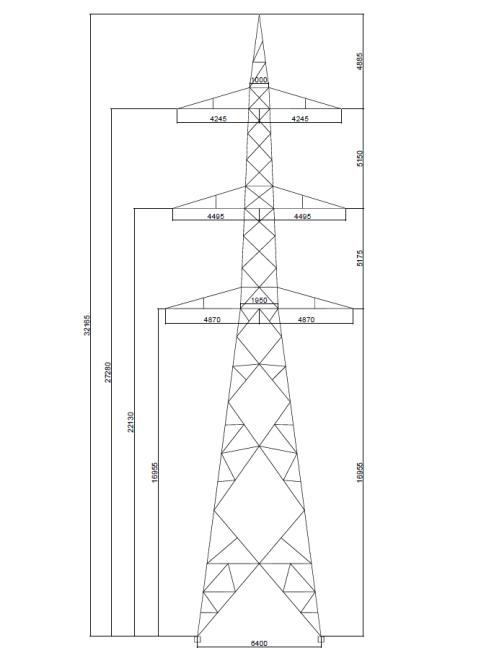
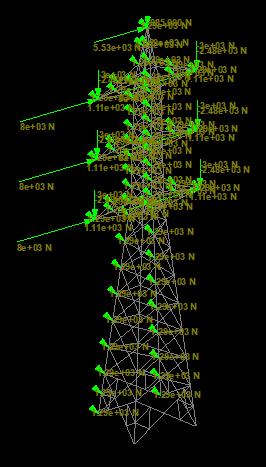
h) Staad model for 132kV Tower :
2) Forces evaluation for 220kV Tower
a) Windforceonconductor(Fwc)
Fwc=Pd xAxCdxGt
Pd ,sameasabovecalculation
Pd =701.04N/m2
Forceonconductor
Fwc=701.04x350x0.02862x1x2.16 =15168.2N
b) Wind force on OPGW (Fwc)
Fwc=Pd xAxCdxGt
Fwc=701.04x350x0.0121x1.2x2.16 =7695.38N
c) Wind force on Insulator (Fwi)
Fwi=Pd xAxGxCdt =701.04x3.0x0.3x2.3x1.2 =1741.38N
d) Wind force on tower body (Fwt)
Fwt=Pd xAxCdxGT
A=netareaoftower
Cd = Drag coefficient of tower based on solidity ration,aspertable5,
Solidityratio=Netarea/Totalarea =17.95/110.96=0.162
Cd=3.50
Fwt=701.04x17.95x3.50x2.3 =101298N
International Research Journal of Engineering and Technology (IRJET) e-ISSN: 2395-0056
Volume: 13 Issue: 03 | Mar 2026 www.irjet.net p-ISSN: 2395-0072
Nos.ofnodes=37
Loadoneachnode=101298/37 =2737.79N
e) Self-weight of conductor
Vc =Spanlengthxunitweight =350x15.90 =5565.71N
f) Self-weight of OPGW
Vc =Spanlengthxunitweight =350x3.79=1326.5N
g) Self-weight of insulator and man-tools load
Vi = 300kg=3000N
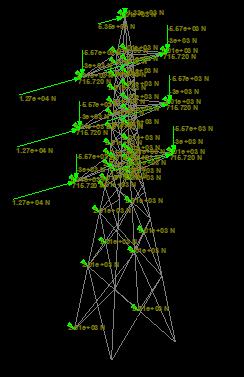
h) Staad model for 220kV Tower :
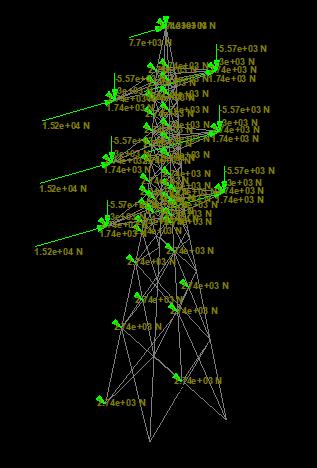
3.4. Tower forces evaluation as per AS/NZS 7000:2016, Considering synoptic wind condition
1) Forces evaluation for 132kV Tower
a) Wind force on conductor (Fc)
Fc=qz xCdxLXdxSRFxCOS2α
Were,
qz =Designwindpressure=0.6xV2sit,β
Vsit,β =Designsitewindspeed =VR xMd xMz,cat xMs xMt
VR =Basicregionalwindvelocity
Md =Winddirectionmultiplier
Mz,cat = Gust wind speed multiplier for terrain categoryatheightZ
Ms=Shieldingmultiplier
Mt =Topographicmultiplier
L=Windspan,inm
d=diameterofconductor,inm
α = Angle of wind direction, = 0
Cd=Dragcoefficient,1.0forconductor
SRF=Spanreductionfactor
ForWindspeed47m/s
VR =47m/s
Md =1.0
Mz,cat =1.09
Ms=1.0
Mt =1.0
Designwindpressure,
qz =0.6x(47x1.09)2
Pd =1574.71N/m2
Forceonconductor
Fc=1574.71x1.0x260x0.021x0.725
=6233.48N
b) Wind force on OPGW (Fc)
Fc=qz xCdxLXdxSRFxCOS2α
=1574.71x1.2x260x0.0121x0.725
=4310.01N
c) Wind force on Insulator (Fi)
Fi=qz xCdxA
=1574.71x1.2x2.0x0.3
=1133.79N
d) Wind force on tower body (Fs)
Fs =qz xCdxAxCOS2α
A=memberarea=13.98m2
Cd=3.06
Fs =1574.71x3.06x13.98
=67364.10N
Nos.ofnodes=57
Loadoneachnode=67364.10/57
=1181.83N
e) Self-weight of conductor
Vc =Spanlengthxunitweight =260x9.55 =2483N
f) Self-weight of OPGW
Vc =Spanlengthxunitweight
=260x3.79=985N
g) Self-weight of insulator and man-tools load
Vi = 300kg = 3000N
h) Staad model for 132kV Tower :
International Research Journal of Engineering and Technology (IRJET) e-ISSN: 2395-0056
Volume: 13 Issue: 03 | Mar 2026 www.irjet.net p-ISSN: 2395-0072
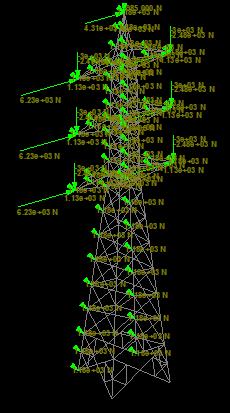
2) Forces evaluation for 220kV Tower
a) Wind force on conductor (Fc)
Fc=qz xCdxLXdxSRFxCOS2α
Were,
VR =47m/s
Md =1.0
Mz,cat =1.12
Ms=1.0
Mt =1.0
Designwindpressure,
qz =0.6x(47x1.12)2
Pd =1662.58N/m2
Forceonconductor
Fc=1662.58x1.0x350x0.02862x0.675 =11241.58N
b) Wind force on OPGW (Fc)
Fc=qz xCdxLXdxSRFxCOS2α =1662.58x1.0x350x0.0121x0.675 =4752.70N
c) Wind force on Insulator (Fi)
Fi=qz xCdxA =1662.58x1.2x3.0x0.3 =1795.59N
d) Wind force on tower body (Fs)
Fs =qz xCdxAxCOS2α
A=memberarea=17.95m2
Cd=3.13
Fs =1662.58x3.13x17.95 =93409.7N
Nos.ofnodes=37
Loadoneachnode=93409.7/37 =2524.59N
e) Self-weight of conductor
Vc =Spanlengthxunitweight =350x15.90=5565.71N
f) Self-weight of OPGW
Vc =Spanlengthxunitweight =350x3.79 =1326.5N
g) Self-weight of insulator and man-tools load
Vi = 300kg = 3000N
h) Staad model for 220kV Tower :
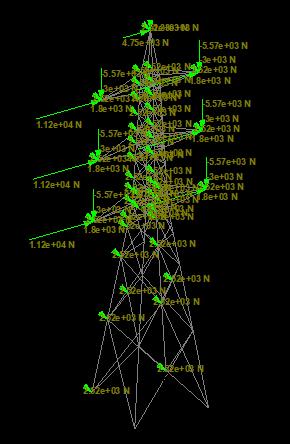
3.4. Tower forces evaluation as per AS/NZS 7000:2016, Considering downdraft wind
3) Forces evaluation for 132kV Tower
a) Wind force on conductor (Fc)
Fc=qz xCdxLXdxSRFxCOS2α
VR =47m/s
Md =1.0
Mz,cat =1.0
Ms=1.0
Mt =1.0
SRF=1.0
Designwindpressure,
qz =0.6x(47x1.00)2
Pd =1325.40Ns/m2
Forceonconductor
Fc=1325.40x1.0x260x0.021x0.98 =7091.95N
b) Wind force on OPGW (Fc)
Fc=qz xCdxLXdxSRFxCOS2α
=1325.40x1.2x260x0.0121x0.98 =4903.58N
c) Wind force on Insulator (Fi)
Fi=qz xCdxA =1325.40x1.2x2.0x0.3
=954.288N
d) Wind force on tower body (Fs)
Fs =qz xCdxAxCOS2α
A=memberarea=13.98m2
Cd=3.06
Fs ==1325.40x3.06x13.98
International Research Journal of Engineering and Technology (IRJET) e-ISSN: 2395-0056
Volume: 13 Issue: 03 | Mar 2026 www.irjet.net p-ISSN: 2395-0072
=56699N
Nos.ofnodes=57
Loadoneachnode=56699/57 =994.72N
e) Self-weight of conductor
Vc =Spanlengthxunitweight =260x9.55 =2483N
f) Self-weight of OPGW
Vc =Spanlengthxunitweight =260x3.79=985N
g) Self-weight of insulator and man-tools load
Vi = 300kg = 3000N
h) Staad model for 132kV Tower :
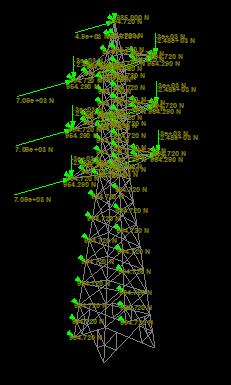
4) Forces evaluation for 220kV Tower
a) Wind force on conductor (Fc)
Fc=qz xCdxLXdxSRFxCOS2α
Fc=1325.40x1.0x350x0.02862x0.953 =12652.53N
b) Wind force on OPGW (Fc)
Fc=qz xCdxLXdxSRFxCOS2α =1325.4x1.0x350x0.0121x0.953 =5349.25N
c) Wind force on Insulator (Fi)
Fi=qz xCdxA
=1325.40x1.2x3.0x0.3 =715.72N
d) Wind force on tower body (Fs)
Fs =qz xCdxAxCOS2α
A=memberarea=17.95m2
Cd=3.13
Fs=1325.40x3.13x17.95 =74465.6N
Particular
802: (PART1 /SEC1) :2015
Wind force on tower body for 132kVTower
Max. compressive force for 132kV Tower
N
Max. tensile force for 132kV Tower 265627.32 N
Max.Shearforce for 132kV Tower 1912.10N
Wind force on conductor for 220kVTower
force on tower body for 220kVTower
Max. compressive force for 220kV Tower
Max. tensile force for 220kV Tower 345422.06 N
Max.shearforce for 220kV Tower 1317.60N 1152.05N 13%
Nos.ofnodes=37
Loadoneachnode=74465.6/37 =2012.58N
e) Self-weight of conductor Vc =Spanlengthxunitweight =350x15.90=5565.71N
f) Self-weight of OPGW Vc =Spanlengthxunitweight =350x3.79=1326.5N
g) Self-weight of insulator and man-tools load Vi = 300kg=3000N
International Research Journal of Engineering and Technology (IRJET) e-ISSN: 2395-0056
Volume: 13 Issue: 03 | Mar 2026 www.irjet.net p-ISSN: 2395-0072
4.0. Result and comparison
Wind force on conductor for 132kV Tower 8000.00N 7091.95N 11%
Wind force on tower body for 132kV Tower 73739N 56699.00N 23%
Max. compressive force for 132kV Tower 295441.74N 246314.59N 17%
Max.tensile forcefor 132kVTower 265627.32N 216404.80N 19%
Max. Shear force for 132kVTower 1912.10N 1756.07N 8%
Wind force on conductor for 220kV Tower 15168.20N 12652.53N 17%
Wind force on tower body for 220kV Tower 101298.00N 74465.60N 26%
Max. compressive force for 220kV Tower 384312.19N 297035.43N 23%
Max.tensile forcefor 220kVTower 345422.06N 257526.37N 25%
Max. shear force for 220kVTower 1317.60N 1072.76N 19%
5.0 DISCUSSION
a) IS802produceshigherconductorforcesundersynoptic wind (22–26%) mainly dueto the application of gust response factors after converting gust wind speed to mean wind speed, which increases wind demand on flexiblecomponents.
b) AS/NZS 7000 predicts lower conductor forces under synopticwindbecausespanreductionfactorsaccount for reduced spatial correlation of wind pressure over longspans,significantlymoderatingconductorloads.
c) Towerbodyforcesundersynopticwindshowlimited variation (within about ±10%) between the two standards, indicating similar treatment of force
coefficients and height-dependent wind profiles for latticestructures.
d) Underdowndraftwindconditions,AS/NZS7000results in progressively higher wind forces with increasing height, reducing the influence of span reduction and leadingtolargerdifferenceswithIS802(upto~15% forconductors,~25%fortowerbodyand,~20%for memberforces).
e) Structuralanalysisconfirmsthatmemberaxial forces andbasereactionsdirectlyreflecttheappliedwindload trends,withIS802consistentlyyieldinghigherinternal forcesduetoitsmoreconservativegusttreatment.
a) Wind forces onconductorsobtained usingIS 802are consistentlyhigherthanthosefromAS/NZS7000,with differences of about 22–26% under synoptic wind conditions.
b) Under downdraft wind conditions, the difference in conductor wind force increases with height, ranging from nearly zero at lower heights to about 20% at higherelevations,indicatingstrongheightdependency.
c) Windforceactingonthetowerbodyshowsrelatively small variation between the two standards under synoptic wind, generally within ±10%, and in some casesAS/NZS7000producesmarginallyhighervalues.
d) Fordowndraftwind,towerbodyforcescalculatedusing IS 802 increases significantly with height, with differencesreachingupto25–30%athigherlevels.
e) Structural analysis results indicate that the overall towerresponseisgovernedmainlybyconductorwind loads,whiletowerbodywindloadshavea secondary influenceformulticircuittowers.
f) Thestudyhighlightsthatexplicitconsiderationofwind mechanismssuchassynopticanddowndraftwinds,as providedinAS/NZS7000,canleadtomorerationaland transparent wind load assessment for transmission towers
[1] IS 802 (Part 1/Sec 1):2015 Use of Structural Steel in OverheadTransmissionLineTowers-CodeofPractice. AS/NZS7000:2016Overheadlinedesign
[2] Rahul Dhama, B.S. Tyagi; “Analysis of Transmission Towerof132KVAunderDifferentWindLoads(asper IS:875-2015Part-III)byusingSTAADPro”International Research Journal of Engineering and Technology, July 2020,Volume07,Issue07.
[3] GhugalY.M.andSalunkheU.S.;AnalysisandDesignof Three-Legged400kVDoubleCircuitSteelTransmission LineTowers”;InternationaljournalofCivilEngineering andTechnology(IJCIET),Volume4,Issue-3,May-June (2013),pp197-209.
International Research Journal of Engineering and Technology (IRJET) e-ISSN: 2395-0056
Volume: 13 Issue: 03 | Mar 2026 www.irjet.net p-ISSN: 2395-0072
[4] BhardwajH.L.,Ajit,andKaushikY;“AnalysisandDesign of Four Leg Steel Transmission Tower Using STAAD.Pro”, International Journal of Advanced Engineering, Management and Science (IJAEMS), Volume1,Issue-4,July-2015,pp7-13.
[5] Tanvi G. Londhe, Prof. M.S. Kakamare, “Comparative Study of Dynamic Analysis of Transmission Towers”, International Research Journal of Engineering and Technology(IRJET),Volume05,Issue08,Aug2018.
[6] Balaji Patil, K.S. Upase, Prof. Hamne A.A.; “Design and analysis of transmission line tower using Staad pro., Volume07,Issue07,July2020.
[7] NagaSubramanianG.;“Designofcelltransmissiontower withdifferentbracingpatters”,Volume10,Issue12,Dec 2023.