

International Research Journal of Engineering and Technology (IRJET) e-ISSN: 2395-0056
Volume: 13 Issue: 05 | May 2026 www.irjet.net p-ISSN: 2395-0072
ASSESSMENT OF SEASONAL VARIATIONS IN NOISE POLLUTION AT SELECTED LOCATIONS OF AMRAVATI CITY
Adiba Abdul Rahman1, Prof. M. Iqbal2
1PG student, Civil Engineering Department, Government College of Engineering, Amravati (M.S.), 444604, India. 2Adjunct Professor, Civil Engineering Department, Government College of Engineering, Amravati (M.S.), 444604, India.
Abstract-The rapid urbanisation, increase in the volume of vehicular traffic and commercial activities have led to the serious environmental problem of noise pollution. In the present study noise pollution level has been measured in the residential, commercial, transport, industrial, silent zones of Amravati and compared with guidelines of Central Pollution Control Board (CPCB). The noise pollution was measured by using sound level meter at 22 monitoring locations during rainy, winter and summer seasons. The performance of several noise indices such as Leq, Lmax, Lmin, L10, L50, L90, NC, LNP and TNI were assessed. The results showed that most of the locations of Silent, Residential, Commercial and Transportation zones were above the permissible limits of CPCB while Industrial zones were within the limits. The highest exceedances were recorded at silentzoneslocationS1 (61.6% above the limit in winter), residential zone R5 (41.4%), commercial zone C2 (32.2%) and transport zone T2 (18.5%). Maximum noise was observed in winter with seasonal variation, followed by rainy and summer seasons because of increased vehicular traffic, honking and roadside commercial activities, crowding and atmospheric conditions (temperature inversion, increased humidity, low wind) that reduce sound dispersion. The study highlights the need for focused traffic management, strict implementation of CPCB rules, public awareness campaigns and constant monitoring to mitigate urban noise pollution.
1. INTRODUCTION
Noiseistheunwantedsoundproducedbyseveralnaturalor man-made activities such as construction, industrial, transportationetc,orduetopressurevariationsinamedium (generallyair),arisingfromvibrationorturbulence[1][2]. The word'Noise' isderived from the Latin word“nausea” meaningUnpleasantSound,UnwantedSound,Soundthatis loud,AHarshSound,andSoundthatisunexpected.Noiseis anunwanted,loudandunexpectedsoundwithunpleasant, detrimentalphysiologicalandpsychologicaleffectonhuman [3]
The sources of noise levels vary with the type of neighbourhood; the level of noise in high density areas is
significantlydifferentfromthatoflowdensityarea[4].The soundornoisemaybegeneratedfromdifferentsourceslike transport noise, industrial noise, domestic noise, other activities[5][6].Automobiles, construction, festivals, factories,stations,dieselshades,garagesandworkshopsare sourcesofnoise[7].Noisepollutioniscausednotonlyinthe urbanareasbutthesuburbanandruralareasnearbydueto creationofnewtransportationroutesandmaintenanceand operationoftheexistingones[8].Motorvehicles,industrial activities,streetvendors,andpublicgatheringsaresources of environmental noise that causes stress, sleep disturbances, cardiovascular diseases, hearing loss, and cognitivedecline[9].Thestudyfoundvehicularpollutionas oneofthemostprominentcauseofnoisepollutionandloud music as the second most prominent cause of noise pollution[10].Therearemanyfactorwhichcausesthenoise pollution in construction site. Noises from machinery or handwork construction such as piling, welding, knocking, hammeringorevenmaterialtransportation[24].
The study shows that female youth are more sensitive as compared to male youth about noise pollution in Delhi. It alsoshowsthatnoisepollutionatnightismoredetrimental forthecardiovascularhealthofa humanbeingthannoise pollution during the day[10]. According to the latest publicationoftheWorldHealthOrganization(WHO,2018) atleast100millionpeopleareaffectedbytheroadnoisein theEuropeanUnionandatleast1.6millionyearsofhealthy lifearelosteveryyear.Noiseinterfereswithcommunication, concentration,relaxationandsleep[3].
The negative impacts on health include headaches, sleeplessness,psychologicaldisorders,lackofconcentration at work, and others like hearing loss, learning difficulties, stroke, hypertension, and reduced quality of life [11]. A report showed that high-intensity noise exceeding the recommendedlimitof70dBcanleadtowork-relatedhealth problems.Theseissuesincludenoise-relatedconditionssuch as headaches and hearing damage. Noise-induced hearing loss is a disorder that cannot be reversed, but it can be prevented[12]. Noise-induced hearing impairment, interference with speech communication, disturbances
International Research Journal of Engineering and Technology (IRJET) e-ISSN: 2395-0056
Volume: 13 Issue: 05 | May 2026 www.irjet.net p-ISSN: 2395-0072
during rest and sleep, effects on mental health and performance,changesinresidentialbehaviour,annoyance, and interference with intended activities are all concerns [13].
2. METHODOLOGY
2.1
Study area description
ThelocationforthisstudywasAmravatiwhichislocatedin Maharashtra, India. It is ranked as the seventh most populated city in Maharashtra and has approximate latitudinal and longitudinal coordinates of 20°56′ N and 77°47′E,respectively.TheAmravatiMunicipalCorporation hasageographicalareaofabout121.65km²withacensus population of 647,057 according to the 2011 census. AmravatiislocatedontheNationalHighway(NH6),which connectsthecitiesofMumbaiinthewesttoKolkatainthe east, providing a good network of road and railways connecting Amravati with most of the major cities in India[14].Rapidurbanization,increasingnumberofmotor vehicles,increasedcommercialactivitiesandmixedlanduse developmentshaveallcontributedtoasignificantincrease in the level of noise. The area within study boundaries includes: residential areas, commercial areas, industrial areas, areas designed as silence zones (hospitals and educational institutions), and busy transportation areas; thus making Amravati an excellent place to assess noise pollution.
2.2 Selection of monitoring locations
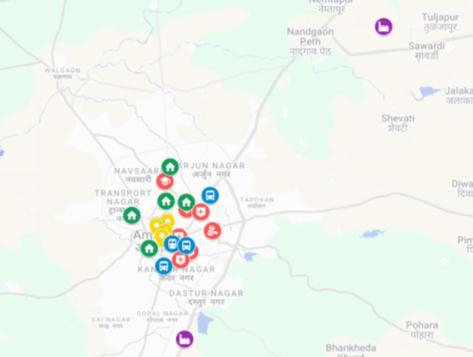
Monitoring sites were selected based on the intensity of traffic, level of human activity and the degree of environmentalsensitivitythatexistedineachzone.Atotalof 22locationswereidentified (seetables1 - 5)aspotential locationsformonitoringnoiseineachofthedifferentland usezones.Tofacilitatemappingoftheresults,acolourcode was assigned for each different land use zone as follows: Silentzone(red),ResidentialZone(green),CommercialZone (yellow), Transport Zone (blue) and Industrial Zone (purple). These sites were plotted on Google Map to illustratetheirspatialdistributionasshowninfig1.
2.2.1
Silent zone
Silence zones are defined as areas within 100 meters of sensitive premises. Such as areas around hospitals, educational institutions, and courts where strict noise control is required to maintain a peaceful environment. Theseareasare expected to havelower permissible noise limits.Themonitoringlocationsselectedforthesilentzone areshowninTable1.
Table-1:Monitoringlocationsofsilentzone.
2.2.2
Residential zone
Theterm"ResidentialZone"isusedtorefertothelandthat isintendedforhousing;Housingisthepredominantuseof thelandwithinthosezones.Residentialareastypicallyhave lowlevelsofnoisebutareverysensitivetolevelsofnoise given the significant potential of continuous exposure of humans. The monitoring locations selected for the residentialzoneareshowninTable2.
International Research Journal of Engineering and Technology (IRJET) e-ISSN: 2395-0056
Volume: 13 Issue: 05 | May 2026 www.irjet.net p-ISSN: 2395-0072
Table-2:MonitoringlocationsofResidentialzone.
Sr no
1 SaraswatiNagar R1
2 BehindRohinipark R2
3 RathiNagar R3
4 AmbaGate R4
5 Jamilcolony R5
2.2.3 Commercial zone
Commercial zones refer to a wide variety of markets, shopping centres, and business and commercial districts. Commercial zones are characterized by significant human activity(suchasshopping,etc.)andthereforehigherlevels of noise. The locations of noise monitoring sites in commercial zones are primarily determined by the commercialdensity,theamountoftrafficandthefrequency ofpedestriantrafficatthoselocations,monitoringlocations selectedforthecommercialzoneareshowninTable3.
Table-3:MonitoringlocationsofCommercialzone.
Sr no
1 CottonMarket C1
2 ItwaraBazar C2
3 JaistambhChowk C3
4 RajkamalSquare C4
2.2.4 Transport zone
Transport zones refer to the major roads/highways, Bus Stops, Train Stations and Bus /Truck Transport and TRANSITSTOPS(Intersections)wherevehiclesmakenoise. Themonitoringlocationsselectedforthetransportzoneare showninTable4.
Table-4:MonitoringlocationsofTransportzone.
Sr no Location Location Code
1 Amravati
2.2.5 Industrial zone
Industrial zones are defined by the presence of manufacturingprocessesandheavydutyvehiclesthatcreate noise.ThesitesselectedforNoiseMonitoringinIndustrial Zones are based on the location of Industrial areas with active manufacturing and traffic. The selected industrial monitoringsitesarelistedinTable5.
Table-5:MonitoringlocationsofIndustrialzone.
Sr no Location Location Code
1 MIDCAmravati I1
2 MIDCNandgaonPeth I
2.3 Instrumentation
TheKOICOSoundLevelMeterwasusedtomeasureambient noise. It was inspected and calibrated by following the manufacturer's instructions and guidance. Ambient noise wasmeasuredinA-weighteddecibels(dB) itmeasurethe ambientsoundlevelsforsoundsthataretypicallyheardby people.
2.4 Data collection procedure
Ambient noise level data were collected on a systematic basis at the designated measurement sites over three seasonstoprovideforenvironmentalvariationinambient sound.Threedistinctperiodsoftheday(morning,afternoon, andevening)formedthebasisforsamplingallmeasurement locationsduringthreeseparatesamplingeventsforeachof the three seasons (morning 08:30–10:30, afternoon 13:00–15:00,andevening 17:30–19:30)inordertoobtain measurementsofvariouslevelsofactivityoccurringatthose locations.
Standardoperatingprotocolwasfollowedforallsampling. At each sampling location KOICO sound level meter was placed1.2–1.5mabovethegroundandatleast3.5maway fromreflectingsurfaces;specialcarewastakentoprovide fornoobstructionsorinterference,aswellastoassurethat eachsamplingperiodwasnolessthanapproximately15–20 min[15]. The 15–20 minute sampling period was used to provideforestablishingastableequivalentsoundlevel(Leq) foraparticularlocationandtimeperiod,whichisconsistent withpreviousstudiesandrecommendedbyBritishStandard BS:3425-1966[16][17].
All data collected were compiled in an Excel spreadsheet. Using daily averaged sound level (Leq) and other noise
International Research Journal of Engineering and Technology (IRJET) e-ISSN: 2395-0056
Volume: 13 Issue: 05 | May 2026 www.irjet.net p-ISSN: 2395-0072
indicesforallsoundleveldataaveragedonadailybasisfor three-dayLeq measurementswereobtainedbaseduponthe locationofthestudysiteandtimeofyearthemeasurements werecollected.Noiseindicesandstatisticalanalyseswere completedperseasonandinclude:Leq,Lmax,Lmin,L10,L50,L90, NC,LNP,andTNI.
2.4.1 Seasonal monitoring frame work
A seasonal comparative framework was used to study variationsinnoiseineachzone[22][23].Theseasonsstudied were rainy from October 6 – November 16, 2025, winter: December15,2025–January4,2026,andsummer:March 23–April12,2026.Theprimaryareaoffocusofthestudy was the seasonal variation of average Leq, and the identificationofapeaknoiseseasonforeachzone.
2.4.2 Quality control and precautions
Thefollowingprocedureswereestablishedtomaintainhigh qualityanddependabledata:
Calibration of instruments was completed prior to takingreadings.
Selecting appropriate monitoring locations that are representativeandunobstructed.
Excludingmeasurementswheretheweatherconditions atthetimeofmeasurement(i.e.,rainorstrongwinds) havebeenadverse.
Takingmultipleshort-termreadingsinordertoreduce randomerror.
Excludingdataassociatedwithabnormalortemporary events(i.e.,trafficcongestion,excessivehornhonking). These procedures were taken to minimize external interference and to obtain state noise level data that is consistentandcomparableacrossallsitesandseasons.
2.5 Description of noise indices
A number of metrics were calculated from the data on recorded noise in order to provide an understanding of noise.Theyare:Leq,Lmax/Lmin,percentilelevels(L10,L50,L90), NC,LNP,TNI[20][21].Thecalculatedmetricsprovideaclear indicationofthecharacteristicsofnoise,identifytheareas that are being most impacted by them, indicate seasonal variationsinperformanceaswellascompareperformance toCPCBacceptedlimits.
Leq (Equivalent Continuous Noise Level)
= L50+[(NC)2/ 60]
Lmax = maximum value of data set
Lmin = minimum value of data set
Percentile Levels (L10, L50, L90)
NC (Noise Climate)
= L10-L90
LNP (Noise Pollution Level)
= Leq + NC
TNI (Traffic Noise Index)
= 4 (L10-L90) + (L90- 30)
2.6 CPCB ambient noise standards
Thecomputednoiseindicesarecomparedwithpermissible limitsprescribedbytheCPCBfordifferentzonesasshownin Table 6. The CPCB has prescribed Ambient Air Quality Standards in respect of Noise underthe Noise Pollution (Regulation and Control) Rules, 2000 (under the Environment Protection Act, 1986). These standards are widelyusedin environmental impact assessment. These limitsare defined as equivalent continuous sound level (Leq), representing average noise over a period. And is crucial for assessing compliances and planning effective noisemitigationstrategies.SinceCPCBdoesnotprescribea separate category for transport zones, traffic/transportdominated areas were considered under the Commercial Area category as per CPCB Ambient Noise Standards and mixedland-useprovisions.
Table-6:CPCBAmbientNoiseStandards(India)[18][19].
3. RESULTS AND DISCUSSION
The measured noise levels were evaluated against CPCB permissible limits as shown in table 7 and analysed seasonally to assess environmental influences also illustratedinfig2.
International Research Journal of Engineering and Technology (IRJET) e-ISSN: 2395-0056
Volume: 13 Issue: 05 | May 2026 www.irjet.net p-ISSN: 2395-0072
3.1 Zone wise comparison with CPCB ambient noise standards
3.1.1 Silent zone:
FindingsfromtheanalysisofSilentZones(S1-S7)indicated thatallthreeseasonswereabovetheCPCBpermissiblelevel ofSoundEmission.Allthreeseasonswerefoundtohavethe highest level of Leq levels in winter when the levels of Leq exceededbyanaverageof42%to62%.Thestudyfoundthat S1 had the highest level of Leq in winter (80.80); all other stations measured lower levels specifically S4 and S5. The reason for exceedance can be attributed to continuous vehicular movement, frequent horn use, commercial businessesalongtheroadsidefromthemovementofpeople on the street, the transporting of people on the street, urbanizationoftheareanearbyandlittleenforcementofthe SilentZoneRegulatoryGuidelines.Theoverallconcentration of continuous noise is impacting the Silent Zone area as a resultoftrafficcongestionandcommercialactivityaround sensitiveareas.
3.1.2 Residential zone:
ItwasfoundthatalltheResidentialZonelocations(R1–R5) analyzed, had noise levels exceeding the Central Pollution ControlBoard(CPCB)permissiblelimitof55dB(A)during allseasons;theR5 locationhadthemaximumlevelofLeq of 77.7 dB(A) during the rainy season; this represents an exceedanceof41.4%,whiletheR2 locationwasobservedto havetheminimumlevelofnoise;theaveragelevelofnoise washigher for rainyandwinterseasonsthanforsummer season.Themostsignificantcontributorstoexcessivenoise included heavy vehicular traffic, traffic congestion, mixed land use, commercial activities along roads, pedestrian activity,classesforprivatetuition,andrapidurbansprawl. Overall, significant levels of noise pollution existed in residential areas as a result of increased density of traffic andotherhumanactivities.
3.1.3 Commercial zone:
TheanalysisofCommercialZones(C1-C4)showsthatnoise levels were above the CPCB allowable 65 dB(A) for all Seasons.C2hadthehighestrecordedLeqvaluesof86.0dB(A) duringtheRainySeasonandexceededtheallowablelevelby 32.2%.Overall,theRainySeasonproducedthehighestnoise level across all Commercial Sites. The major sources of excessive noise in the Commercial Zones were heavy vehicular traffic, congested markets, roadside vendors, signalized intersections, loading/unloading activity's, congestion,andhigh-volumeofpublicmovement.Basedon theseresults,theCommercialZoneswerefoundtohavethe
highestnoisepollutionofallofthestudiedzonesduetothe continualcommercialandtransportationactivities.
3.1.4
Transport zone:
TheTransportZonelocation(T1toT4)analysisindicatedan excess of the CPCB prescribed 65 dB(A) commercial area noiselimitforallseasons.TheT2 sitegeneratedthehighest noise levels averaging approximately 77 dB(A) Leq specificallyduringthemonsoonseasonandwiththehighest maximum exceedance. The winter season exhibited generallyhighernoiselevelscomparedtootherseasonsas well, which can be attributed to traffic density causing an increaseincongestionanddecreasedatmosphericdispersal of sound. Key contributors to the noise included the continuous movementofbuses/trains;excessivehonking; large crowds of people in motion; roadside vendors; and nearby commercial establishments. Therefore, transport zoneshavehighlevelsofnoisepollutionfromacombination ofbothheavytransportationactivityandtrafficcongestion, primarilyaroundbusterminalsandrailstations.
3.1.5 Industrial zone
Industrial Area (I1-I2) Noise level Analysis: all seasons’s noise levels were within the CPCB permissible limit of 75 d.B(A).
3.1.6
Zone-wise seasonal variations:
Noise pollution varied significantly across different zones andseasonsinAmravati.Silentzonesrecordedthehighest noise levels, followed by Commercial, Residential, and Transport zones, while Industrial zones remained within CPCBlimitsasshowninFig2.
Chart – 1: Comparison of average weekly Leq of rainy, winterandsummerseasonwithCPCB.
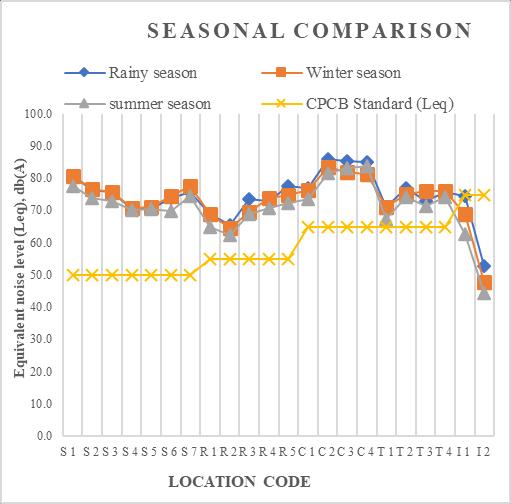
Winter showed the highest noise levels due to poor atmosphericdispersion,increasedtraffic,andpublicactivity, whereassummerrecordedcomparativelylowernoiselevels.
International Research Journal of Engineering and Technology (IRJET) e-ISSN: 2395-0056
Volume: 13 Issue: 05 | May 2026 www.irjet.net p-ISSN: 2395-0072
Rainy season also experienced high noise because of congestion,wetroads,potholes,andfrequenthonking.The mostaffectedlocationswereS1(Silentzone),R5(Residential zone), C2 (Commercial zone), and T2 (Transport zone) as shownintable7.
Table-7:SeasonalComparisonofWeeklyAverageLeq withCPCBStandards. Location
2026, IRJET | Impact Factor value: 8.315 |
International Research Journal of Engineering and Technology (IRJET) e-ISSN: 2395-0056
Volume: 13 Issue: 05 | May 2026 www.irjet.net p-ISSN: 2395-0072
CONCLUSION
Ambient noise pollution has been assessed in the Silent, Residential, Commercial, Transport, and Industrial zones of Amravati, and the observed Leq were compared with CPCB permissible limits. The results indicate that in most locations of the Silent, Residential,Commercial,andTransportzones,noise pollution was beyond the given CPCB standards, projectingthatitsurbanstateisseverelypolluted.
Silent zones registered the highest noise limit exceedance, with peak exceedance level ranging around40%–62%aboveCPCBstandards.ThesitesS1 recordedthemaximumexceedanceduringtherainy season(61.4%),winter(61.6%),andsummer(55.1%), while locations S2, S3, S6, and S7 showed exceedance withintherangeof45%–55%.
Therewasalargeexcessiveamountofnoiseabovethe CPCB noise limit of 55 dB(A), with the exceedance lyingbetween13.7%–41.4%.ThesiteR5recordedthe highestexceedanceof41.4%duringtherainyseason, whileR3 andR4 withexceedanceof25%–34%,andR2 withacomparativelylowerlevelofexceedance,within 13.7%–19.1%.
Commercialzonesremainedpersistentlyhighly polluted in every one of the seasons, with exceedancerangingapproximatelyfrom13%–32%. However,C2wasthesitewiththeworstexceedanceof 32.2%,followedcloselybyC3 andC4 withexceedance of around 25%–31%; C1, meanwhile, showed lessexceedancenoiselevelsofbetween13.1%–18.3%.
TheTransportZoneswereallprovedtobeinviolation ofthemaximumallowablenoiselimits(65dB(A)).The amount of time that the Transport Zones are in violationrangesfromapproximately3.5%to18.5%. For example, Transport Zone 2 has the highest percentage of time in violation at 14.1% to 18.5%; Transport Zones 3 and 4 have shown a similar percentage of time in violation at 10% to 17%; and Transport Zone 1 demonstrates the least amount of timeinviolationat3.5%to9.5%.
AlloftheIndustrialZones(I1&I2)wereabletoremain belowtheCPCB'smaximumallowablenoiselimits.
Thewinterseasonwasnotedtohavehadthehighest overallnoiselevelsatmostofthelocations,withthe second highest being the rainy season. The summer season had the lowest overall noise levels. The increasedamountofnoiseduringwinterismainlydue to lack of air dispersion, population density, and increasedtrafficactivity.
The primary contributors to environmental noise pollution in the city of Amravati include: vehicular traffic, excessive/repeated honking, roadside congestion, commercial activities, mixed land use, pedestrian activity, and lack of public education on noisemitigationtechniques.
The need to continue developing effective traffic managementplans,enforcingexistingnoiseabatement regulations, developing greenbelts, developing consistent procedures for honking, and conducting continuous monitoring measures will significantly helptoreducethelevelsofurbannoisepollutionand improve the overall condition of the Amravati's EnvironmentalQuality.
RECOMMENDATIONS
The study's results emphasize the need for targeted improvements:bettertrafficmanagementsystems,stricter enforcementofnoiselaws(especiallyinareasdesignatedas quiet), development of green buffer zones, controls on unnecessaryhonking,communityeducationalprograms,and sustainedmonitoringofambientnoiselevelstohelpreduce noise pollution and improve the environmental quality of AmravatiCity.
REFERENCES
1. Sudhanshu Bhushan And A.K. Shukla., ‘Study Of Noise Pollution Level Using Noise Indices In The City Of Lucknow, Uttar Pradesh, India’, Journal Of Emerging Technologies And Innovative Research (Jetir), Issn2349-5162,July2018.
2. Shweta Srivastava And Gayatri Rai., ‘An Evaluation Of NoisePollutionLevelInLucknowCity,UttarPradesh’, Ngji, An International Peer-Reviewed Journal, Issn: 0027-9374/2020/1732,1March2020.
3. Madhu Bala., Deepak Verma., ‘Investigation &Examination Of Noise Pollution -Definition, Sources, Effects,MonitoringAndControl’,InternationalJournal Of Research In Social Science, Issn: 2249-2496, July 2020.Doi:Http://Www.Ijmra.Us
4. Musbah Aissa Mohamed., ‘A Study Of Noise Pollution AndImpactOnHumanHealth’,InternationalJournalOf MultidisciplinaryAndCurrentReserch,Issn:2321-3124, 07 Dec 2021.Doi: Https://Doi.Org/10.14741/Ijmcr/V.9.6.3
5. Surabhi Srivastava., ‘Effect Of Noise Pollution And Its SolutionThroughEco-FriendlyControlDevicesInThe North East India’, International Conference On
International Research Journal of Engineering and Technology (IRJET) e-ISSN: 2395-0056
Volume: 13 Issue: 05 | May 2026 www.irjet.net p-ISSN: 2395-0072
Modelling,OptimizationAndComputing(Icmoc2012), 1877-7058,2012.Doi:10.1016/J.Proeng.2012.06.024
6. Bureau Of Indian Standards (Bis), Is: 4954.1968, Recommendations For Noise Abatement In Town Planning,1969.
7. G.C. Kisku., Kailash Sharma., Et Al., ‘Profile Of Noise Pollution In Lucknow City And Its Impact On Environment’, Journal OfEnvironmental Biology,June 2006.
8. Walihabib Hemmat., Atiq Mohammad Hesam., Et Al., ‘Exploring Noise Pollution, Causes, Effects, And Mitigation Strategies: A Review Paper’, European Journal Of Theoretical And Applied Sciences(Ejtas),1(5),995-1005,Issn:2786-7447,2023. Doi:10.59324/Ejtas.2023.1(5).86
9. Mohamed Mustapha Abu., Fawaz Khalil Jalloh., Et Al., ‘Assessment Of Background Noise Levels In Four CommercialAreasOfFreetown,SierraLeone’,European Journal Of Applied Science, Engineering And Technology,Issn:2786-9342,04June2025.
10. SabaIsmail.,ShahidAhmad.,‘NoisePollution,ItsSources And Effects: A Case Study Of University Students In Delhi’, Epra International Journal Of Economic And BusinessReview,Issn:2349-0187,Feb2018.
11. EbiwariWokekoro.,‘PublicAwarenessOfTheImpactOf Noise Pollution On Human Health’, World Journal Of Research And Review (Wjrr), Issn: 2455-3956, June 2020.
12. Chinelo Chidinma Chukwuma., Edwin Okechukwu Nwobodo., Et Al., ‘Evaluation Of Noise Pollution On Audio-Acuity Among Sawmill Workers In Nnewi Metropolis,AnambraState,Nigeria’,EuropeanJournal Of Pharmaceutical And Medical Research, Issn: 23943211,04March2022.
13. Guidelines For Community Noise., World Health Organization, Geneva Cluster Of Sustainable Development And Healthy Environment (Sde), Department Of The Protection Of The Human Environment (Phe,) Occupational And Environmental Health(Oeh).
14. EnvironmentalStatusReport(2016-2017)ForAmravati MunicipalCorporationByCoreProjectEngineersAnd ConsultantPvt.Ltd.,Amravati.
15. Bureau Of Indian Standards (Bis), Is: 9989 -1981, Assessment Of Noise With Respect To Community Response,1982.
16. Johnson,D.R.AndWood,R.‘StudyOnPeriodicTraffic Noise Sampling Methods For Environmental Noise Assessment’,(1971).
2026, IRJET | Impact Factor value: 8.315 |
17. BureauOfIndianStandards(Bis),Is:3483-1965,Code OfPracticeForNoiseReductionInIndustrialBuildings, 1966.
18. Sh.VishalGandhi.,ShJKVimal.,EtAl.,‘CentralPollution Control Board Real Time National Ambient Noise Monitoring Network In The Year 2011’, Status Of AmbientNoiseLevelsInIndia.,2015-2016.
19. The Noise Pollution (Regulation And Control) Rules, 2000.,MinistryOfEnvironmentAndForests.,NewDelhi, The14thFebruary,2000.
20. ArchanaRAndHarshanKG.,‘MappingAndAssessment Of Noise Pollution Using Gis In Calicut City’, International Research Journal Of Engineering And Technology(Irjet),Issn:2395-0056,July2020.
21. RajkumarRampalAndArpanaDuggal.,‘AssessmentOf IndoorNoiseLevelInSomeFactoriesOfIndustrialAreas Of Jammu,(J&K),India’, International Journal Of EngineeringResearch&Technology(Ijert),Issn:22780181,April–2013.
22. Bilal Khan., Asma Jamil., Et Al., ‘Effect Of Seasonal Variation And Meteorological Parameters On The EnvironmentalNoisePollutionInTheSelectedAreasOf RawalpindiAndIslamabad,Pakistan’,PolishJournalOf Environmental Studies, 2021. Doi: Http://Dx.Doi.Org/10.15244/Pjoes/132980
23. RRuiz-Paez.,JaLópez-Bueno.,EtAl.,‘Short-TermEffects OfChemicalAndNoisePollutionDuringHeatAndCold WavesOnEmergencyHospitalAdmissionsInMadrid’, InternationalJournalOfBiometeorology,30June2025. Doi:Https://Doi.Org/10.1007/S00484-025-02963-Y
24. Chow Yi Feng1., Nur Ilya Farhana Md Noh1., Et Al., ‘StudyOnTheFactorsAndEffectsOfNoisePollutionAt ConstructionSiteInKlangValley’,JournalOfAdvanced Research In Applied Sciences And Engineering Technology, Issn:2462-1943, 2020.Doi: Https://Doi.Org/10.37934/Araset.20.1.1826